ACPD
7, 2197–2248, 2007Cross-tropopause transport of biomass
burning pollution
B. N. Duncan et al.
Title Page
Abstract Introduction
Conclusions References
Tables Figures
◭ ◮
◭ ◮
Back Close
Full Screen / Esc
Printer-friendly Version
Interactive Discussion
EGU Atmos. Chem. Phys. Discuss., 7, 2197–2248, 2007
www.atmos-chem-phys-discuss.net/7/2197/2007/ © Author(s) 2007. This work is licensed
under a Creative Commons License.
Atmospheric Chemistry and Physics Discussions
Model study of the cross-tropopause
transport of biomass burning pollution
B. N. Duncan1,2, S. E. Strahan1,2, and Y. Yoshida1,2
1
Goddard Earth Sciences and Technology Center, University of Maryland, Baltimore County, Baltimore, Maryland, USA
2
The Atmospheric Chemistry and Dynamics Branch, NASA Goddard Space Flight Center, Greenbelt, Maryland, USA
Received: 25 January 2007 – Accepted: 12 February 2007 – Published: 15 February 2007
ACPD
7, 2197–2248, 2007Cross-tropopause transport of biomass
burning pollution
B. N. Duncan et al.
Title Page
Abstract Introduction
Conclusions References
Tables Figures
◭ ◮
◭ ◮
Back Close
Full Screen / Esc
Printer-friendly Version
Interactive Discussion
EGU
Abstract
We present a modeling study of the troposphere-to-stratosphere transport (TST) of pollution from major biomass burning regions to the tropical tropopause layer (TTL) and lower stratosphere (LS). We show that biomass burning pollution regularly and significantly impacts the composition of the TTL/LS. TST occurs through 1) slow
as-5
cent in the TTL and 2) quasi-horizontal exchange in the regions of the subtropical jets; we find both pathways to be important. The seasonal oscillation in CO in the TTL/LS (i.e., the CO “tape recorder”) is caused largely by seasonal changes in biomass burn-ing. Another contributing factor is the long-range transport of northern hemispheric pollution (e.g., biofuels and fossil fuels) to the northern tropics in boreal winter. Other
10
tropical sources of CO (e.g., methane oxidation) have insignificant seasonal variation, contributing little to the tape recorder. Interannual variation of CO in the TTL/LS is caused by year-to-year variations in biomass burning and the strength, frequency, and locations of deep convection, which lofts pollution to the upper troposphere. During our study period, 1994–1998, we find that the highest concentrations of CO in the TTL/LS
15
occur during the strong 1997/98 El Ni ˜no event for two reasons: i. tropical deep con-vection was stronger and ii. emissions were higher. This extreme event can be seen as an upper bound on the impact of biomass burning pollution on the TTL/LS. We esti-mate that the 1997 Indonesian wildfires increased CO in the entire TTL and tropical LS (<60 mb) by more than 40% and 10%, respectively, for several months. Zonal mean
20
ACPD
7, 2197–2248, 2007Cross-tropopause transport of biomass
burning pollution
B. N. Duncan et al.
Title Page
Abstract Introduction
Conclusions References
Tables Figures
◭ ◮
◭ ◮
Back Close
Full Screen / Esc
Printer-friendly Version
Interactive Discussion
EGU
1 Introduction
Schoeberl et al. (2006) identified the stratospheric “tape recorder” in carbon monoxide (CO), a seasonal oscillation in tropical lower stratospheric CO, in the Aura Microwave Limb Sounder (MLS) data. The term “tape recorder” was coined to describe the sea-sonal progression of tropical water vapor observed by the Upper Atmosphere Research
5
Satellite (UARS) (Mote et al., 1996, Randel et al., 2001). Unlike the water vapor tape recorder which is controlled by seasonal variation in tropical upper tropospheric tem-peratures, Schoeberl et al. found that the CO tape recorder is linked to seasonal biomass burning, closely following the two maxima in the tropics that occur around March and September of each year (Duncan et al., 2003a). The main objectives of this
10
modeling study are to discuss the troposphere-to-stratosphere transport (TST) of trace gases from biomass burning and to assess the impact of the pollutants on the chem-istry of the upper troposphere (UT) and lower stratosphere (LS). For this work, we use the Global Modeling Initiative’s (GMI) combined stratosphere-troposphere chemistry and transport model (COMBO CTM).
15
Biomass burning pollution is often lofted by convection to the UT (e.g., Pickering et al., 1996), where it can enter the tropical tropopause layer (TTL), a region above the typical maximum vertical extent of convection (∼150 mb) and below the tropopause (∼100 mb). Vertical motions to the tropopause in the TTL are associated with slow,
large-scale ascent due to clear sky radiative heating (Folkins et al., 1999), which varies
20
seasonally with, for instance, temperature and ozone (e.g., Folkins et al., 2006). The level of zero radiative heating (LZH) in the TTL at∼125 mb is generally lower near the
equator and areas of frequent deep convection (Gettelman et al., 2004; Folkins et al., 2006). The LZH is most sensitive to water vapor, though it is also sensitive to ozone and carbon dioxide (Gettelman et al., 2004). Aerosols also impact the radiative budget
25
ACPD
7, 2197–2248, 2007Cross-tropopause transport of biomass
burning pollution
B. N. Duncan et al.
Title Page
Abstract Introduction
Conclusions References
Tables Figures
◭ ◮
◭ ◮
Back Close
Full Screen / Esc
Printer-friendly Version
Interactive Discussion
EGU Newell and Gould-Stewart (1981) postulated the existence of a “stratospheric
foun-tain”, an area where tropospheric air preferentially enters the stratosphere, over In-donesia and India during their respective monsoon seasons. Their hypothesis has generated considerable debate over the existence of a fountain (e.g., Dessler, 1998; Sherwood, 2000; Hatsushika and Yamazaki, 2003). Fueglistaler et al. (2004), using
5
trajectory calculations, found that 80% of their trajectories that ascended to the LS en-tered the TTL over the western Pacific “Warm Pool”, an area with high sea surface temperatures (SSTs) and deep convection. The air in the TTL typically resides there for several weeks and travels∼5000–10 000 km before crossing the tropopause. The preferred locations of TST are the western Pacific Ocean, India, and the Indian Ocean.
10
Biomass burning pollution has been observed to be transported by the southern sub-tropical jet (e.g., Folkins et al., 1997; Chatfield et al., 2002; Staudt et al., 2002), where it can enter the lowermost stratosphere (LMS; i.e., the region below the 380 K poten-tial temperature surface, but above the extra-tropical tropopause), via quasi-horizontal exchange (Holton et al., 1995). The subtropical jets meander around the globe varying
15
in altitude, latitude, and intensity; therefore, the locations, frequencies, etc. of TST via this pathway will vary.
During winter, a strong gradient in potential vorticity creates a barrier to mixing across the subtropical jet. In summer, PV gradients are much weaker and transient wave disturbances can grow in amplitude, break, and cause irreversible mixing between the
20
tropical UT and the LMS. Such disturbances are common in the northern summer near the Asian and Mexican monsoon circulations and allow significant exchange between the tropics and midlatitudes between 100–200 mb (Chen, 1995). However, the LMS is characterized by descending air, so that most of the pollution will eventually return to the troposphere (Schoeberl et al., 2004).
25
ACPD
7, 2197–2248, 2007Cross-tropopause transport of biomass
burning pollution
B. N. Duncan et al.
Title Page
Abstract Introduction
Conclusions References
Tables Figures
◭ ◮
◭ ◮
Back Close
Full Screen / Esc
Printer-friendly Version
Interactive Discussion
EGU of water vapor and polluted air to the stratosphere via convective transport over the
plateau. They found that convection over the plateau is deeper than over the monsoon area, detraining more air near the tropopause. That is, this pathway is a short-circuit to the normal pathway of slow ascent in the TTL.
We do not believe that direct injection of biomass burning pollution above the tropical
5
tropopause via convection is an important transport pathway. Liu and Zipser (2005) an-alyzed five years of TRMM data, concluding that 1.3% of tropical convection systems reach 14 km and 0.1% possibly penetrates the tropopause (i.e., 380 K potential tem-perature). They found that overshooting deep convection occurs predominantly over central Africa, but also over Indonesia and South America. Fueglistaler et al. (2004)
10
found that deep convection penetrating the tropopause is a very small contributor to TST. To our knowledge, pyro-cumulonimbus injection into the tropical LS has not been observed as it has in the boreal regions where the tropopause is lower (e.g., Livesey et al., 2004, Fromm et al., 2005).
Despite local zones of deep convection penetrating the stratosphere, tropical
convec-15
tive systems are not responsible for depositing pollutants at the tropopause. Instead, convective systems largely die out at 350 K and large-scale ascent in the TTL brings air up to the tropical LS (i.e.,≥380 K). The success of the COMBO CTM in reproducing
the CO tape recorder as discussed in Schoeberl et al. (2006) demonstrates that this tool is appropriate to investigate the tropical TST process. MLS CO observations in the
20
UT/LS region may provide us with additional insight.
In this paper, we will show that biomass burning pollution does indeed reach the LS, changing the composition of chemically and radiatively important trace gases there. In Sect. 2, we describe the COMBO CTM and the meteorological fields used to drive its transport. We present a model evaluation in Sect. 3. In Sect. 4, we identify the
25
ACPD
7, 2197–2248, 2007Cross-tropopause transport of biomass
burning pollution
B. N. Duncan et al.
Title Page
Abstract Introduction
Conclusions References
Tables Figures
◭ ◮
◭ ◮
Back Close
Full Screen / Esc
Printer-friendly Version
Interactive Discussion
EGU given in Sect. 6.
2 Global modeling initiative Combined Stratosphere-Troposphere CTM
The COMBO CTM was developed from the stratospheric CTM described by Rotman et al. (2001). Initial descriptions of the COMBO CTM can be found in Ziemke et al. (2006). Strahan et al. (2007) and references therein describe the stratospheric processes in the
5
model.
2.1 Chemistry
The chemical mechanism is obtained by combining tropospheric and stratospheric mechanisms and includes 117 species, 322 chemical reactions, and 81 photolysis re-actions. The chemical mass balance equations are integrated using the SMVGEAR II
10
algorithm (Jacobson, 1995). The tropospheric mechanism includes a detailed descrip-tion of tropospheric O3-NOx-hydrocarbon chemistry (Bey et al., 2001). It has been updated with recent experimental data from Tyndall et al. (2001), Sander et al. (2003), and Atkinson et al. (2003), and data for the quenching reactions of O(1D) by N2, O2, and H2O (Ravishankara et al., 2002; Dunlea and Ravishankara, 2004). The
strato-15
spheric mechanism is described in Kinnison et al. (2001) and Douglass et al. (2004). A description of the polar stratospheric cloud parameterization is provided by Considine et al. (2000). Mixing ratio boundary conditions were imposed for halogen source gases for conditions appropriate for the simulation year as described in Strahan et al. (2007) and Douglass et al. (2004).
20
Photolysis frequencies are computed using the Fast-JX radiative transfer algorithm, which combines the Fast-J tropospheric scheme described in Wild et al. (2000) with the Fast-J2 stratospheric scheme of Bian and Prather (2002) (Michael Prather, personal communication, 2005). The algorithm treats both Rayleigh scattering as well as Mie scattering by clouds and aerosol.
ACPD
7, 2197–2248, 2007Cross-tropopause transport of biomass
burning pollution
B. N. Duncan et al.
Title Page
Abstract Introduction
Conclusions References
Tables Figures
◭ ◮
◭ ◮
Back Close
Full Screen / Esc
Printer-friendly Version
Interactive Discussion
EGU The model simulates the radiative and heterogeneous chemical effects of sulfate,
dust, sea-salt, organic carbon and black carbon aerosol on tropospheric photochem-istry. The monthly-averaged aerosol surface area distributions were obtained from the Goddard Chemistry Aerosol Radiation and Transport (GOCART) model for 2001 (Chin et al., 2002). The aerosol fields were coupled to the COMBO CTM as described by
5
Martin et al. (2003). The reaction probability for N2O5is a function of aerosol type, rel-ative humidity, and temperature, and is significantly lower than earlier estimates (Evans and Jacob, 2005).
2.2 Emissions
Table 1 summarizes the annual anthropogenic and natural emissions.
10
2.2.1 Anthropogenic emissions
The base fossil fuel emissions are described by Bey et al. (2001) and Duncan et al. (“The global budget of CO, 1988–1997: source estimates and validation with a global model”, submitted manuscript; hereafter referred to as Duncan et al., 2007) that includes NOx emissions from the Global Emission Inventory Activity (GEIA)
15
(Benkovitz et al., 1996) and non-methane hydrocarbon (NMHC) emissions from Piccot et al. (1992). The base emissions, which are for 1985, are scaled to reflect emissions in 1995 as described in Bey et al. (2001). Seasonal variation (±10%) is applied for
CO poleward of 35◦N to reflect higher automobile emissions in winter (Duncan et al., 2007). The monthly mean emissions of NOx from aircraft are from the inventory of
20
Baughcum et al. (1996) and Metwally (1995), representing 1995 conditions. Biofuel emissions are estimated from the inventory and emission factors of Yevich and Logan (2003).
For the Indonesian wildfire experiment in Sect. 4, we use the Global Fire Emissions Database version 2 (GFEDv2; Van der Werf et al., 2006). We did not simulate the
25
ACPD
7, 2197–2248, 2007Cross-tropopause transport of biomass
burning pollution
B. N. Duncan et al.
Title Page
Abstract Introduction
Conclusions References
Tables Figures
◭ ◮
◭ ◮
Back Close
Full Screen / Esc
Printer-friendly Version
Interactive Discussion
EGU fires. Duncan et al. (2003b) showed that they decreased OH by about 10% over much
of the Indian Ocean with a concomitant increase in CO by<10%. Neglecting the effect of these aerosols on CO is not important for our study as our purpose is to estimate if the change in the composition of trace gases in the TTL and LS is substantial.
For the experiments in Sect. 5, we use the biomass burning emissions inventory
pre-5
sented in Duncan et al. (2003a), which represents a mean for 1980 to 1990. Categories in the inventory are deforestation, shifting cultivation, agricultural residues burned in the field, savanna burning, and forest fires. Trace gas emission factors are from Andreae and Merlet (2001).
In the inventories described here, we do not directly account for the emissions of
10
several NMHC, such as aromatics, from fossil fuels, biofuels, and biomass burning. We estimate the production of CO from these NMHC by multiplying the emission rate of each NMHC in a given inventory by a yield of CO per carbon oxidized, as described in Duncan et al. (2007). Applying these yields, we find that oxidation of anthropogenic NMHC results in a source of CO that is 2%, 8.6% and 5% of the direct CO emission
15
from fossil fuels, biofuels and biomass burning, respectively. The direct emissions from these three sources are increased to account for the indirect source from oxidation of co-emitted NMHC.
2.3 Natural emissions
The distribution of isoprene emissions from vegetation is based on a modified version
20
of the inventory of Guenther et al. (1995) and is dependent on solar radiation and temperature. The principal modifications are described by Wang et al. (1998) and Bey et al. (2001). The global emission rate of the modified inventory is 380 Tg C/y, which is about 25% lower than the inventory of Guenther et al. (1995), 503 Tg C/y. We do not simulate the transport and chemistry of monoterpenes and methanol directly, but we
25
ACPD
7, 2197–2248, 2007Cross-tropopause transport of biomass
burning pollution
B. N. Duncan et al.
Title Page
Abstract Introduction
Conclusions References
Tables Figures
◭ ◮
◭ ◮
Back Close
Full Screen / Esc
Printer-friendly Version
Interactive Discussion
EGU from the ISCCP cloud climatology (Price et al., 1997). Lightning flash rates used in
constructing these emissions are based on the cloud-top height parameterization of Price and Rind (1992). The vertical distribution of the NOx is specified by the profiles derived from cloud-resolved convection simulations of Pickering et al. (1998).
We compute emissions of NO by soil microbes as described in Wang et al. (1998).
5
The emissions are a function of vegetation type (Olson, 1992), temperature, fertilizer usage, and precipitation history. The scheme simulates the oxidation of NO to NO2 and subsequent uptake by vegetation within the canopy (Jacob and Bakwin, 1991).
2.3.1 Other
Methane mixing ratios are forced at the surface with annual mean values for 2001 using
10
National Oceanic and Atmospheric Administration (NOAA) Global Monitoring Division (GMD) measurements (Dlugokencky et al., 1998). They are zonally uniform in four semi-hemispheres. Monthly-averaged acetone concentrations are specified following Jacob et al. (2002).
2.4 Transport
15
In our study we use five years of meteorological fields from the Goddard Modeling and Assimilation Office (GMAO) GEOS-4 general circulation model (GEOS-4-GCM) (Bloom
et al., 2005), using SSTs representing 1994 to 1998. They have been regridded to 42 vertical levels with a lid at 0.01 hPa; there are∼20 levels from the surface to the LS
(60 mb) with ∼6 levels in the TTL/LS. The horizontal resolution is 2◦ latitude × 2.5◦
20
longitude.
The COMBO CTM transports 71 of the 117 species in the chemical mechanism, using the advection scheme of Lin and Rood (1996). Convective transport is taken from the MATCH model (Rasch et al., 1997), which uses the following meteorological fields as input: cloud mass fluxes, entrainment and detrainment fluxes, and
large-25
ACPD
7, 2197–2248, 2007Cross-tropopause transport of biomass
burning pollution
B. N. Duncan et al.
Title Page
Abstract Introduction
Conclusions References
Tables Figures
◭ ◮
◭ ◮
Back Close
Full Screen / Esc
Printer-friendly Version
Interactive Discussion
EGU algorithms of Hack (1994) and Zhang and McFarlane (1995). The model uses the
Harvard wet scavenging algorithm (Liu et al., 2001) and the dry deposition scheme described by Wang et al. (1998), which follows the methodology of Wesely et al. (1985).
3 Model evaluation
3.1 Summary of previous work
5
Schoeberl et al. (2006) found that the MLS CO tape recorder is similar to that of the model’s, implying that tropical ascent and horizontal mixing in the model’s UT/LS are credible. Ziemke et al. (2006) compared OMI/MLS tropospheric column ozone (TCO) observations with those of the model, finding that the two agree well both spatially and seasonally, including for the South Atlantic maximum and western Pacific
mini-10
mum. The model is typically higher from 30–40◦ latitude of both hemispheres, partic-ularly the northern hemisphere (NH), and too low over the Warm Pool in all seasons. (Ozonesonde data support that the model’s TCO from 30–40◦N is too high.) Strahan et al. (2007) evaluated the model’s performance in the UT/LS using a variety of satellite and aircraft-derived transport diagnostics. They showed that the model has credible
15
seasonally-varying composition and transport in the LS, including the LMS, as well as realistic coupling between the extra-tropical troposphere and stratosphere.
3.2 Troposphere
In this study, we use CO as a tracer of transport as its chemical lifetime is about a month in the tropics, which is typically longer than the timescales of most transport
20
processes, including TST. The evaluation of our 5-yr model run (1994–1998 SSTs) is for CO and OH, as reaction with OH is the primary sink for CO. Our evaluation is nec-essarily qualitative as we use climatological emissions and the meteorology represents no particular time, though it should capture IAV associated with the phases of the El Ni ˜no/Southern Oscillation (ENSO).
ACPD
7, 2197–2248, 2007Cross-tropopause transport of biomass
burning pollution
B. N. Duncan et al.
Title Page
Abstract Introduction
Conclusions References
Tables Figures
◭ ◮
◭ ◮
Back Close
Full Screen / Esc
Printer-friendly Version
Interactive Discussion
EGU Figure 1 shows a comparison of model CO and NOAA GMD observations for 1994–
1998 (Novelli et al., 1992; 1998). Statistical information for each station is given in Table 2. The model is systematically biased low at most stations in local winter/spring when the burden is typically at an annual maximum. Transport deficiencies may play a role as the seasonal maximum in the tropics is largely due to the long-range transport
5
of pollution from biomass burning and fossil fuel source regions. The model CO gen-erally compares well to observations in local summer/fall when regional photochemical production of CO becomes more important. Another possible reason for the model’s low bias is too high OH, though this does not appear to be the case.
The mean tropospheric OH for our simulation (1994 SSTs) is 0.98×10⁶molec/cm3, 10
which is similar to that reported by Spivakovsky et al. (2000), 1.16×10⁶molec/cm3.
The CH3CCl3 lifetime with respect to tropospheric OH is 6.1 y, which is similar to that reported by Prinn et al. (2005), 6.0 (+0. 5, –0.4) y, and Spivakovsky et al. (2000), 5.7 y.
Though the lifetime is reasonable in our model, it is weighted toward the lower tropical troposphere, providing less information on the quality of model OH elsewhere. A known
15
deficiency in the GEOS-4-GCM is that the tropical cloud optical depths (COD) are too thin in the middle/upper troposphere, though the column COD are similar to those from MODIS and ISCCP; this problem results because the atmosphere of the GCM is too dry (Bloom et al., 2005). The radiative effect of clouds on global mean OH is not very
sensitive to the column COD, but it is to the cloud vertical distribution (H. Liu, personal
20
communication, 2006).
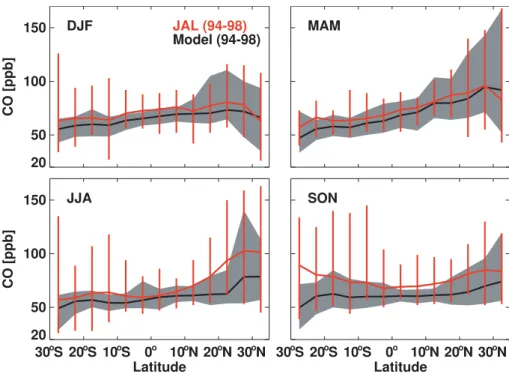
There are two long-term aircraft missions, Japan Airlines (JAL; Matsueda et al., 1998) and Measurements of OZone by Airbus In-service airCraft (MOZAIC; Nedelec et al., 2005), that measure CO in the UT. Figure 2 shows a seasonal comparison of the model and the JAL data (9–13 km) from 1994–1998 for flights from Tokyo, Japan
25
ACPD
7, 2197–2248, 2007Cross-tropopause transport of biomass
burning pollution
B. N. Duncan et al.
Title Page
Abstract Introduction
Conclusions References
Tables Figures
◭ ◮
◭ ◮
Back Close
Full Screen / Esc
Printer-friendly Version
Interactive Discussion
EGU and observations show IAV in the northern subtropics from March through May, a time
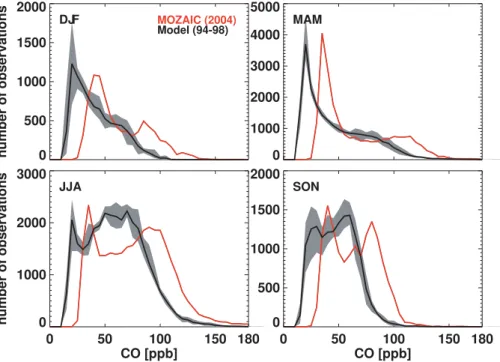
when the UT is impacted by biomass burning pollution from Southeast Asia (e.g., Ja-cob et al., 2003). In the data, there is strong IAV from September through November in the southern tropics, which is associated with the IAV of biomass burning emissions; the model does not show strong IAV as we use climatological emissions. Figure 3
5
shows a histogram comparison of the model and MOZAIC flights between Europe and East Asia. Consistent with the GMD measurements, the data show that the model CO is often biased low, though the spatial and temporal distributions are similar to the data.
4 Cross-tropopause transport pathways: 1997 Indonesian wildfires
In this section, we present a COMBO CTM simulation of the 1997 Indonesian wildfires,
10
one of the largest burning events of the 20th century, to illustrate the principal cross-tropopause pathways of biomass burning pollution. The fires began in August, peaked in September and October, and ended in November. Observations indicate that the wildfires had a profound impact on the composition of the tropical troposphere (Dun-can et al., 2003b and references therein), including the UT (Matsueda et al., 1999;
15
Matsueda and Inoue, 1999). The purposes of this experiment are 1) to identify the major TST pathways of the pollution and 2) to understand the impact of this extreme biomass burning event on the composition of the TTL/LS.
Duncan et al. (2003b) detailed the tropospheric transport pathways of the pollution. The Walker Circulation was weak and not well organized, which is typical of El Ni ˜no
20
conditions. Consequently, the prevailing flow throughout the tropical troposphere from Africa to the Indian Ocean was characterized by weak, recirculating easterlies, which allowed most of the pollution to remain over the tropical Indian Ocean through Novem-ber. Transport to the UT via deep convection mixed the pollution throughout the tro-posphere over the tropical Indian Ocean. We find similar transport pathways in the
25
simulation presented here.
ACPD
7, 2197–2248, 2007Cross-tropopause transport of biomass
burning pollution
B. N. Duncan et al.
Title Page
Abstract Introduction
Conclusions References
Tables Figures
◭ ◮
◭ ◮
Back Close
Full Screen / Esc
Printer-friendly Version
Interactive Discussion
EGU was realistic; transport in their model was driven by assimilated meteorology, which
was known to cause excessive stratosphere-troposphere exchange (STE), a common problem of assimilated fields (e.g., Douglass et al., 2003; Schoeberl et al., 2003). Here, we use GEOS-4-GCM meteorological fields (1997 SSTs), which have reasonable STE, to drive transport in the COMBO CTM. As the ENSO phenomenon is largely driven by
5
SSTs, our simulation captures the major meteorological features associated with this historic El Ni ˜no. For instance, the locations of tropical precipitation agree reasonably well with the distributions from the Global Precipitation Climatology Project (GPCP) for August through November 1997 (Adler et al., 2003). The model and observed precipitation are higher than climatology (1979–1999) over the central/eastern Pacific
10
and western Indian Oceans, and lower over the Maritime continent and eastern Indian Ocean, which are characteristics of the El Ni ˜no phase (Dai and Wigley, 2000).
In Sects. 4.1–4.2, we present the results of two model simulations, with and without the Indonesian wildfire emissions. We refer to the difference in trace gas concentrations
between the two runs as perturbations caused by the wildfires.
15
4.1 Transport pathways within the TTL and LS
The cross-tropopause transport of the wildfire’s pollution occurs by slow ascent in the TTL, especially over the Indian Ocean, and quasi-horizontal exchange in the subtropi-cal jet regions, especially the southern jet. The two TST pathways are both important in our model.
20
4.1.1 Quasi-horizontal exchange
In general, the maximum extent of the convective upward mass flux in our model is
∼200 mb. While advective flow in the tropical UT is characterized by weak, recirculating
easterlies, westerly flow in the subtropical jets (>20◦N and>20◦S) is relatively strong, especially the southern jet as it is seasonally stronger (Fig. 4). Flow throughout the
25
ACPD
7, 2197–2248, 2007Cross-tropopause transport of biomass
burning pollution
B. N. Duncan et al.
Title Page
Abstract Introduction
Conclusions References
Tables Figures
◭ ◮
◭ ◮
Back Close
Full Screen / Esc
Printer-friendly Version
Interactive Discussion
EGU Figure 5 shows the monthly-averaged CO perturbation (%) at 200 mb for August
through November. The bulk of the CO remains over the tropical Indian Ocean in all four months, where the perturbation is>100% over much of the region. In August and September, the pollution is transported by the tropical easterly jet, which weakens in October and November as the Asian monsoon circulation breaks down. The figure
5
shows that pollution is peeled away by the subtropical jets, especially the southern jet, from the main plume over the Indian Ocean in September and October, rapidly circling the globe (Figs. 5c–d).
The importance of the subtropical jets as TST pathways to the LMS is seen in Fig. 6, which shows the CO perturbation (%) in October for a vertical slice at the International
10
Date Line. The perturbation is near 100% in the southern jet and>50% in the northern jet. The CO moves into the LMS via quasi-horizontal exchange, increasing CO by 25–100%.
4.1.2 Slow ascent in the TTL
Figure 7a shows the CO perturbation in November near the tropical tropopause. The
15
greatest perturbations (>100%) are over Africa, the Indian Ocean, and the region of the southern jet. Figure 7b shows the CO perturbations in the LS. The perturbations closely resemble those at the tropopause, first appearing over subtropical Asia, trop-ical Africa and the entire southern tropics in September and October. The maximum perturbations (∼30 ppbv) occur in November over Africa and the tropical Indian Ocean, 20
a region of preferential TST (Fueglistaler et al., 2004). At 60 mb (not shown), the CO perturbation (∼5% or 1–2 ppbv) first appears over the tropical Atlantic and S. America
in October; at this altitude, the total model CO is only 10–15 ppbv. By December, the perturbation is rather well-mixed, 10–25% (1–3 ppbv) and lingers through March.
The main entry point of the Indonesian pollution to the TTL does not occur over the
25
ACPD
7, 2197–2248, 2007Cross-tropopause transport of biomass
burning pollution
B. N. Duncan et al.
Title Page
Abstract Introduction
Conclusions References
Tables Figures
◭ ◮
◭ ◮
Back Close
Full Screen / Esc
Printer-friendly Version
Interactive Discussion
EGU Ocean because of a weak Walker Circulation and remains there because of weak and
recirculating winds, as discussed above. Third, strong convection off the equatorial
Pacific coast of Central America, which is associated with the strong El Ni ˜no, pumps air not significantly impacted by the wildfires from the lower troposphere to the UT (Fig. 5).
5
4.2 Impact on trace gases in the TTL and LS
The evolution of the monthly-averaged CO perturbation (%) in the TTL, LMS, and LS is shown in Fig. 8. The TTL perturbation peaks (50–60%) in October, the height of the fire activity, and remains>20% until January. There is a time lag of a month of the peak burden (>30%) in the LMS from that of the TTL and the perturbation remains>20%
10
from October to January. The lag of the peak perturbation is two months for the LS as compared to the TTL.
An important feature in Fig. 8 is that the perturbation in the LMS is higher than in the LS, which implies that quasi-horizontal transport plays a more significant role in the TST of the pollution than slow ascent. However, we cannot quantify the significance as
15
CO is not an inert tracer. For instance, the transit time of CO through slow ascent in the TTL, where OH is high, is several weeks. On the other hand, the lifetime is longer in the southern hemisphere (SH) subtropical jet region early in the study period as OH is low, but grows through austral spring as solar radiation increases. By November, the lifetimes near the tropical tropopause and the SH LMS are similar, 50–70 days. The
20
reverse is true for the NH subtropical jet region, which explains why the NH portion, but not the SH portion, of the LMS perturbation remains high long after the fires end (Fig. 8).
The CO lifetime grows (as compared to the unperturbed case) because CO accumu-lates during the long burning event. OH is the primary sink for CO, so its zonal mean
25
ACPD
7, 2197–2248, 2007Cross-tropopause transport of biomass
burning pollution
B. N. Duncan et al.
Title Page
Abstract Introduction
Conclusions References
Tables Figures
◭ ◮
◭ ◮
Back Close
Full Screen / Esc
Printer-friendly Version
Interactive Discussion
EGU lower by >15% (Fig. 9b). While a 15% decrease in OH over several months in the
TTL is significant by itself, it becomes even more important when one considers that air in the TTL typically resides there for several weeks before crossing the tropopause (Fueglislater et al., 2004). Therefore, a trace gas that has a primary sink by reaction with OH will have a longer lifetime, allowing more of it to cross the tropopause.
5
The zonal mean ozone perturbation is shown in Fig. 9c. It is >15% in much of the TTL from September to November and>25% (>15 ppbv) in October. When only the Indian Ocean is considered (Fig. 9d), the highest perturbation (>15 ppbv) in the TTL is along the equator and the southern subtropical jet, though the perturbation is >10 ppbv over the entire TTL. In a situation of enhanced ozone, the LZH will descend
10
in altitude increasing the probability that air at this altitude will undergo TST, though this effect is not expected to be large for ozone (Gettelman et al., 2004). Nevertheless,
this experiment shows that 1) biomass burning pollution can significantly elevate ozone in the entire TTL for many months, presumably impacting the dynamics there, and 2) ozone in both the LS and LMS can be impacted by a large biomass burning event.
15
5 Sources of variation in the TTL composition
In Sect. 4, we used an extreme biomass burning event, the 1997 Indonesian wild-fires, to identify two main pathways for the pollution to enter the stratosphere: i. slow ascent in the TTL and ii. quasi-horizontal exchange in the regions of the subtropical jets. We find these two pathways are also important for more modest burning events.
20
In Sect. 5, our goal is to understand how temporal and spatial variations in pollutant sources and dynamics impact the composition of the TTL and LMS. We examine the seasonal transport of biomass burning pollution to the UT/LS for a typical year, mid-1994 to mid-1995, to understand how usual variations in the timing and locations of burning contribute to CO perturbations in the TTL and LMS. We also investigate how
25
ACPD
7, 2197–2248, 2007Cross-tropopause transport of biomass
burning pollution
B. N. Duncan et al.
Title Page
Abstract Introduction
Conclusions References
Tables Figures
◭ ◮
◭ ◮
Back Close
Full Screen / Esc
Printer-friendly Version
Interactive Discussion
EGU 5.1 TST of regional biomass burning pollution
We performed five simulations. The base simulation is a standard simulation from mid-1994 to mid-1995 with climatological biomass burning sources. In the remaining simulations, we turned offsequentially the biomass burning emissions from four source
regions: Africa south of the equator (86 Tg CO/y), Africa north of the equator (87 Tg
5
CO/y), South America south of the equator (60 Tg CO/y), and Southeast Asia (82 Tg CO/y), not including Malaysia and Indonesia. Figure 10 shows the seasonal variation of biomass burning by region from 30◦S–30◦N.
5.1.1 Southern hemisphere burning season
South America, southern Africa, and the tropical southern Atlantic Ocean experience
10
widespread pollution during the SH burning season (Fishman et al., 1991; Thompson et al., 1996; Chatfield et al., 1998). Burning occurs in southern Africa typically from May to November and from August to November in South America (Fig. 10). The transport pathways from the two regions allow their plumes to inter-mingle. They can be treated as one plume for the purpose of this experiment.
15
The large biomass burning plume lies generally south of tropical easterlies and north of SH subtropical westerlies. Figure 11a shows that tropical easterlies play the dom-inant role, transporting much of the pollution to the Pacific Ocean. A broad area of convection extends from western Africa, across South America, and to the central Pa-cific, which lofts the pollution to the UT (Figs. 11b–c). By October, this pollution is
20
being transported by the southern subtropical jet (Fig. 11c). Figure 11a also shows that subtropical westerlies transport surface pollution to the Indian Ocean; this pollu-tion typically is not lofted to the UT as convecpollu-tion in the subtropics is not frequent.
Unlike the Indonesian pollution, ascent over the Warm Pool plays a role for pollution from South America and southern Africa. The pollution is first evident at the tropical
25
ACPD
7, 2197–2248, 2007Cross-tropopause transport of biomass
burning pollution
B. N. Duncan et al.
Title Page
Abstract Introduction
Conclusions References
Tables Figures
◭ ◮
◭ ◮
Back Close
Full Screen / Esc
Printer-friendly Version
Interactive Discussion
EGU The pollution reaches the LS in August and September along the equator from the
central Pacific westward to Africa, though the perturbation is only 1–5% (not shown). It is widespread (>10%) in November and December, and >15% over central Africa in November. It reaches 60 mb by December, though it is generally∼1–3% with the
highest perturbation over the equatorial Pacific.
5
5.1.2 Northern hemisphere burning season
Northern Africa. The burning season in northern Africa occurs mainly from November
through March (Fig. 10). Much of the pollution near the surface moves with the tropical easterlies, polluting the entire tropical Atlantic and Pacific Oceans by February and March (not shown). A minor pathway to the western tropical Indian Ocean occurs
10
during most of the burning season.
The Brewer-Dobson circulation is typically strongest in the NH winter when biomass burning peaks in northern Africa, and the northern subtropical jet is characterized by a strong potential vorticity gradient, creating a barrier to mixing (Chen, 1995). Therefore, one may expect that TST via slow ascent in the TTL would occur preferentially to
15
exchange in the region of the northern subtropical jet. However, this is not the case as seasonal convection in central Africa provides the main transport pathway to the UT, especially in February and March when the ITCZ advances northward/closer to the burning regions. Consequently, the perturbation in the UT peaks in March and April (Fig. 12a), well into spring and several months after the peak in burning.
20
The perturbation near the tropical tropopause peaks from March to May (Fig. 12b), where it is>5% over the entire tropical tropopause region. However, it is first evident in January, when the highest values are 3–5% over Indonesia, the tropical Pacific, and South America. In the LS, the pollution first appears in January over the Warm Pool, and in February, it is>5% over two regions of deep convection, the Warm Pool and off
25
the Pacific coast of Central America. It remains high (5–10%) from March through May over the entire tropics.
ACPD
7, 2197–2248, 2007Cross-tropopause transport of biomass
burning pollution
B. N. Duncan et al.
Title Page
Abstract Introduction
Conclusions References
Tables Figures
◭ ◮
◭ ◮
Back Close
Full Screen / Esc
Printer-friendly Version
Interactive Discussion
EGU African regions and South America, approximately 50% of the biomass burned in
Southeast Asia occurs in March (Fig. 10). Pollution is transported by the prevailing surface winds to the Indian and Pacific Oceans, where it is lofted to the UT by convec-tion over the Bay of Bengal and the South China Sea. Figure 13a shows that the CO perturbation at 200 mb is>25% over the Bay of Bengal and Southeast Asia in March.
5
This pollution is transported rapidly by the northern subtropical jet across the Pacific Ocean, circumnavigating the globe by April; the perturbation is 5–10% over much of the NH tropical and subtropical Indian and Pacific Oceans. A minor amount of the pol-lution is caught in the southern subtropical jet (Fig. 13a). The polpol-lution first appears near the tropopause over the Warm Pool in February (∼1%) and over large regions of 10
the tropics by March and April (Fig. 13b). The pollution is high in April (>25%) over the Arabian Sea to the South China Sea and is>10% over most of the NH tropics and subtropics.
5.2 Contribution of sources
In Sect. 5.1, we showed the transport pathways of pollution from South America,
south-15
ern Africa, northern Africa, and Southeast Asia to/within the UT/LS; these four regions account for 80% of the total biomass burning emissions (395 Tg CO/y) from 30◦S– 30◦N. In our model, the mean CO in the tropical TTL (12◦N–12◦S) ranges between 44 and 58 ppbv for the 1994/95 burning season. Figure 14 shows the model’s total CO (with the annual mean removed) and the CO perturbations in the TTL from the four
20
source regions. Less than 20% of the total CO in the TTL is due to biomass burning. The perturbation from NH burning in boreal spring contributes more to the total CO in the TTL than SH burning in austral spring. The perturbation from northern Africa is higher than Southeast Asia, even though the emissions from both regions are similar. On the other hand, the CO perturbation from South America is higher, though
emis-25
sions are∼30% lower, than from southern Africa; this occurs because convection is
vari-ACPD
7, 2197–2248, 2007Cross-tropopause transport of biomass
burning pollution
B. N. Duncan et al.
Title Page
Abstract Introduction
Conclusions References
Tables Figures
◭ ◮
◭ ◮
Back Close
Full Screen / Esc
Printer-friendly Version
Interactive Discussion
EGU ability in total CO in the TTL. That is, seasonal biomass burning drives the CO tape
recorder, but other sources also contribute.
If biomass burning were the only source of seasonal variation, one would expect two maxima (during the NH and SH burning seasons) and two minima (the periods between them) in the mean CO each year in the TTL. This is not the case (Fig. 14).
5
CO remains high during boreal winter, but not during austral winter. Figure 15 is the same as Fig. 14, except for the tropical LS (above 380 K and>60 mb; 12◦N–12◦S). Not surprisingly, the mean concentrations (16–25 ppbv) are lower than in the TTL and they peak 1–2 months later because of the transit time via slow ascent. The peak in total CO from SH burning in austral spring, as evident in the TTL (Fig. 14), is muted in the
10
LS. These features are also seen in the observed tape recorder (Fig. 1 of Schoeberl et al., 2006).
Why does CO in the TTL remain high during boreal winter? First, the long-range transport of CO from fossil fuels and biofuels emitted in the NH extra-tropics and sub-tropics increases the background concentration of the northern sub-tropics by ∼20% in 15
boreal winter/early spring (Duncan et al., 2007). (The time-scale of meridional trans-port is relatively long compared to the CO lifetime, except in winter when OH is low.) As this long-range transport occurs during the NH burning season, CO in the northern tropics reaches a seasonal maximum. Other CO sources (e.g., local fossil fuel and biofuel emissions, methane and NMHC oxidation) make much smaller or insignificant
20
contributions to the seasonal variation of tropical CO (Duncan et al., 2007). Second, more CO crosses the tropopause in boreal winter as the ascent rate is higher than in boreal summer (Rosenlof, 1995); that is, a tape recorder would exist without seasonal changes in tropospheric CO sources.
The minimum in the CO tape recorder occurs in boreal summer in the TTL and late
25
year-ACPD
7, 2197–2248, 2007Cross-tropopause transport of biomass
burning pollution
B. N. Duncan et al.
Title Page
Abstract Introduction
Conclusions References
Tables Figures
◭ ◮
◭ ◮
Back Close
Full Screen / Esc
Printer-friendly Version
Interactive Discussion
EGU round in the tropics. MOPITT observations showed elevated CO in summer in the UT
above India and China (Kar et al., 2004). At ∼150 mb, elevated CO was observed
in the MLS data over the Tibetan Plateau (Li et al., 2005). Consequently, one might expect Indian emissions during the monsoon to contribute significantly to the CO tape recorder. However, CO from India largely remains at latitudes>15◦N, north of the TTL
5
(12◦N–12◦S), as indicated by these observations. We find a similar result in a model simulation, in which we removed Indian emissions.
Pollution transported to the LMS does not contribute to the tape recorder. Figure 16 is the same as Fig. 14, except for the LMS of each hemisphere. The mean CO in the NH LMS ranges from 31–38 ppbv and from 21–25 ppbv in the SH LMS. As in the TTL
10
and LS, most, but not all, of the variation is due to seasonal burning. CO from burning in each region pollutes the LMS of both hemispheres, but more so in the hemisphere in which burning occurs.
5.3 Interannual variability
In Sect. 4, we discussed the extreme burning event in Indonesia in 1997. The effects
15
of El Ni ˜no are strongest typically during the SH burning season. Though, the ENSO-induced variability of precipitation is relatively weak year-round in southern Africa and South America. Consequently, the ENSO is not likely to be an important player in the IAV of biomass burning for these two regions. A similar argument can be made for burning in northern Africa and Southeast Asia, not including Indonesia. (The ENSO
20
can impact the transport of pollution from these regions to the UT/LS (e.g., via locations and depths of convection) as discussed below.) In Sects. 5.1 and 5.2, we did not include simulations of biomass burning from Indonesia and Central America/Mexico as burning in these regions vary dramatically from year-to-year due to variations in ENSO. For instance, burning in Indonesia and Central America/Mexico during a La
25
Ni ˜na is often 3–5 times less than during an El Ni ˜no (Duncan et al., 2003a); that is, historically only burning during an El Ni ˜no phase is of consequence.
ACPD
7, 2197–2248, 2007Cross-tropopause transport of biomass
burning pollution
B. N. Duncan et al.
Title Page
Abstract Introduction
Conclusions References
Tables Figures
◭ ◮
◭ ◮
Back Close
Full Screen / Esc
Printer-friendly Version
Interactive Discussion
EGU for five years, 1994–1998. Our simulations capture the IAV in meteorology associated
with the phases of ENSO because the GCM was forced with observed SSTs. We use climatological biomass burning emissions for all five years.
Figure 17 shows the mean CO in the TTL for 1994–1998 with the 5-yr mean removed. The figure also shows the Oceanic Ni ˜no Index (ONI; degrees), where values >0.5◦C
5
indicate El Ni ˜no conditions and <–0.5◦C indicate La Ni ˜na conditions. The El Ni ˜no phase occurred from April 1994 through March 1995 (i.e., the 1994/95 burning season), though from April through September the phase was relatively weak, and from May 1997 through April 1998 (i.e., the 1997/1998 burning season); this was one of the strongest El Ni ˜no events on record. The La Ni ˜na phase occurred from October 1995
10
through March 1996 (i.e., the 1995/96 burning season), though the entire phase was relatively weak. The other months, including the 1996/1997 burning season, were in the neutral phase (0.5◦C>ONI>–0.5◦C).
Clearly, the dynamics of the abnormally strong El Ni ˜no of 1997/1998 enhance trans-port to the TTL (Fig. 17). The CO perturbation in late 1997/early 1998 is the highest
15
of the five years; this is the case in the LS as well (not shown). Figure 17 shows that the convective updraft flux in the model from 12◦S–12◦N is higher during the 1997/98 burning season as compared to the other years, which lofts more CO to the UT. Fa-vorable dynamics, coupled with high emissions as discussed in Sect. 4, conspire to enhance the stratospheric impact of pollution from the catastrophic 1997/1998 burning
20
season.
Minus the unusual El Ni ˜no of 1997/1998, there is significant IAV between the years in total CO. For instance, the minimum CO occurs in July and August in 1995, 1996, and 1998, during neutral or La Ni ˜na conditions; the two years with the highest minimums occur in 1994 and 1997 during El Ni ˜no events. In the SH burning season, the highest
25
ACPD
7, 2197–2248, 2007Cross-tropopause transport of biomass
burning pollution
B. N. Duncan et al.
Title Page
Abstract Introduction
Conclusions References
Tables Figures
◭ ◮
◭ ◮
Back Close
Full Screen / Esc
Printer-friendly Version
Interactive Discussion
EGU 1996.
6 Conclusions
The CO tape recorder in the MLS data showed that biomass burning pollution is ported regularly to the LS. In this study, we investigated the cross-tropopause trans-port of the pollution and assessed the impact on the composition and chemistry of the
5
UT/LS. Strahan et al. (2007) used a variety of satellite and aircraft-derived transport diagnostics to show that the GMI COMBO CTM reproduces observations reasonably well in the UT/LS, which lends confidence in its use as a tool to study the TST of pollution.
We found that the two pathways of TST, slow ascent in the TTL and quasi-horizontal
10
exchange in the region of the subtropical jets, are of similar importance. However, the latter pathway delivers the pollution to the LMS, where it most likely returns to the troposphere (Schoeberl et al., 2004); most tropical biomass burning occurs in local spring, a season of strong stratosphere-to-troposphere transport in the extra-tropics, associated with the Brewer-Dobson circulation. In general, the relative importance of
15
the two TST pathways depends on the lifetime of a trace gas, which is typically longer in the region of the subtropical jets than the TTL where solar radiation and OH are consistently higher.
We performed a simulation of one of the largest burning events of the 20th century, the 1997 Indonesian wildfires, to provide an upper bound on the impact of biomass
20
burning on the UT/LS. The fires occurred during the SH burning season, so that the total emissions were about twice that of the Indonesian fires alone. For perspective, the burning emissions of CO equaled almost 70% of annual, global fossil fuel emissions.
The main entry point of the Indonesian pollution to the UT/LS occurred over the Indian Ocean and Africa, and not the Warm Pool, because of a weak Walker Circulation
25
ACPD
7, 2197–2248, 2007Cross-tropopause transport of biomass
burning pollution
B. N. Duncan et al.
Title Page
Abstract Introduction
Conclusions References
Tables Figures
◭ ◮
◭ ◮
Back Close
Full Screen / Esc
Printer-friendly Version
Interactive Discussion
EGU jets which transported the pollution north and south of the Warm Pool. The Walker
Circulation is historically weak during El Ni ˜nos, so it is possible that pollution from widespread wildfires in Indonesia (e.g., 1982–1983, 1991, 1994, 1997–1998) followed similar transport pathways as in 1997.
During this burning event, both ozone and CO associated with the fires contributed
5
to their burdens in the UT/LS, which lasted well after the fires ended. For instance, ozone was 5–20% higher on average in the TTL and>100% over parts of the Indian Ocean for several months. The increased CO lengthened the lifetimes of trace gases, including itself, as reaction with CO is the primary sink for OH, which was 5–20% lower in most of the TTL. The lower OH allowed higher amounts of trace gases to cross the
10
tropopause for several months.
In addition to the Indonesian fires, we assessed the transport pathways and impact of pollution of more typical burning from four regions: southern Africa, northern Africa, Southeast Asia, and South America. With these experiments, we showed that pollution is transported regularly to the TTL/LS, impacting the composition of trace gases there.
15
In general, the peaks in burning in South America and southern Africa occur at the same time in austral spring. We found that much of the pollution from South America and southern Africa mixes and follows similar transport pathways in the UT/LS, enter-ing the LS via slow ascent over the Warm Pool and Africa, both regions of preferential TST. As with the Indonesian pollution, quasi-horizontal exchange in the region of the
20
subtropical jets is important. For the NH season, peak burning in northern Africa and Southeast Asia (i.e., Indochina) are offset by several months. Nevertheless, the
trans-port pathways to the UT/LS are similar for these two regions as for southern Africa and South America. These four regions contribute equally to the seasonal variation in the TTL.
25
ACPD
7, 2197–2248, 2007Cross-tropopause transport of biomass
burning pollution
B. N. Duncan et al.
Title Page
Abstract Introduction
Conclusions References
Tables Figures
◭ ◮
◭ ◮
Back Close
Full Screen / Esc
Printer-friendly Version
Interactive Discussion
EGU than in austral winter (between the NH and SH burning seasons). In the LS, there is
only one minimum in CO in the latter half of the year and one maximum in the beginning of the year. That is, the minimum between the SH and NH burning seasons disappears as slow ascent in the TTL is seasonally faster in boreal winter than summer (Rosenlof, 1995).
5
We conclude that there are two main sources of interannual variation in CO in the TTL/LS for our study period, 1994–1998. First, year-to-year changes in the locations, frequencies, and depths of deep convection loft varying amounts of biomass burning CO to the UT. The highest concentrations in the TTL occurred during the 1997/98 El Ni ˜no event because of stronger convective transport to the UT during this time.
Sec-10
ond, year-to-year changes in biomass burning are substantial, especially high during El Ni ˜no years when large wildfires typically occur in Indonesia and Central America.
We could not assess the impact of the changes in atmospheric composition (e.g., ozone, water vapor) on the dynamics of the TTL/LS as we used a CTM. For example, what were the impacts of the fire’s aerosols on clouds and, subsequently, on radiation
15
in the LS? Another potentially important impact is that the sizable amount of aerosols emitted by the Indonesian wildfires (Duncan et al., 2003b) could have decreased the average size of ice crystals, allowing more water vapor to enter the stratosphere (Sher-wood, 2002). Therefore, as future work, we plan to conduct sensitivity studies with a general circulation model to understand the impact of biomass burning pollution on
20
ascent in the TTL.
Acknowledgements. We would like to thank J. Rodriguez and the GMI core modeling team for their efforts which have facilitated our research. We wish to thank E. Nielsen of NASA GMAO for providing us with meteorological fields. We thank A. Douglass and M. Schoeberl for their scientific insight and advice. We gratefully acknowledge those who provided us with their 25
ACPD
7, 2197–2248, 2007Cross-tropopause transport of biomass
burning pollution
B. N. Duncan et al.
Title Page
Abstract Introduction
Conclusions References
Tables Figures
◭ ◮
◭ ◮
Back Close
Full Screen / Esc
Printer-friendly Version
Interactive Discussion
EGU
contribution to the GEWEX Global Precipitation Climatology Project. This research was sup-ported by NASA Grant MAP/04-0068-0040.
References
Adler, R. F., Huffman, G. J. Chang, A., Ferraro, R., Xie, P., Janowiak, J., Rudolf, B., Schneider, U., Curtis, S., Bolvin, D., Gruber, A., Susskind, J., and Arkin, P.: The Version 2 Global 5
Precipitation Climatology Project (GPCP) Monthly Precipitation Analysis (1979–Present), J. Hydrometeorol., 4(6), 1147–1167, 2003.
Andreae, M. and Merlet, P.: Emission of trace gases and aerosols from biomass burning, Global Biogeochemical Cycles, 15, 955–966, 2001.
Baughcum, S. L., Tritz, T. G., Hernerdon, S. C., and Pickett, D. C.: Scheduled civil aircraft 10
emission inventories for 1992: database development and analysis, NASA CR-4700, Natl. Aeronaut and Space Admin., Washington, D.C., 1996.
Benkovitz, C. M., Scholtz, M. T., Pacyna, J., Tarrason, L., Dignon, J., Voldner, E. C., Spiro, P. A., Logan, J. A., and Graedel, T. E.: Global gridded inventories of anthropogenic emissions of sulfur and nitrogen, J. Geophys. Res., 101, 29 239–29 253, 1996.
15
Bey, I., Jacob, D. J., Yantosca, R. M., Logan, J. A., Field, B. D., Fiore, A. M., Li, Q., Liu, H., Mickley, L. J., and Schultz, M.: Global modeling of tropospheric chemistry with assimi-lated meteorology: Model description and evaluation, J. Geophys. Res., 106, 23 073–23 095, 2001.
Bian, H. and Prather, M. J.: Fast-J2: Accurate Simulation of stratospheric photolysis in global 20
chemical models, J. Atmos. Chem., 41, 281–296, 2002.
Bloom, S., da Silva, A., Dee, D., Bosilovich, M., Chern, J.-D., Pawson, S., Schubert, S., Sienkiewicz, M., Stajner, I., Tan, W.-W., and Wu, M.-L.: Documentation and validation of the Goddard Earth Observing System (GEOS) Data Assimilation System – Version 4, Tech-nical Report Series on Global Modeling and Data Assimilation 104606, 2005.
25
Chatfield, R. B., Vastano, J. A., Li, L., Sachse, G. W., and Connors, V. S., The Great African plume from biomass burning: Generalizations from a three-dimensional study of TRACE A carbon monoxide, J. Geophys. Res. 103, 28 059–28 077, 1998.
ACPD
7, 2197–2248, 2007Cross-tropopause transport of biomass
burning pollution
B. N. Duncan et al.
Title Page
Abstract Introduction
Conclusions References
Tables Figures
◭ ◮
◭ ◮
Back Close
Full Screen / Esc
Printer-friendly Version
Interactive Discussion
EGU
Global Atmospheric Sampling Program (GASP): How tropical emissions affect the remote Pacific, J. Geophys. Res., 107, 4278, doi:10.1029/2001JD000497, 2002.
Chin, M., Ginoux, P., Kinne, S., Torres, O., Holben, B., Duncan, B., Martin, R., Logan, J., Higurashi, A., and Nakajima. T.: Tropospheric aerosol optical thickness from the GOCART model and comparisons with satellite and sunphotometer measurements, J. Atmos. Sci., 59, 5
461–483, 2002.
Considine, D. B., Douglass, A. R., Connell, P. S., Kinnison, D. E., and Rotman, D. A.: A polar stratospheric cloud parameterization for the three-dimensional model of the global modeling initiative and its response to stratospheric aircraft, J. Geophys. Res., 105, 3955–3975, 2000. Dai, A. and Wigley, T. M. L.: Global patterns of ENSO-induced precipitation, Geophys. Res. 10
Lett., 27, 1283–1286, 2000.
de Laat, A. T. J., Aben, I., and Roelofs, G. J.: A model perspective on total tropospheric O3
column variability and implications for satellite observations, J. Geophys. Res., 110, D13303, doi:10.1029/2004JD005264, 2005.
Dessler, A. E.: A reexamination of the “stratospheric fountain” hypothesis, Geophys. Res. Lett., 15
25, 4165–4168, 1998.
Dethof, A., O’Neill, A., Slingo, J. M., and Smit H. G. J.: A mechanism for moistening the lower stratosphere involving the Asian summer monsoon, Q. J. R. Meteorol. Soc., 125, 1079–1106, Part B., 1999.
Douglass, A. R., Schoeberl, M. R., Rood, R. B., and Pawson, S.: Evaluation of transport in 20
the lower tropical stratosphere in a global chemistry and transport model, J. Geophys. Res., 108(D9), 4259, doi:10.1029/2002JD002696, 2003.
Douglass, A. R., Stolarski, R. S., Strahan, S. E., and Connell, P. S.: Radicals and reservoirs in the GMI chemistry and transport model: Comparison to measurements, J. Geophys. Res., D16302, doi:10.1029/2004JD004632, 2004.
25
Dlugokencky , E. J., Masarie, K. A., Lang, P. M., and Tans, P. P.: Continuing decline in the growth rate of the atmospheric methane burden, Nature, 393, 447–450, 1998.
Duncan, B. N., Martin, R., Staudt, A., Yevich, R., and Logan, J.: Interannual and Seasonal Variability of Biomass Burning Emissions Constrained by Satellite Observations, J. Geophys. Res., 108, 4100, doi:10.1029/2002JD002378, 2003a.
30
ACPD
7, 2197–2248, 2007Cross-tropopause transport of biomass
burning pollution
B. N. Duncan et al.
Title Page
Abstract Introduction
Conclusions References
Tables Figures
◭ ◮
◭ ◮
Back Close
Full Screen / Esc
Printer-friendly Version
Interactive Discussion
EGU
Dunlea, E. J. and Ravishankara, A. R.: Kinetic studies of the reactions of O(1D) with several atmospheric molecules, Phys. Chem. Chem. Phys., 6, doi:10.1039/b400247d, 2004.
Evans, M. J, and Jacob, D. J.: Impact of new laboratory studies of N2O5 hydrolysis on global
model budgets of tropospheric nitrogen oxides, ozone, and OH, Geophys. Res. Lett., 32, L09813, doi:10.1029/2005GL022469, 2005.
5
Fishman, J., Fakruzzaman, F., Cros, B., and Nganga, D.: Identification of widespread pollution in the Southern Hemisphere deduced from satellite analyses, Science, 252, 1693–1696, 1991.
Folkins, I., Chatfield, R., Baumgardner, D., and Proffitt, M.: Biomass burning and deep con-vection in southeastern Asia: Results from ASHOE/MAESA, J. Geophys. Res., 102, 13 291– 10
13 299, 1997.
Folkins, I., Loewenstein, M., Podolske, J., Oltmans, S. J., and Proffitt, M.: A barrier to vertical mixing at 14 km in the tropics: Evidence from ozonesondes and aircraft measurements, J. Geophys. Res., 104, 22 095–22 102, 1999.
Folkins, I., Bernath, P., Boone, C., Lesins, G., Livesay, N., Thompson, A. M., Walker, K., 15
and Witte, J. C.: The seasonal cycles of O3, CO, and convective outflow at the tropical
tropopause, Geophys. Res. Lett., 33, L16802, doi:10.1029/2006GL026602, 2006.
Fromm, M., Bevilacqua, R., Servranckx, R., Rosen, J., Thayer, J., Herman, J., and Larko, D.: Pyro-cumulonimbus injection of smoke to the stratosphere: Observations and impact of a super blowup in northwestern Canada on 3–4 August 1998, J. Geophys. Res., 110, D08205, 20
doi:10.1029/2004JD005350, 2005.
Fueglistaler, S., Wernli, H., and Peter, T.: Tropical troposphere-to-stratosphere transport inferred from trajectory calculations, J. Geophys. Res., 109, D03108, doi:10.1029/2003JD004069, 2004.
Fueglistaler, S. and Fu, Q.: Impact of clouds on radiative heating rates in the tropical lower 25
stratosphere, J. Geophys. Res., 111, D23202, doi:10.1029/2006JD007273, 2006.
Fu, R., Y. Hu, Wright, J. S., Jiang, J. H., Dickinson, R. E., Chen, M., Filipiak, M., Read, W. G., Waters, J. W., and Wu, D. L.: Short-circuit of water vapor and polluted air to the global stratosphere by convective transport over the Tibetan Plateau, PNAS, doi:10.1073/pnas.0601584103, 2006.
30
ACPD
7, 2197–2248, 2007Cross-tropopause transport of biomass
burning pollution
B. N. Duncan et al.
Title Page
Abstract Introduction
Conclusions References
Tables Figures
◭ ◮
◭ ◮
Back Close
Full Screen / Esc
Printer-friendly Version
Interactive Discussion
EGU
Gettelman, A., de F. Forster, P. M., Fujiwara, M., Fu, Q., V ¨omel, H., Gohar, L. K., Johanson, C., and Ammerman, M.: Radiation balance of the tropical tropopause layer, J. Geophys. Res., 109, D07103, doi:10.1029/2003JD004190, 2004.
Guenther, A., Hewitt, C. N., Erickson, D., et al.: A global model of natural volatile organic compound emissions, J. Geophys. Res., 100, 8873–8892, 1995.
5
Hack, J. J.: Parameterization of moist convection in the NCAR Community Climate Model, CCM2, J. Geophys. Res., 99, 5551–5568, 1994.
Holton, J. R., Haynes, P. H., McIntyre, M. E., Douglass, A. R., Rood, R. B., and Pfister, L.: Stratosphere-Troposphere Exchange, Rev. Geophys., 33, 403–439, 1995.
Jacobson, M. Z.: Computation of global photochemistry with SMVGEAR II, Atmos. Environ., 10
29, 2541–2546, 1995.
Jacob, D. and Bakwin, P.: Cycling of NOx in tropical forest canopies and its implications for
the global source of biogenic NOxto the atmosphere, in Microbial Production and
Consump-tion of Greenhouse Gases, edited by: Whitman, W. B., American Society of Microbiology, Washingoton, D.C., 1991.
15
Jacob, D. J., Field, B. D., Jin, E., Bey, I., Li, Q. B., Logan, J. A., and Yantosca, R. M.: Atmo-spheric budget of acetone, J. Geophys. Res., 107, 4100, doi:10.1029/2001JD000694, 2002. Jacob, D. J., Crawford, J. H., Kleb, M. M., et al.: Transport and chemical evolution over the
Pacific (TRACE-P) aircraft mission: Design, execution, and first results, J. Geophys. Res., 108, 9000, doi:10.1029/2002JD003276, 2003.
20
Kar, J., Bremer, H., Drummond, J. R., et al.: Evidence of vertical transport of carbon monoxide from Measurements of Pollution in the Troposphere (MOPITT), Geophys. Res. Lett., L23105, doi:10.1029/2004GL021128, 2004.
Kar, J., Drummond, J. R., Jones, D. B. A., Liu, J., Nichitiu, F., Zou, J., Gille, J. C., Edwards, D. P., and Deeter, M. N.: Carbon monoxide (CO) maximum over the Zagros mountains 25
in the Middle East: Signature of mountain venting?, Geophys. Res. Lett., 33, L15819, doi:10.1029/2006GL026231, 2006.
Kinnison, D. E., Connell, P. S., Rodriguez, J. M., Rotman, D. A., Considine, D. B., Tannahil, J., Ramaroson, R., Rasch, P. J., Douglass, A. R., Baughcum, S. L., Coy, L., Waugh, D. W., Kawa, S. R., and Prather, M. J.: The Global Modeling Initiative Assessment Model: 30
Application to High-Speed Civil Transport Perturbation, J. Geophys. Res., 106, 1693–1712, 2001.
ACPD
7, 2197–2248, 2007Cross-tropopause transport of biomass
burning pollution
B. N. Duncan et al.
Title Page
Abstract Introduction
Conclusions References
Tables Figures
◭ ◮
◭ ◮
Back Close
Full Screen / Esc
Printer-friendly Version
Interactive Discussion
EGU
V.: Observations of near-zero ozone concentrations over the convective Pacific: Effects on air chemistry, Science, 274, 230–232, 1996.
Li, Q., Jiang, J. H., Wu, D. L., et al: Convective outflow of South Asian pollution: A global CTM simulation compared with EOS MLS observations, Geophys. Res. Lett., L14826, doi:10.1029/2005GL022762, 2005.
5
Lin, S.-J. and Rood, R. B.: Multidimensional flux-form semiLagrangian transport schemes, Mon. Weather Rev., 124, 2046–2070, 1996.
Liu, H., Jacob, D. J., Bey, I., and Yantosca, R. M.: Constraints from210Pb and 7Be on wet deposition and transport in a global three-dimensional chemical tracer model driven by as-similated meteorological fields, J. Geophys. Res., 106, 12 109–12 128, 2001.
10
Liu, C. and Zipser, E. J.: Global distribution of convection penetrating the tropical tropopause, J. Geophys. Res., 110, doi:10.10292005JD006063, 2005.
Livesey, N. J., Fromm, M. D., Waters, J. W., Manney, G. L., Santee, M. L., and Read, W. G.: Enhancements in lower stratospheric CH3CN observed by the Upper Atmosphere
Re-search Satellite Microwave Limb Sounder following boreal forest fires, J. Geophys. Res., 109, 15
D06308, doi:10.1029/2003JD004055, 2004.
Metwally, M.: Jet aircraft engine emissions database development: 1992 military, charter and nonscheduled traffic, NASA CR-4684, Natl. Aeronaut. and Space Admin., Washington, D.C., 1995.
Martin, R. V., Jacob, D. J., Yantosca, R. M., et al.: Global and regional decreases in tropo-20
spheric oxidants from photochemical effects of aerosols, J. Geophys. Res., 108(D3), 4097, doi:10.1029/2002JD002622, 2003.
Matsueda, H., Inoue, H. Y., Sawa, Y.,Tsutsumi, Y., and Ishii, M.: Carbon monoxide in the upper troposphere over the western Pacific between 1993 and 1996 J. Geophys. Res., 103, 19 093–19 110, 1998.
25
Matsueda, H. and Inoue, H. Y.: Aircraft measurements of trace gases between Japan and Singapore in October of 1993, 1996, and 1997, Geophys. Res. Lett., 26, 2413–2416, 1999. Matsueda, H., Inoue, H. Y., Ishii, M., and Tsutsumi, Y.: Large injection of carbon monoxide
into the upper troposphere due to intense biomass burning in 1997, J. Geophys. Res., 104, 26 867–26 879, 1999.
30