OPERATIONAL ANALYSIS OF MECHANICAL CUT-TO-LENGTH FOREST
HARVESTING SYSTEM
1Nilton Cesar Fiedler2*, Flávio Cipriano de Assis do Carmo3, Luciano José Minette4 and Amaury Paulo de Souza5
1 Received on 10.02.2015 accepted for publication on 09.11.2016.
2Universidade Federal do Espírito Santo,CCAE, Departamento de Ciências Florestais da Madeira. E-mail:<fiedler@pq.cnpq.br>. 3Universidade Federal do Espírito Santo, Programa de Pós-graduação em Ciência Florestais - Brasil. E-mail:
<flaviocipriano@hotmail.com>.
4Universidade Federal de Viçosa, Departamento de Engenharia de Produção e Mecânica. E-mail:<minette@ufv.br>. 5Universidade Federal de Viçosa, Departamento de Engenharia Florestal. E-mail:<amaury@ufv.br>.
*Corresponding author.
ABSTRACT –The objective of this research was to conduct an operational analysis of forest harvesting activities in a mechanized of the system cut to length in eucalypt plantations in south of Bahia, to determine the distribution of operation times, productivity, operational efficiency and mechanical availability of two models of harvester
and two models of forwarder, evaluating these machines in three modules harvesting methodology through time and motion studies. Auxiliary activities corresponded to the lowest percentages within the operating times (mean 1.9% to 1.8% for harvester and forwarder), already operating activities were those that had the highest percentages. The first shift was presented the worst results of operations for the harvester (average 66.3%) and the third shift for the forwarder (55.5%). For the harvester module 1 showed the best result of productive times (average 70.36%). In relation to the forwarder, this same module showed the worst results with unproductive times (average of 22.17%). The availability and mechanical parameters were superior productivity for the forwarder (mean 82.31% and 51.33 m3/h, respectively), as indicators of degree of utilization and
operational efficiency were higher in harvester (average 85.01% and 66.41%, respectively). Thus, for the
forwarder, the parameters mechanical availability and productivity were higher, while for the harvester, they were the indicators of degree of utilization and operational efficiency
Keywords: Forest optimization, Analysis of income, Forest Planning.
ANÁLISE OPERACIONAL DA COLHEITA FLORESTAL EM SISTEMA
MECANIZADO DE TORAS CURTAS
RESUMO – Objetivou-se com esta pesquisa realizar uma análise operacional das atividades de colheita florestal em um sistema mecanizado de toras curtas em plantios de eucalipto no sul da Bahia. Foram determinadas a distribuição dos tempos operacionais, produtividade, eficiência operacional e disponibilidade mecânica de dois modelos de colhedor florestal (harvester) e dois modelos de trator florestal autocarregável (forwarder),
respectivamente). Dessa forma, conclui-se que que para oforwarder, os parâmetros disponibilidade mecânica e produtividade foram superiores, enquanto que para o harvester, foram os indicadores de grau de utilização e eficiência operacional.
Palavras-chave: Otimização Florestal, Análise de rendimento, Planejamento Florestal.
1.INTRODUCTION
The growing demand for wood in the world, along with favorable aspects contribute to the role of Brazil in the world scenario, which gives the country more power to influence decisions related to this sector (Silva, 2011). The Brazilian Forestry Sector has gained more recognition due to the contribution to the country economy, social and environmental development. According to Schuchovski (2003), the planted forest, especially from the genus Eucalyptus
is a vital source of feedstock to many industrial segments in the productivity chain, like cellulose, paper, steelworks, energy, panels, furniture and solid wood. Moreover, that has a big contribution to the job and income creation to the country.
Thus, with the wood consumption increasing tendency, the importance to have a more efficient wood supply system, also increases, which requires harvesting alternatives that could lead to technical, economic and environmental sustainability. The forestry harvest is an activity that comprehends tree falling, processing, and wood extraction until the edges of the road. On this activity, the use of a forestry tractor with a high versatility and operational capacity and that could operate in three work shifts, completing 24h per day, those machines can be kept in the field the whole year with a high mechanical disponibility and productivity (Machado et al., 2008). Besides, it can increase the control on the harvest cost allowing better results in short deadlines (Leonello et al., 2012).
With this innovation and modification process to attend the globalized market, companies with a high wood demand and with capital available started to use highly mechanized systems and work methods (Santoset al., 2013). According to Machado and Lopes (2000), the harvest cost and the forestry transport represents more than half of the final cost of the timber put at the place of use. For this reason, it is necessary to have the knowledge about the operational cost of the machines involved in the company productivity process to make decisions, that will help, the control, planning and a reduction of operational cost at the wood harvest
(Machado and Malinovski, 1988). So, the selection of the machine and the equipment that will be adopted by the crop operational system is the biggest challenge
for a cost reduction in the final timber price at the utilization point (Fernandes et al., 2012).
So, the forest harvest activity must be planned together with a machine logistic and the optimization of the sequential plot cutting, seeking for obtaining the shorter distance to the transport those to the cut unity, this may result in lower costs with the activity and also increase the forest harvest system productivity. Given the above, this research aimed to perform an operational analysis of forest harvesting activities in a mechanized system of cut-to-length.
2. MATERIAL AND METHODS 2.1 The field study characterization
The study was realized at the Southern of Bahia, in the cities Alcobaça (17º37’14’’ S 39º29’29’’ W) and Medeiros-Neto (17º 22’ 41’’S 40º10’10’’W), in areas with planted eucalyptus forest. The relief is characterized as flat to smooth wavy with a maximum slope of up to 5%, altitudes varying in a range from 10 to 50 m. The used system was cut-to-length with mechanized tree falling operation. Two harvester models and two forwarder forestry tractor models were analyzed, and the operation of the site was done in three shifts, totalizing 24h of daily work.
2.2 Characterization of the evaluated machine.
Two harvester models and two forwarder models
have as key features, the following aspects:
2.3 Data collection.
The owner company provided the machine storage data. The information of the machine output index (mechanical disponibility, operational efficiency, and use degree) was calculated, any other data that was necessary were obtained during the field collection, which happened in two periods: The first one occurred in March 2012 to analyze the harvester models.
To the data collection in the field, a study of times and movements proposed by Barnes (1977) was performed, which is characterized by the method of continue times using a digital chronometer and a form to register information. The monitoring of the operations and phases of the system happened in loco, during the company normal activities, without interferences.
The machine operational performance was evaluated in three harvest modules by the enterprise. Each module
was composed by ten harvesters and four forwarders.
Thus, the spent time that on the work journey was divided in:
Accessory time: Time dedicated to mandatory functions, but not directly related to the operation (operational stops for meals, security talk, operational support, training, shift changes, quality monitoring, meeting, stops caused by manager decisions and labor gymnastics)
Auxiliar time: Time spent with necessary functions required for the operation, without those, it would not have happened (washing, diesel refuel, motor oil, transmission oil, chain lubrification oil, rotation oil, hydraulic oil, and transport on the specialized truck).
Unproductive time: Corresponds to the idle time consumed during the maintenance activity. Time spent with the machine that would be available to the operation. However, is not being used (wait for the mechanic ( own or outsourced), fire flight, wait for pieces, failure on the front service, rain, wait for the bus, a missing operator, expect to the truck and administrative stops).
Maintenance time: Time used with the machine maintenance, preventive or corrective (time spent with base machine maintenance and implementations).
Productive time: Consist on the effective harvest or forestry extraction operation (falling, processing, and piling the wood up for the harvester and the wood transport to the road borders to the forwarder).
After a detailed evaluation of the operation and non-operational times, the forestry harvest cycle was divided into everyday activities to all the models, kind of machines and in phases inside the operations.
On this way, the Harvester operational cycle was divided into tree: falling (trees knock over); processing ( activities like branching, dehulling, cutting into logs, the top medium); transport (consists in the machine or head movement from the first position until the last
one in the cycle at the last tree that was cut); others ( interruption of the operational cycle activities due different reasons).
As for the forwarder, the operational cycle was divided: into empty transport (Moving from the roadside to the site of the flagged lumber); Loading (placing the wood in the loading compartment); Loaded transport (extraction of wood from the interior of the field to the edge of the road); Unloading (removal of the wood from the cargo compartment and stacking at the roadside).
2.4 Output indicators
The mechanical disponibility was considered as the work percentage, programmed time that the machine is mechanically adequate for the productivity work. The utilization degree, as the percentage time that the machine worked. The operation efficiency was calculated by the product of the mechanical disponibility with the level of use, following Fontes and Machado (2008) methodology.
Harvester and Forwarder productivity (m3.h-1)
was calculated based on the average volume per tree provided by the company’s pre-cut inventory, multiplying this value by the number of trees harvested, was obtained the total volume harvested. From the monitoring of the harvester and the forwarder, the hours worked were obtained using the continuous time methodology, in which the measurement of the times occurred without stopping the chronometer, continuously during all the activity performed by the machines. This time was considered as a total number of hours excluding the mechanical and operational interruptions.
2.5 Statistical Analysis.
The size of the sample used in the research was defined based on a pilot study, using the expression 1, proposed by Conaw (1977)
Whereas: n= number of necessary cycles T= T value, to wished probability level, (n-1) freedom degrees
CV= coefficient of variation in percentage
E= an admissible error
2 2
E CV t
The operational phases result in each shift, and work module was analyzed considering an entirely randomized design. The data was processed by a variance analyze (ANOVA, 1% of significance) and if significative results were obtained at the variance analyses, a Tukey test was performed at a 1% significance level.
3.RESULTS 3.1 Technical analyses
No significant difference was found in the statistical analysis of the machine models; the output results were analyzed by the mean values encountered on the model. On this way, on Table 3, we can observe the operational time distributed along the period 2010/2011 for the two analyzed machines (harvester and forwarder)
According to Table 4, comparing the operational times among the modules was observed that the maintenance time had the biggest percentages at 1% significance by the Tukey Test on the three treatments for the harvester. For this machine, the auxiliary time had the smallest value showing the biggest efficiency on the operational cycle.
3.2 Output indicator.
4.DISCUSSION
On the harvester analysis, was verified that the longest time was spent at 99% probability level was processing (The average length of the model B 26 seconds and 17 to the model A). This fact is justified by the fact that this activity comprehends the following steps: branching, dehulling, cutting into logs and the top medium. The obtained values
Máquinas Modelos Modelos
Harvester
Model harvester model A harvester model B
Weight (kg) 21.000 22.359
Engine E-1 6-cylinder, turbocharged 6068H 6-cylinder, direct injection, aftercooler, 4 strokes, water cooled, 2000 rpm..
direct injection, 2000 rpm
Power (HP) 155 159
Wheels Conveyor with central frame in “X.” Conveyor with central frame in “X.”
Forwarder
Model Model C Model D
Weight (kg) 16.800 18.500
Engine 6-cylinderdirect 6-cylinder direct
injection, 2200 rpm. injection, 2200 rpm.
Power (HP) 150 160
Wheels 6 tires 6 tires
Table 1 – Key features of the models of harvester and forwarder´s evaluated.
were lower than the ones found by Martins et al. (2009), 29 seconds and higher than Silva (2011), 15 seconds, to areas with the same declivity and spacing among the trees. Those time differences that were encountered may be related to the tree heights average that was processed, the highest the tree trunk is, more logs will be handled, consequentially, more time will be spent on a tree. The others activities did not have a significative difference. When comparing forwarder models, the step that spent the longest time was the loading and the shortest the machine transport (full and empty). On a study realized by Minette et al., (2004) with a forwarder, similar values were obtained, empty transport 7.41%, 52.81% loaded, 5.77% loaded transport and 28.17% with the wood unload.
The machines operation times decreased during 2011 (on the harvest 2.7% and the forwarder 3.4%). About the crop, there was no increase in the accessory and unproductive time. Thus, must be verified, if the increasing operation stop to the meals is longer than the time stipulated by the company. Besides, those results show that there was not an improvement on the module production system planning, aiming an unproductive time decreasing.
To the forwarder, there was a decline of unproductive time (2.6%). Nevertheless, when the accessory and maintenance times are analyzed, is possible to see that a percentual increase happened on those items. On the maintenance time, there were a 3,5% increment, what can be considered as worrying, showing that is important to realize studies to verify the necessity to change the machine or not, or if it happened due to the poor quality of labor services, or the by the unappropriated use (adaptations) of parts and components. To the forwarder, the best results were on the modules 1 and 3 to the accessory time, to the auxiliary time the ones that had the best results were modules 1 and 2. When comparing, the modules behaviors inside the operational times to the harvesters; there was no significative difference among the treatments on the accessory, auxiliary and unproductive time. Comparing the productivity, module 1 has a better result than 3, on the statistical test.
To the forwarder treatment, there was no significative difference at 1% to the auxiliary and maintenance times. Comparing to the operational times of the shifts is possible to observe that the maintenance time had bigger values at 1% on the Tukey Test during the three-harvest treatment. About the forwarder, the unproductive time presented the highest percentage in the three modules.
The forwarder auxiliary time corresponds to the
smallest percentage of all the shifts, but the third shift did not have the significative difference between auxiliary and accessory time.
When comparing the shift behavior inside the harvest operational times, is possible to observe, that only the unproductive time did not have any statistical difference between the treatments. When the productivity is analyzed, the third shift had the biggest average and the first shift, the smallest. This fact could be explained that on the third shift only were made easy corrective maintenance, more elaborated services, preventive maintenance done on the first shift, due to the better visibility on the service execution and a better technical assistance could be done during this period.
The unproductive times and the maintenance from the forwarder had a statistical difference at 99%; because on the third shift only happened when was missing wood to the company and how the forwarder productivity is higher than harvester, there is a lack of wood encased inside the field that should be extracted to the roadside. This planning problem needs to be improved.
4.1 Output indicator
The forwarder has a bigger mechanical disponibility, due the small maintenance time. However, when it is compared it is utilization and efficiency, it is possible to see that the harvester show better results. This event can be explained by the fact the forwarder have higher unproductive time values due to the lack of service of, by waiting for the board for locomotion of machine between as units of forest harvest.
When comparing the machine productivities, the
forwarder had a higher output, that is, to a balanced
production system, is needed tree (2,96) harvester to each forwarder. Nevertheless, the company adopts a system with 2,5 harvester to each forwarder, which is an unbalanced system, the main real is the high unproductive time from the forwarder. The machine mechanical disponibility directly relates the operational efficiency, this means, that when the mechanical disponibility increases, the operational efficiency also increases.
The harvester output indicator was above the one
Machine Time Mod.1 Mod.2 Mod.3 Shift1 Shift2 Shift3 Accessory 6,27 Ba 6,05 Ba 7,73 Ba 9,05 Ba 7,49 Bb 2,72 Bc
Auxiliary 2,17 Ca 2,66 Ca 2,71 Ca 2,44 Cb 1,37 Cb 3,78 Ba Unproductive 8,43 Ba 7,74 Ba 7,47 Ba 8,31 Ba 7,37Ba 7,68 Aa
harvester Maintenance 12,77 Ab 14,27 Aab 17,27 Aa 20,17 Aab 14,23 Ab 8,75 Ac
Operational 70,36 69,29 64,82 60,02 69,54 77,07
Total 100 100 100 100 100 100
Accessory 6,75 BCb 16,14 Aa 9,02 BCb 12,58 Ba 9,55 Ba 9,01 Ba Auxiliary 1,93 Ca 1,86 Ca 3,31 Ca 2,44 Ca 12,16 Ca 3,25 Ba Unproductive 22,17 Aa 11,61 ABb 16,67 Aab 13,06 ABb 13,57 Ab 23,14 Aa
forwarder Maintenance 10,96 Ba 10,34 Ba 13,58 ABa 15,26 Aa 8,69 Bb 9,11 Bb
Operational 58,19 60,05 57,42 56,65 56,03 55,5
Total 100 100 100 100 100 100
Table 4 – Analysis of the distribution operating times (in percentage) about the harvesting modules, Tukey’s test at 99% probability.
Tabela 4– Análise da distribuição dos tempos operacionais (em percentagem) em relação aos módulos e turnos de colheita, pelo teste Tukey a 99% de probabilidade.
Table 2 – Average cycle and percentages for the models analyzed harvester and forwarder.
Tabela 2 – Tempos médios dos ciclos e percentuais para os modelos analisados de harvester e forwarder.
Operational Cycle Average Cycle (min) Continue (%)
Tree falling 00:04 b 13,08
Processing 00:17 a 57,92
Harvester model A
Transport 00:06 b 18,80
Others 00:03 b 10,19
TOTAL 00:30 100
Tree falling 00:06 b 14,96
Processing 00:26 a 61,34
Harvester model B Transport 00:08 b 18,98
Others 00:02 b 4,72
TOTAL 00:42 100
Tree falling 01:05 c 7,41
Processing 07:25 a 50,74
Forwarder model C
Transport 00:57 c 6,49
Others 05:10 b 35,34
TOTAL 14:37 100
Tree falling 01:48 c 9,37
Processing 10:13 a 53,21
Forwarder model D Transport 01:28 c 7,63
Others 05:43 b 29,77
TOTAL 19:12 100
Note: Average values followed by the same letter do not differ from each other, by the Tukey Test (1%)
Harvester Forwarder
2010 2011 2010 2011
Accessory 5,8 9,6 7,7 9,9
Auxiliary 2,1 1,7 1,8 2,1
Unproductive 7,6 7,6 17,0 14,4
Maintenance 16,8 16,0 10,7 14,2
Operational 67,7 65,0 62,7 59,3
Table 3 – Distribution of operating times average during the years 2010 and 2011 in percentage (%).
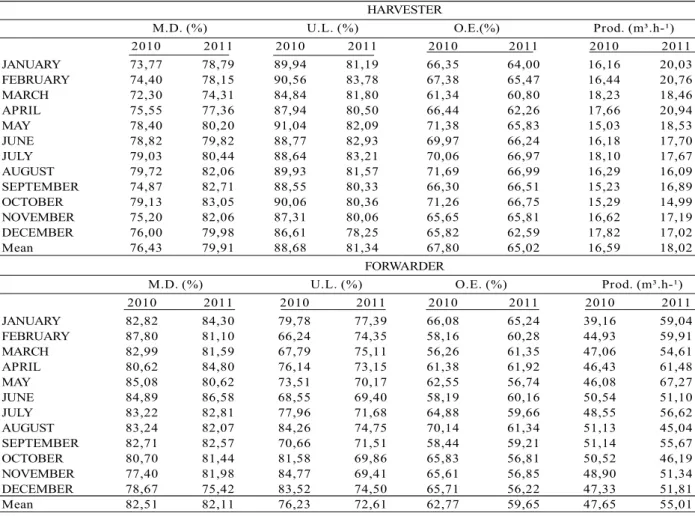
were similar (average 78,17%) to the one that was found in this research (average 78,8%).
About the forwarder, Oliveira et al. (2009), encountered a very low average productivity (39 m³. ha-1) comparing with the one found in this study (average 51, 33m³.ha-1). It is caused by a different assortment of the evaluated logs. On the study that was analyzed, the logs had an average 2,6m length, while in this study the average duration was 6m, when the log size increase, it will decrease the movement of the crane to load the compartment and consequently the productivity of the machine will increase.
5.CONCLUSION
Among the accessory time, the stop realized to meals was the one with higher values (percentual).
HARVESTER
M.D. (%) U.L. (%) O.E.(%) Prod. (m³.h-¹)
2010 2011 2010 2011 2010 2011 2010 2011
JANUARY 73,77 78,79 89,94 81,19 66,35 64,00 16,16 20,03 FEBRUARY 74,40 78,15 90,56 83,78 67,38 65,47 16,44 20,76 MARCH 72,30 74,31 84,84 81,80 61,34 60,80 18,23 18,46 APRIL 75,55 77,36 87,94 80,50 66,44 62,26 17,66 20,94 MAY 78,40 80,20 91,04 82,09 71,38 65,83 15,03 18,53 JUNE 78,82 79,82 88,77 82,93 69,97 66,24 16,18 17,70 JULY 79,03 80,44 88,64 83,21 70,06 66,97 18,10 17,67 AUGUST 79,72 82,06 89,93 81,57 71,69 66,99 16,29 16,09 SEPTEMBER 74,87 82,71 88,55 80,33 66,30 66,51 15,23 16,89 OCTOBER 79,13 83,05 90,06 80,36 71,26 66,75 15,29 14,99 NOVEMBER 75,20 82,06 87,31 80,06 65,65 65,81 16,62 17,19 DECEMBER 76,00 79,98 86,61 78,25 65,82 62,59 17,82 17,02 Mean 76,43 79,91 88,68 81,34 67,80 65,02 16,59 18,02
FORWARDER
M.D. (%) U.L. (%) O.E. (%) Prod. (m³.h-¹)
2010 2011 2010 2011 2010 2011 2010 2011
JANUARY 82,82 84,30 79,78 77,39 66,08 65,24 39,16 59,04 FEBRUARY 87,80 81,10 66,24 74,35 58,16 60,28 44,93 59,91 MARCH 82,99 81,59 67,79 75,11 56,26 61,35 47,06 54,61 APRIL 80,62 84,80 76,14 73,15 61,38 61,92 46,43 61,48 MAY 85,08 80,62 73,51 70,17 62,55 56,74 46,08 67,27 JUNE 84,89 86,58 68,55 69,40 58,19 60,16 50,54 51,10 JULY 83,22 82,81 77,96 71,68 64,88 59,66 48,55 56,62 AUGUST 83,24 82,07 84,26 74,75 70,14 61,34 51,13 45,04 SEPTEMBER 82,71 82,57 70,66 71,51 58,44 59,21 51,14 55,67 OCTOBER 80,70 81,44 81,58 69,86 65,83 56,81 50,52 46,19 NOVEMBER 77,40 81,98 84,77 69,41 65,61 56,85 48,90 51,34 DECEMBER 78,67 75,42 83,52 74,50 65,71 56,22 47,33 51,81 Mean 82,51 82,11 76,23 72,61 62,77 59,65 47,65 55,01 Table 5 – Analysis of the performance parameters during the years 2010 and 2011.
Tabela 5 – Análise dos parâmetros de rendimento durante os anos de 2010 e 2011.
Note: M.D.: mechanical disponibility, U.L..: utilization level; O.E. operational efficince. and Prod: Produtivity
The biggest percentual of the unproductive time was the wait due the missing pieces and components and the highest concentration of maintenance activities times was related to the base machine in the two machines analyzed.
The auxiliary activities correspond to the lowest results on the operational times, but the operation activities had the highest percentual.
The first shift had the worst operational results to both machines.
To the harvester, module 1 had a better result on the productive time, and to the forwarder, the same module has the worst result.
the harvester, were the indicators of the degree of utilization and operational efficiency.
6. ACKNOWLEDGEMENTS
The Federal University of Espírito Santo (UFES) and the Founding of Support for the Research and Innovation of the Espírito Santo (FAPES) for the granting of scholarships and for acquisition of the necessary subjects for research.
7.REFERÊNCES
Alves EG, Fiedler NC, Carmo FCA, Lopes ES, Lachini E, Coelho FE. Efeito do turno de trabalho na produção e produtividade de máquinas de colheita de madeira. Nativa, 2015;3(3):201-14.
Associação Brasileira de Produtores de Florestas Plantadas - ABRAF. Anuário estatístico da ABRAF 2013: ano base 2012. Brasília: 2013. 146p.
Barnes RM. Estudo de movimentos e de tempos: Projeto e medida do trabalho. 6ª.ed. Americana: Edgard Blucher; 1977. 635p.
Fernandes HR, Burla ER, Leite ES, Minette LJ. Avaliação técnica e econômica do harvester, em diferentes condições operacionais. Engenharia na Agricultura. 2012;20(5):145-51.
Conaw PL. Estatística. São Paulo: Edgard Blucher; 1977. 264p.
Fontes JM, Machado CC. Manutenção mecânica. In: Machado CC. Colheita florestal. 2ª.ed. Viçosa, MG: 2008. p.261-309.
Lacerda LC, Fiedler NC, Chichorro FJ, Carmo FCA, Mendonça AR. Análise operacional da extração florestal mecanizada em módulos próprios e terceirizados. Nativa. 2015;3(3):205-9.
Leonello EC, Goncalves SP, Fenner PT. Efeito do tempo de experiência de operadores de Harvester
no rendimento operacional. Revista Árvore. 2012;36(6):1129-33.
Machado CC, Lopes ES. Análise da influência do comprimento de toras de eucalipto na
produtividade e custo da colheita e transporte florestal. Cerne. 2000;6(2):124-9.
Machado CC, Malinovski JR. Ciência do trabalho florestal. Viçosa, MG: Universidade Federal de Viçosa; 1988. 65p.
Machado CC, Silva EN, Pereira RS. O setor florestal brasileiro. In: Machado CC. Colheita florestal. 2ª ed. Viçosa, MG: 2008. p.15-42.
Martins RJ, Seixas F, Stape JL. Avaliação técnica e econômica de um harvester trabalhando em diferentes condições de espaçamento e arranjo de plantio em povoamento de eucalipto. Scientia Forestalis, 2009;37(83):253-63.
Minette LJ, Moreira FMT, Souza AP, Machado CC, Silva KR. Análise técnica e econômica do
forwarder em três subsistemas de colheita em
florestas de eucalipto. Revista Árvore. 2004;28(1):91-297.
Oliveira D, Lopes ES, Fiedler NC. Avaliação técnica e econômica do Forwarder na extração de toras de pinus, Scientia Forestalis.
2009;37(84):525-33.
Santos PHA. Souza AP, Marzano FLC, Minette LJ. Produtividade e custos de extração de madeira de eucalipto com Clambunk Skidder.Revista Árvore2013;37(3):511-8.
Schuchovski MS. Diagnóstico e planejamento do consumo de madeira e da produção em plantações florestais no Estado do Paraná [dissertação]. Curitiba: Universidade Federal do Paraná; 2003.
Silva, E.N. Avaliação técnica, de custos e ambiental de dois modelos de harvester na colheita florestal [tese]. Viçosa, MG: Universidade Federal de Viçosa; 2011.