www.ccarevista.ufc.br ISSN 1806-6690
Sediment loss in semiarid small watershed due to the land use
1Produção de sedimentos em microbacias hidrográficas semiáridas sobre manejos
diferenciados
Joseilson Oliveira Rodrigues2, Eunice Maia de Andrade3*, Helba Araújo Queiroz Palácio4, Luiz Alberto Ribeiro
Mendonça5 e Júlio César Neves dos Santos6
ABSTRACT -The aim of this study was to evaluate and compare the sedimentological behavior in two small rural watersheds in the semiarid Northeast of Brazil, examining the influence of human activity on the sediment yields. The studied area is sited in the Alto Jaguaribe basin, more precisely in the Iguatu County, Ceará State. The experimental area was composed of two small watersheds denominated B1 and B2. In watershed B1 a treatment (thinning) was applied, eliminating the plant species with diameters lower than 10 cm. The results showed that the Caatinga clearing practice did have an influence in changing the sediment yield during the first events. It was also found that the magnitude of previous events contributed to an increase in the sediment yields by the subsequent events as a consequence of the sediment deposit in the drainage network. The accumulated sediment yields reached at the end of the 2009 rainfall season values of 1.45 and 1.39 tons ha-1 year-1 for B1 and B2, respectively, with no significant difference at 5%. It was concluded that, even when the effect of treatment on the sediment yields at the beginning of the rainy season is measured, the total sediment yields was not changed by the adoption of clearing. Therefore, it is a management system that can be employed in the land use at semiarid regions.
Key words:Caatinga. Soil degradation. Soil erosion. Ephemeral creek.
RESUMO -O objetivo central deste trabalho foi avaliar e comparar o comportamento sedimentológico em pequenas bacias rurais no semiárido nordestino, verificando a influência da ação antrópica sobre a produção de sedimentos. O estudo de caso foi conduzido em duas microbacias adjacentes e com uso da terra distintos. Estas estão localizadas no Bioma Caatinga, no semiárido do nordeste do Brasil. Em uma microbacia (B1) foi aplicado um tratamento (raleamento), eliminando-se as espécies vegetais com diâmetro inferior a 10 cm. A segunda microbacia experimental (2) foi mantida com sua cobertura vegetal original, que não é explorada há 30 anos. Os resultados revelaram que a prática de raleamento da Caatinga teve influência na alteração da produção de sedimentos durante os primeiros eventos. Verificou-se também que a magnitude dos eventos anteriores contribuiu para aumento na produção de sedimentos pelos eventos subseqüentes em conseqüência da deposição de sedimentos na rede de drenagem. A produção acumulada de sedimentos atingiu ao final do período chuvoso de 2009 valores de 1,45 e 1,39 ton ha-1 ano-1 para as microbacias B1 e B2, respectivamente, não apresentando diferença significativa ao nível de 5%. Conclui-se que, mesmo sendo constatado o efeito do tratamento sobre a produção de sedimentos no inicio da estação chuvosa, a produção total de sedimentos não foi alterada pela adoção do raleamento. Portanto, o mesmo é um manejo que pode ser empregado no uso da terra de regiões semiáridas.
Palavras-chave:Caatinga. Solos-degradação. Solos-erosão. Cursos efêmeros.
*Autor para correspondência
1Recebido para publicação em 02/04/2012; aprovado 08/02/2013
Parte da Dissertação do primeiro autor apresentada ao Programa de Pós-Graduação em Engenharia Agrícola/UFC
2Departamento de Engenharia Agrícola, Universidade Federal do Ceará, Foirtaleza-CE, Brasil, [email protected] 3Universidade Federal do Ceará, Campus Cariri, Juazeiro do Norte-CE, Brasil, [email protected] 4Instituto Federal do Ceara, Campus de Iguatu-CE, Brasil, [email protected]
5Universidade Federal do Ceará, Campus Cariri, Juazeiro do Norte-CE, Brasil, [email protected]
INTRODUCTION
Semiarid regions cover approximately one third of the earth’s surface and approximately 20% of the
world’s population lives in them (GAISERet al., 2003).
These regions are very fragile and are characterized by a high spatial and temporal variability of rainfall depth
(RODRIGUESet al., 2008). The variability of the pluvial
regime in these regions associated with man’s intervention in land and water usage may change them, bringing about a new support ability from these resources. As a result of this problem, the improper management of the basins has led to serious socioeconomic and environmental consequences, such as erosion in agricultural areas, resulting in an impoverishing of agricultural land, silting and a reduction in the hydraulic capacity of downstream
reservoirs (ALBUQUERQUE et al., 2002; CANTÓN
et al., 2001; MAMEDE, 2008; MEDEIROS et al., 2010;
THOMAZ, 2009). The semiarid regions of the Brazilian Northeast, where Caatinga vegetation prevails, experience a significant variation in precipitation indices and the soils are normally very shallow, making them vulnerable to erosive processes. In several cases, depending on the distribution and intensity of the rains, soil losses may extend beyond the tolerable limits, which are around 2.5
to 5 ton ha-1 year-1 for shallow soils according to theFood
and Agriculture Organization (FOOD AGRICULTURE
ORGANIZATION, 1965).
In addition to the problems mentioned, deforestation is a common practice in these regions as a consequence of demographic pressures induced by a growing demand for agricultural and forestry products. Clearing the land is used as a way to achieve useable areas for agricultural and livestock production. Indiscriminate deforestation in order to create new farms, together with the removal of wood for profit (construction, firewood, charcoal etc.) and the successive burns with inadequate
soil management, has combined with prolonged droughts to compromise the fragile Caatinga equilibrium. The combination of these activities often results in permanent changes in hydrosedimentological processes (AGUIAR
et al., 2006; BERTOLet al., 2006; SOUGNEZ; VAN
WEBEMAEL; VANACKER, 2010).
Significant effort has been made in an attempt to understand the behavior and/or changes in the sediment yield process in the small basins. Despite there having been some studies conducted in semiarid regions on the changes in the pattern of sedimentological responses, the research needed to have been implemented in such a way as to generate information at the ephemeral small watershed scale, primarily investigating the influence of man on the alteration of natural processes (erosion, superficial runoff, maximum outflows, infiltration,
etc.) (BARTLEYet al., 2006; GARFURet al., 2003;
GARCIA-RUIZet al., 2008; SANTOSet al., 2011).
The challenges in studies of hydrosedimentological processes are related to the generation of consistent qualitative and quantitative information that can accurately describe these processes. In this setting, the objective of this study was to evaluate and compare the sediment yields on a mayfly small watershed scale, seeking to identify the influence of man’s activities on the change in the production of this resource.
MATERIALS AND METHODS
Description of the studied location
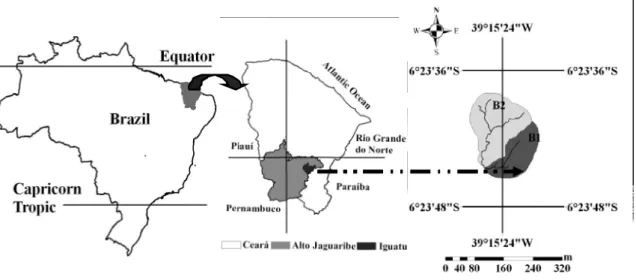
The studied area is located in the Alto Jaguaribe basin, more precisely in the Iguatu County, in the South Central region of Ceará State, Brazil, between the geographic coordinates 6°23’42’’ to 6°23’47’’ S and 39°15’24’’ to 39°15’29’’ W (Figure 1).
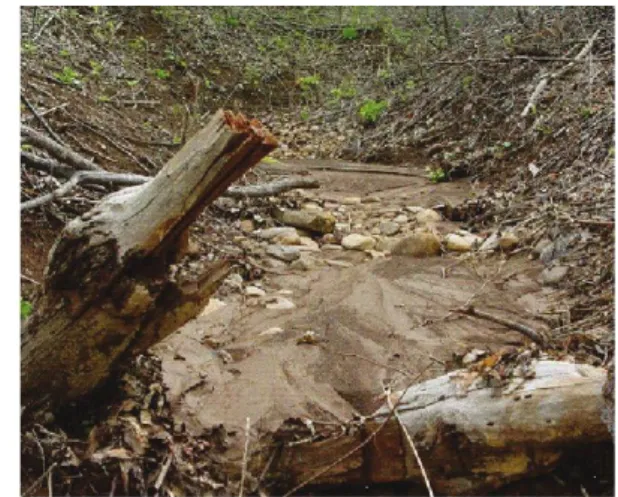
Figure 2 -Soils with cracks during the dry season (a) and sediment deposition in the main channel (b)
Figure 3 - The monthly rainfall data set at the Iguatu station, CE. The vertical bars represent the monthly standard deviation for the 35 years data set (1973-2008)
The soil of the watershed is classified as a typical deep-black, Carbonate Vertisol, following the Brazilian Soil Classification System (EMPRESA BRASILEIRA DE PESQUISA AGROPECUÁRIA, 2006). Its profile is flat and smoothly wavy from an intense erosive process in clay soils, with type 2:1 clay, from the Montmorillonite group. Than, these soils have the potential to shrink and swell, especially in climate regions that have distinct wet and dry seasons. During
dry season, these soils have large cracks on the surface and in the wet season the cracks disappear (Figure 2).
The climate is classified as hot semiarid climate (BSw’h’), with maximum rainfall in autumn, and the average monthly temperature is always above 18 ºC. The annual average of rainfall is 970 ± 316 mm, characterized by a high seasonal variability. The pluviometric precipitation exhibited an unimodal distribution with the maximum rainfall recorded in the months of January to May (Figure 3).
Experimental small watersheds
The experimental area comprised two small watershed named B1 and B2, located near one another, with evaluation areas no larger than 3 hectares that were surrounded and equipped and intended for sedimentological studies under natural rain conditions. The average slope
of the studied watersheds was 8.7 for B1 and 10.6% for B2, and the water ways are of the first and second order for B1 and B2, respectively and belong to the ephemeral hydrologic regime. Based on flora samples from the small watersheds, the structure of the vegetal coverage found in the area is formed primarily be herbaceous vegetal
species, like Hyptis sauaviolens (L.) point (Bambural)
and Hyptis sp. (minty); followed by a lesser proportion
of characteristically shrubby and arboreal vegetal species like Aspidosperma pyrifolium Mart (Pereiro) (ALVES,
2008). To identify the effect human activity on the hydrosedimentological process, small watershed B1 was cleared, a practice widely implemented by small farmers in the Brazilian semiarid region to increase the biomass of herbaceous extract and provide a greater availability of feed for herds of sheep, goats or cattle (ARAÚJO FILHO
et al., 2002). This treatment was applied with the intention
Figure 4 -(a) watershed B1 after clearing treatment (November 2008); (b) details of the vegetal coverage in watershed B2 during dry
season (November, 2008)
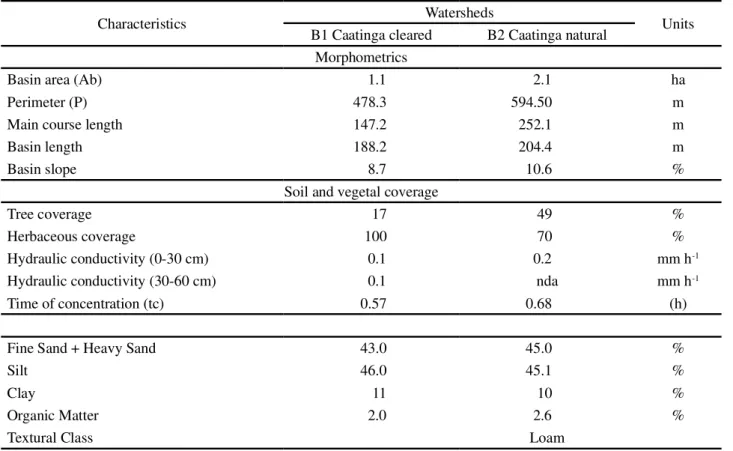
Table 1 -Characteristics of experimental small watershed B1 and B2
Experimental small watersheds B2 was kept unchanged, therefore representing natural conditions for small rural basins in the semiarid Northeast (Figure 4b). The morphometric and soil characteristics of B1 and B2 are presented in Table 1.
The data employed in this investigation include the wet season in the 2009 hydrological year (January to May).
Both watersheds were equipped with Parshall weir set with automatic limnigraph and pluviographs with a resolution of 0.254 mm. All the hydroclimatological data were collected via a data collection platform (PCD) installed in each watershed and programmed to gather data every five minutes. The sedimentological data were collected through automatic collectors of stream sediments, with 100 mL bottles
Characteristics Watersheds Units
B1 Caatinga cleared B2 Caatinga natural
Morphometrics
Basin area (Ab) 1.1 2.1 ha
Perimeter (P) 478.3 594.50 m
Main course length 147.2 252.1 m
Basin length 188.2 204.4 m
Basin slope 8.7 10.6 %
Soil and vegetal coverage
Tree coverage 17 49 %
Herbaceous coverage 100 70 %
Hydraulic conductivity (0-30 cm) 0.1 0.2 mm h-1
Hydraulic conductivity (30-60 cm) 0.1 nda mm h-1
Time of concentration (tc) 0.57 0.68 (h)
Fine Sand + Heavy Sand 43.0 45.0 %
Silt 46.0 45.1 %
Clay 11 10 %
Organic Matter 2.0 2.6 %
nda - absence of data, Monitoring and treatment of the hydrosedimentological data
0-5 cm
Soil density 1.65 1.29 g cm-3
Microporosity 40.03 46.04 %
Macroporosity 12.58 12.48 %
Total Porosity 52.61 58.52 %
5-15 cm
Soil density 1.38 1.50 g cm-3
Microporosity 36.72 50.88 %
Macroporosity 11.55 7.14 %
Total Porosity 48.27 58.01 %
continuação tabela 1
available every 15 cm, a total of 12 for each watershed. The samples were collected soon after generating flow events of surface clearing that reached a collection point in the sediment tower. The concentration analyses of solids were performed later on in the Laboratory of Water, Solids and Vegetal Tissue at the Federal Institute of Education, Science and Technology at Iguatu, Ceará, according to the American Public Health Association (1998) methodology.
The superficial flow monitored via the Parshall weirs were later converted to runoff volume by expression 1. The total sediment yield was determined by multiplying the sediment concentration by the total volume of runoff.
(1)
where:V - volume of runoff water corresponding to each rainfall event, L; to start time of the overland flow, s; tn -end time of the overland flow; Q(t) - drainage as a function
of time, L s-1 and t - the runoff time interval, s.
In all watersheds rating curves were created, correlating
the sediment yield values (ton ha-1) for each individual event
with the corresponding peak flow (L s-1). For each one, a
variance analysis was done, intended to test the model for the best adjustment of the ratio between runoff and sediment yield. With the models generated, the stream sediment yield was estimated, and the difference between the values measured and those estimated is determined according to the following ratio. (HOROWITZ, 2003).
(2)
where: %d - represents the percentage deviation between the sediment yield measured and estimated (%); SY
-Measured sediment yield (ton ha-1); SY
est - Estimated
sediment yield (ton ha-1).
As a way to evaluate the sediment yield, erosivity values are also calculated, which is considered to be a good indicator/estimator of soil loss (ALBUQUERQUE
et al., 2005). The rainfall erosivity (EI30) was estimated by
expression 3 (WISCHMEIER; SMITH, 1978):
(3)
where: Ec = kinetic energy of rainfall per area unit (MJ ha-1);
and I30 = maximum rainfall intensity in half an hour
(mm h-1). Further information about the calculation
processes involving the estimated kinetic energy can be found in Wischmeier and Smith, 1978. The average sediment yield values were compared by the t test at a significance level of 5%, also it was investigated the relationship between sediment productivity and discharge peak by a regression analysis using the SPSS v.16.0.
RESULTS AND DISCUSSION
During the period of investigation, it was
registered an erosivity varying from 74 MJ mm ha-1 h-1,
responding to the lower sediment yield in the period
(24 kg ha-1), to 1.114 MJ mm ha-1 h-1 for the event on
January 30, 2009. Although, it was the largest erosivity event, it accounted for a low sediment yield (Figure 5). This fact is explained by the high value of initial abstraction of water registered in the early rainfall events, resulting in a low runoff volume and promoting
a reduction in sediment yield (SANTOS et al., 2011).
of evapotranspiration (>1900 mm year-1). This climatic characteristic results in an increased deficit in the soil, thereby requiring an increased intake of water by the soil to promote saturation and surface runoff, influencing sediment yield. Another important process that is related with the low sediment yield in the early events is shrink
Figure 5 - Erosivity (EI30), Sediment yield (SY) and Accumulated sediment yield (SYacum) by events in watersheds B1 and
B2 for the 2009 rainfall season
Although there is a difference in the watersheds macroporosities, we can not attribute the changes occurred in the sediment yield during the end of wet season to them, since they do not change at this time. Also, geomorphologic watershed characteristics cannot explain the sediment yield behavior since there is a high geomorphologic similarity between B1 and B2 (Table 1). Thus, the main cause for sediment yield alteration is the growth of herbaceous vegetation. The great growth of herbaceous vegetation in B1 due to the land use (Figure 6) during the wet season resulted in a physical barrier to sediment dynamics. This fact, largely justifies the lower sediment yield of the thinned watershed B1, as will be discussed.
As has already been presented in material and methods, B1 was cleared, the vegetal coverage was changed, while B2 characteristics were unaltered, serving as a standard for comparison of the two. Analyzing the available data, a high sediment yield tendency can be observed in two periods, one of them during the events that took place from 18 February to 4 March, and the other from 30 April to 8 May (Figure 5). For the event on 18 February the sediment yield value is justified by the magnitude of the vent, and this is considered the largest for the year 2009,
with the peak flow reaching 105 and 80 L ha-1 s-1 in B1 and
B2 respectively, with I30 at 61.2 mm h-1. For the following
event (4 March), although smaller in magnitude than the
first, with I30 equal to 29.5 mm h-1, a high sediment yield
was also registered, greater than 100 kg ha-1 (Figure 5).
The greatest sediment yield was recorded in B2 for
the event of 30 April, 2009, reaching the value 635 kg ha-1,
resulting in a total yield similar to the cleared watershed, B1
Figure 6 - Herbaceous vegetation cover in the watershed B1
after thinning
(Figure 5). The event referred to was the shortest in duration
(0.75 h), with I30 and I5 reaching a rate of 55.8 mm h-1 and
97.5 mm h-1, respectively. It is significant that during the
period of the event on 30 April, the content of the water in the soil was 27%, and registered as saturated or nearly saturated (RODRIGUES, 2009). It is believed that the elevated water content in the soil influenced in reducing the rate of infiltration, this aspect combined with high intensity of the events favored a high drag rate and soil sediment along the beds of the waterway.
In addition to generate high suspended sediment concentrations (SSC), events of this magnitude result in financial and environmental damages from the removal of this resource from the basin, causing fertility depletion
(BARTLEYet al., 2006; THOMAZ, 2009). Also, it gives
way for a residual effect associated with the disturbance of the soil and sediment deposit in susceptible areas, which are easily carried away in subsequent events. According
to Garfuret al. (2003), values of I30 greater than 25 mm h-1
may be considered critical for erosive processes. Of all the observed events (Figure 5), only four have a maximum
intensity in thirty minutes (I30) less than this threshold, the
event on 13 April, 2009 (I30 of 18.7 mm h-1) is the lowest
sediment yield value in B1 and B2, with values of 9.6
and 10 kg ha-1, respectively.
According to the previous analysis, it was identified the effect of the characteristics of the event on the sediment yield in the next events. This way, the characteristics of the event of february 18 influenced in the sediment yield of the subsequent event (March/04).
The same effect can be observed for B1 and B2 in the events on the 30 April and 8 May. These results suggest the existence of connectivity between the events regarding the production and transportation of sediments; that is, the characteristics of the event from 18 February, may be influenced in the removal and transportation of sediments, with their deposit on the main channel and the lowest parts of the basin (Figure 2b), becoming available to be transported in the subsequent event (March 4).
This condition of production and transportation of sediments by successive events may suggest that the sediments, and nutrients along with them, may leave the basin at small intervals of time, due to the speed of the flow, and by the fact that the transportation becomes facilitated by the presence of sediments directly on the
drainage network (FRYIRSet al., 2007).
Figure 7 - Peak discharge versus accumulated rainfall until the peaks (PPTant)
the hypothesis of the increment in the sediment yield as a consequence of the differences in the land use. This fact was true only in the initial phase of the wet season. In the events subsequent to this date (April 17 to May 13, the phase of full herbaceous growth development), an inversion occurred and B2 began to present a greater sediment yield compared to B1. It is believed that the rapid herbaceous vegetation development during the post-treatment at small watershed B1 and the effect of internal roughness in the basin caused by microelevações, microdepressions and the residual litter, have contributed to the attenuation of the sediment yield. The bloom of vegetation began after the first rainfall events and increased progressively until the end of the rainy season. After the herbaceous cover had been established the infiltration and retention of sediments increased in the area. These results
confirm the observations of Bertol et al. (2006), that
show the effect of surface vegetation and waste left on the
ground on reducing runoff and sediment yield. Aguiaret
al. (2006), who studied soil and water losses in intensely
cultivated conditions in semiarid regions, also identified the influence of herbaceous growth on the reduction of losses from the soil. This observation point out to more sequential observations, where the contribution of each period of herbaceous growth in watershed sediment yield in semiarid regions can be quantified.
The total sediment yields accumulated of experimental units B1 and B2 in 2009 corresponded
to 1.45 and 1.39 ton ha-1, respectively (Figure 5). These
values are greater than those concluded by Sougnez, Van Webemael and Vanacker (2010), who determined
maximum annual values of 250 kg ha-1 year-1 in sparsely
vegetated catchments in southeast Spain; and greater than
those calculated by Gargur et al. (2003) in watersheds
in India, which reached average losses of 1.2 ton ha-1
year-1 in constant tilled and abandoned land agricultural
systems. However, statistical analysis about the average
sediment yield values between B1 (96.73 kg ha-1) and
B2 (139.78 kg ha-1) in the period revealed that there was
no significant difference between both at 5% statistical significance. But, considering that the critical level of
loss for shallow soils is between 2.5 and 5 ton ha-1 year-1
(FOOD AGRICULTURE ORGANIZATION , 1965), and that the year 2009 presented well distributed precipitation and with erosivity values that are much lower compared to 2008 (ALVES, 2008), the values found for the year 2009 raised the alarm with respect to sustainability, especially if these levels were kept up over several years.
The relationship between peak discharges and accumulated rainfall until the peaks (PPTantec) shows up the effect of them over the increases in runoff and sediment yield (Figure 7). It is observed that the production of runoff in watersheds B1 and B2 occurs for accumulated
rainfall of respectively 8 and 6 mm with a flow rate of
increase of 3.3 and 4.9 L s-1. For the individual relationship
runoff up monitoring units in B1 and B2 is explained by respectively 79 and 78% of the variation of precipitate accumulation before the peak. This analisy suggests that the accumulated previous rainfall, are important in explaining the effect of water accumulation in soil on the
specific elevation of peak discharges. Garcia-Ruiz et al.
(2008) e Cantónet al. (2001), also point to the influence
of previous rainfall in higher peak discharges.
In the absence of data measuring the sediment concentration, generally rating curves are used to approximately estimate the sediment yield, which requires measuring of runoff and sediment yield. In Figure 8, rating curves are displayed for the individual events for the 2009 wet season in B1 and B2, respectively. A total of 23 events were employed in sediment yield in the two watersheds, fourteen of which were in B1 and 9 in B2. The linear regression analysis revealed the adjusted potential as being the one most applicable to explain the sediment yield variation as a function of the maximum observed runoff. In these, the adjusted model of best performance was the
potential, with a statistical significance of 1% and R2 of 0.80
and 0.68, respectively (Figure 8) Although sediment yield is a multivariate process and a single parameter analysis can explain only part of the phenomenon, these analysis are important to point out the tendency of the process.
Figure 8 -Rating curves: Sediment yield observed vs Peak flow for experimental small watershed B1 and B2 in the 2009 rainy season
Table 2 - Sediment yield observed (SY) and sediment yield estimated (SYest) employing the models from figure 8 and Percentage deviations in small watershed B1 and B2 in the 2009 rainy season
nda - absence of data; *- negative deviations indicate that the estimated values were underestimates of what was observed
Event B1 B2
SY SYest % SY SYest %
Jan-30-09 17.66 56.14 217.92 6.94 19.59 182.31
Feb-04-09 1.16 2.80 141.62 nda
Feb-12-09 6.21 4.88 -21.35 nda
Feb-18-09 295.75 254.26 -14.03 94.02 254.27 170.45
Mar-04-09 104.74 100.23 -4.31 123.26 129.50 5.06
Mar-17-09 41.98 74.12 76.55 nda
Apr-13-09 nda 10.23 8.35 -18.33
Apr-05-09 54.78 71.80 31.06 nda
Apr-17-09 83.10 181.17 118.01 89.33 207.49 132.28
Apr-09-09 nda 30.90 37.11 20.09
Apr-23-09 24.63 8.42 -65.80 nda
Apr-24-09 84.28 45.65 -45.84 nda
Apr-25-09 60.27 35.21 -41.57 76.78 43.14 -43.81
Apr-30-09 406.37 206.85 -49.10 635.50 207.90 -67.29
May-08-09 209.78 108.92 -48.08 245.18 100.92 -58.84
May-13-09 50.61 70.47 39.24 85.60 61.91 -27.67
The results reveal variations of up to 217.9% between observed and estimated values of sediment yield to B1. This watershed still involved two other events where the observed data was greatly overestimated (February 4 and March 17, 2009). It was also noted that
the smaller the event in relation to sediment yield, the more inaccurate the estimates are, especially for sediment
yield of less than 60 kg ha-1. It is believed that the effect
of the treatment applied to B1 is the source of the greater variation between the estimates, resulting in the changes in the sediment load response, making this type of precise quantification about the observed values more difficult. By the percent deviations of the B2 sediment yield, there is also a high degree of variation, the greatest of which was on January 30, which can observed a 182.3% overestimate of the observed values.
detailed study on the connectivity between them and on the primary variables that affect the processes. This may be a problem in semiarid regions due to the climatic uncertainties associated with the significant temporal and spatial variability of the characteristics of precipitation
(RODRIGUESet al., 2008) that act directly on the sediment
yield process. These results also raise the alarm towards generalizations about sedimentological characteristics in semiarid regions, that even though they are specialized basins in the same environment, the conditions of soil usage may result in sedimentological differentiations, making it more difficult to extrapolate the results.
CONCLUSION
1. The results of this investigation show that the
sedimentological modifications from human actions on watershed B1 had a greater effect on the first events. The growth of the herbaceous vegetal covering after the treatment reduced the quantity of sediments load at the end of the period. This fact highlights the need for specific investigative studies about the power of erosive control on herbaceous and arboreal growth in semiarid regions; 2. The rate of soil losses in both land use did not exceed
the allowable limits;
3. It is also noticed that the magnitude of previous events affected the sediment deposit in the drainage network, contributing to an increase in the sediments yield in subsequent events.
REFERENCES
AGUIAR, M. I. et al. Perdas de solo, água e nutrientes em sistemas agroflorestais no município de Sobral, CE. Revista Ciência Agronômica, v. 37, n. 3, p. 270-278, 2006.
ALBUQUERQUE, A. W. et al. Determinação de fatores da equação universal de perda de solo em Sumé, PB.Revista Brasileira de Engenharia Agrícola e Ambiental, v. 9, n. 2,
p. 153-160, 2005.
ALBUQUERQUE, A. W. et al. Manejo da cobertura do solo e de práticas conservacionistas nas perdas de solo e água em Sumé, PB. Revista Brasileira de Engenharia Agrícola e Ambiental, v. 6, n. 1, p. 136-141, 2002.
ALVES, N. N. L. Caracterização de micro-bacia hidrográfica experimental no semi-árido brasileiro como suporte a estudos da degradação. 2008. 77 f. Dissertação (Mestrado em Irrigação e Drenagem) - Universidade Federal do Ceará, Fortaleza, 2008.
AMERICAN PUBLIC HEALTH ASSOCIATION.Standard methods for the examination of water and wastewater.20. ed. Washington, DC: American Public Health Association, 1998. 1220 p.
ARAÚJO FILHO,et al. Pastoreio misto em caatinga manipulada no Sertão Cearense.Revista Cientifica de Produção Animal, v.4, n.1-2, p.9-21, 2002.
BARTLEY, R. et al. Runoff and erosion from Australian’s tropical semi-arid rangelands: influence of ground cover for differing space and time scale.Hydrological Processes, v. 20, n. 15, p. 3317-3333, 2006.
BERTOL, I. et al. Parâmetros relacionados com a erosão hídrica sob taxa constante da enxurrada, em diferentes métodos de preparo do solo.Revista Brasileira de Ciências do Solo, v. 30, n. 4, p. 715-722, 2006.
CANTÓN, Y. et al. Hydrological and erosion response of a badland system in semiarid SE Spain.Journal of Hydrology,
v. 252, n. 1, p. 65-84, 2001.
EMPRESA BRASILEIRA DE PESQUISA AGROPECUÁRIA).
Sistema brasileiro de classificação de solos. Brasilia: EMBRAPA-CNPS, 2006. 306 p.
FOOD AND AGRICULTURE ORGANISATION.Soil Erosion by Water: Some measures for its Control on Cultivated Lands. Rome: FAO, 1965. 299 p.
FRYIRS, K. A. et al. Buffers, barriers and blankets: The (dis)connectivity of catchment-scale sediment cascades.
Catena, v. 70, n. 1, p. 49-67, 2007.
GAISER, T. et al. Global Change and Regional Impacts
Berlin: Springer Verlag, 2003. 428 p.
GARCIA-RUIZ, J. M.et al. Flood generation and sediment transport in experimental catchments affected by land use changes in the central Pyrenees.Journal of Hydrology, v. 274, p. 30-46, 2008. GARFUR, A. et al. Runoff and losses of soil and nutrients from small watersheds under shifting cultivation (Jhum) in the Chittagong Hill Tracts of Bangladesh. Journal of Hydrology, v. 274, n. 1/4, p. 30-46, 2003.
HOROWITZ, A. J. An evaluation of sediment rating curves for estimating suspended sediment concentrations for subsequent flux calculations.Hydrological Processes, v. 17, n. 17, p. 3389-3409, 2003.
MAMEDE, J. L Reservoir Sedimentation in Dryland Catchments: Modelling and Management. Potsdam. 2008. 120 f. Tese (Doutorado em Hidrologia) - Instituto de Geocologia da Universidade de Potsdam, Potsdam, 2008.
MEDEIROS, P. H. A. et al. Modelling spatio-temporal patterns of sediment yield and connectivity in a semi-arid catchment with the WASA-SED model. Hydrological Sciences Journal, v. 55, n. 4, p. 636-648, 2010.
SANTOS, J. C. N.et al. Runoff and soil and nutrient losses in semiarid uncultivated fields.Revista Ciência Agronômica,
v. 42, n. 3, p. 813-820, 2011.
SOUGNEZ, N.; VAN WESEMAEL, B.; VANACKER, V. Low erosion rates measured for steep, sparsely vegetated catchments in southeast Spain. Catena, v. 84, n. 1/2, p. 1-11, 2010.
THOMAZ, E. L. The influence of traditional steep land agricultural practices on runoff and soil loss. Agricultural, Ecosystem and environment, v. 130, p. 23-30, 2009.
WISCHMEIER, W. H.; SMITH, D. D. Predicting rainfall erosion losses:A guide to conservation planning. Washington: