A
r
ti
c
le
0103 - 5053 $6.00+0.00
*e-mail: [email protected]
Mercury Accumulation in Sediments along an Eutrophication Gradient in
Guanabara Bay, Southeast Brazil
Wilson Machado,*,a Ricardo E. Santelli,a Daniel D. Loureiro,b Eliane P. Oliveira,a
Anderson C. Borges,b Viviane K. Maa and Luiz D. Lacerdaa,c
aDepartamento de Geoquímica, Universidade Federal Fluminense, 24020-150 Niterói-RJ, Brazil
bPrograma de Pós-Graduação em Geoquímica, Universidade Federal Fluminense,
24020-150 Niterói-RJ, Brazil
cInstituto de Ciências do Mar, Universidade Federal do Ceará, 60185-081 Fortaleza-CE, Brazil
A acumulação de Hg foi investigada em testemunhos sedimentares da Baía de Guanabara, Rio de Janeiro, Brasil, amostrados ao longo de um gradiente de eutrofização, que se refletiu na qualidade física dos sedimentos e na distribuição de carbono orgânico total (COT). Sedimentos da área oeste da baía foram fortemente afetados por aportes de efluentes domésticos e industriais, apresentando concentrações de Hg de até 7500 ng g-1 e inventários de Hg de até
786 mg m-2, em contraste com valores próximos aos de background encontrados na área nordeste
(≤ 65 ng g-1 e 10,6 mg m-2). Uma mudança de uma relação negativa para uma positiva entre Hg
e COT ocorreu no estuário mais eutrofizado, no qual um aumento nos níveis de Hg no sentido do topo foi observado. Este aumento pode ser atribuído a (i) um crescente aporte fluvial de Hg e (ii) um impacto da eutrofização sobre a qualidade dos sedimentos, que pode aumentar a sua capacidade de acumular Hg associado à matéria orgânica.
The accumulation of Hg was investigated in sediment cores from Guanabara Bay, Rio de Janeiro, Brazil, sampled along an eutrophication gradient, which was reflected in the sediment physical quality and total organic carbon (TOC) distribution. Sediments from the western bay area are strongly affected by inputs of urban and industrial effluents, showing Hg concentrations up to 7500 ng g-1 and Hg inventories up to 786 mg m-2, in contrast with near-background values
found in the northwestern bay area (≤ 65 ng g-1 and 10.6 mg m-2). A shift from a negative to a
positive relationship between Hg and TOC occurred in the most eutrophicated estuary, in which an upward increase in the recorded Hg levels was observed. This increase may be attributed to (i) an increasing riverine Hg input and (ii) an impact of eutrophication on the sediment quality, which may enhance the sediment capacity to accumulate organic matter-bound Hg.
Keywords: mercury, inventories, estuaries, contamination assessment
Introduction
There is much interest to elucidate the factors affecting the ability of coastal sediments to sequester or release Hg, due to the effects of these processes on the behavior of this metal of strong environmental concern in the coastal zone.1-3 Consequently, many studies dealing with the main pathways of Hg accumulation in coastal sediments have investigated the contributions of different contamination sources of this metal near the sediment-water interface.4-6
disturbances are shifting the overlaying water quality, as might be expected with the increasing input of urban and industrial effluents.
The present study investigated the recent evolution of Hg accumulation in sediments from contrasting environmental settings, evaluating the possible Hg associations with sediment composition, in Guanabara Bay (SE Brazil). It was hypothesized that with the different urban and industrial loadings between such settings the Hg associations with sediment constituents suffer substantial changes, reflecting spatial variabilities in the degree of estuarine water eutrophication.
Material and Methods
Study area and sediment sampling
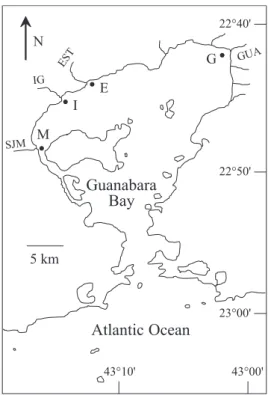
Guanabara Bay is a 384 km2 eutrophic waterbody that receives the discharge from a drainage basin affected by over 7.8 million inhabitants,13 in which trace metal contamination of sediments has been evidenced in the last decades.14-16 In June 2005, four sediment cores were collected at Guapimirim River (core G), Estrela River (core E), Iguaçu River (core I) and São João de Merití River (core M) estuaries, using acid-cleaned acrylic tubes (5-6 cm i.d.). In order to ensure that sampling did not disturb top layers, short sediment profiles (with nearly 30 cm depth) were sampled by hand driving. Sampling stations (Figure 1; Table 1) were distributed from the environments receiving the greater inputs of urban and industrial effluents (in the western part) to the less impacted, northeastern area of the bay, within the Environmental Protection Area of Guapimirim (EPAG),13,14,17 in which core G was sampled. In order to facilitate sampling, sediments were collected from shallow waters (Table 1).
Water quality data compilated by Kjerfve et al.13 showed that for the 1980–1993 period the mean nutrient (e.g., ammonium and phosphate) concentrations in Guanabara Bay waters increased from the EPAG to the estuary of São João de Merití River by 1–2 orders of magnitude, due to a greater sewage runoff and less efficient water renewal in the western margin. Carreira et al.18 demonstrated that the isotopic composition (δ13C and δ15N) of particulate matter collected in several rivers (including the Guapimirim, Iguaçu and São João de Merití) support the assumption that EPAG present the least sewage-impacted rivers, while Iguaçu and São João de Merití Rivers presented sewage-enriched particulate organic matter. Data from the environmental protection agency of Rio de Janeiro State (FEEMA) and Japan International Cooperation Agency (JICA) on the riverine organic loading to Guanabara Bayindicated relative riverine inputs in the
order Guapimirim < Estrela < São João de Merití < Iguaçu (Table 1), as evaluated by biochemical oxygen demands (BOD).19 The greater eutrophication in western estuaries is supported by field observations, with the darker, sulfidic waters of São João de Merití River estuary contrasting even with those from Iguaçu River estuary, although both rivers are eutrophic waterways.20,21
Mercury contamination in Guanabara Bay sediments is characterized by a large input from a chlor-alkali plant at the São João de Merití River drainage basin, which began in the 1950’s with the use of Hg amalgam and suffered a drastic decrease in the 1970’s due to a change to the Hg free membrane production process.22 Machado et al.23 reported
Figure 1. Location of the estuaries of Guapimirim River (GUA), Estrela
River (EST), Iguaçu River (IG) and São João de Merití River (SJM) in Guanabara Bay (SE Brazil), in which the sediment cores (G, E, I and M) were sampled.
Table 1. Location and depth of overlaying water of sampled sediment
cores and relative contributions from rivers discharging into each site of core sampling for the total riverine organic loading to Guanabara Bay
Core Latitude/longitude Overlaying water depth / (cm)
Riverine organic loading / (%) a
G 22º42.03′S,
43º02.46′W 52 3.8
E 22º43.93′S,
43º12.41′W 37 12.8
I 22º44.95′S,
43º14.46′W 35 24.4
M 22º48.12′S,
43º16.20′W 58 18.2
that a lower, but significant degree of contamination is expected for the Iguaçu River estuary, while Rebello et al.14 reported a low degree of contamination in sediments from EPAG and Estrela River estuaries.
Sediment analyses
Sediments were visually examined, subsampled in 0−2, 2−4, 4−6, 6−9, 9−12, 12−15, 15−20, and 20−25 cm depth intervals and frozen until analysis. Bulk sediment subsamples were dried (50 °C for 48 h) and ground for homogenization before chemical analyses. Total organic carbon (TOC) contents were determined on a Perkin Elmer CHN analyser, after carbonate removal by acidification. Total Hg concentrations were determined in duplicates, after the digestion of 1.0 g sediment subsamples in a 50% aqua regia solution (4H2O:3HCl:1HNO3) at 70 °C for 1 h,2 by cold vapor atomic absorption spectrometry. In the same extracts, Fe and Mn concentrations were determined by inductively coupled plasma atomic emission spectrometry. For these two metals, this is a partial digestion that should extract metals associated with carbonates, organic matter, sulfides, oxides and clay minerals. The precision of metal determinations (relative percent differences from duplicate analyses of all samples) was within 14%. Mercury determination accuracy was evaluated by a simultaneous analysis of a reference material (PACS-2, National Research Council of Canada). The results of reference material analysis (3.12 ± 0.12 µg g−1) differed by approximately 3% from the certified value (3.04 ± 0.20 µg g−1), and presented a precision of 4%, as indicated by the relative standard deviation of three replicates. The Hg detection limit (3σ of reagent blanks) was 8 ng g−1.
Contents of fine (silt and clay) particles were estimated after wet-sieving of other subsamples of fresh sediments
through a 63-µm mesh and drying. Water content and dry
density of sediments were estimated by weighing a known volume of sediments, before and after drying (50 °C for 48 h).
Mercury enrichment factors (Hg EF) and inventories of total Hg (IHgT), excess Hg (IHgxs), and background Hg (IHgBg) concentrations were estimated to evaluate the Hg degree of contamination and storage within sediments. The Hg EF was calculated by the ratio between Hg concentration in a sample and a background value estimated for the studied estuaries, while the Hg inventories for a core were the sums of Hg inventories within each depth interval, calculated as the product of (1) sediment dry density, (2) the depth interval thickness and (3) the Hg total concentration (to yield IHgT), or Hg background-subtracted concentration (to yield IHgxs), or Hg background concentration (to yield IHgBg). An enrichment
factor of the IHgT in relation to IHgBg was calculated as the ratio between these inventories (IHgT EF).
The adopted background value (43 ng g−1) was the mean of background levels found in deeper layers of sediment cores from the estuaries of São João de Merití River (50 ng g−1),24 Iguaçu River (35 ng g−1)23 and Guapimirim River (44 ng g−1, estimated as the mean concentration in the three deepest layers of core G). This estimate is within the Hg background range reported for sediments from other coastal areas in southeastern and southern Brazil (10–60 ng g−1).25-29
Results and Discussion
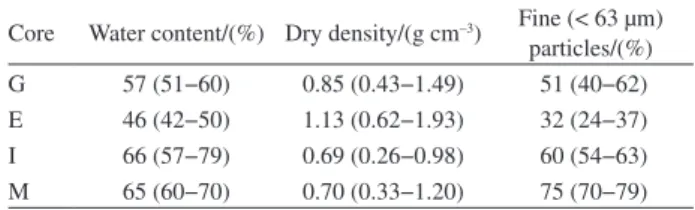
The sampled cores appear to reflect a gradient of anaerobic conditions accentuation (G < E < I < M) along the study area. Cores G and E presented brown hues (indicative of Fe hydroxides) in the upper 6 and 2 cm depth, respectively. Grey sediments (indicative of Fe sulfides) were found below such depths. The other cores showed only grey hues, with very dark grey, clayey sediments composing the upper 2 and 4 cm depth of cores I and M, respectively. An FeS accumulation in the upper 20 cm of sediments from the Iguaçu River estuary was previously indicated by elevated levels of acid-volatile sulfides (110–245 µmol g–1).30-31 Coarser sediments were observed in core E, while cores G and I presented intermediate contents of fine particles, and core M showed the greater contents of these particles (Table 2). These differences were reflected in the lower water content and greater density values of cores E and G (Table 2).
Cores I and M showed the greater TOC levels (Table 3), which was attributed to an elevated sewage loading in western bay area, while cores G and E data are influenced by autocthonous organic matter deposition and dissipation of sewage in the bay.18,32 A downward decrease was found in the upper layers of core I, while an upward increase was recorded in core M for TOC, which lack general vertical trends in cores G and E. Concentrations of Fe and Mn (Table 3) showed pronounced oscillations in core G, enrichments with increasing depth in core E, and inverse
Table 2. Main physical characteristics of sampled sediment cores
trends in surface layers of cores I (upward enrichment) and M (upward depletion).
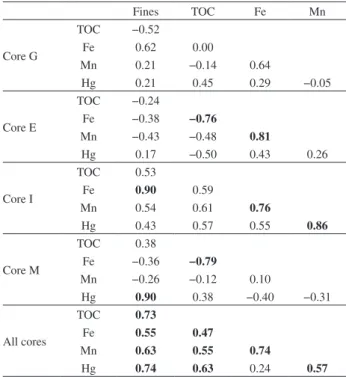
Few significant correlations were found between these variables in each core (Table 4). Cores E and M presented negative correlations between TOC and Fe, probably due to source differences between Fe and TOC, with the TOC input causing a dilution of Fe minerals. Cores E and I showed positive correlations between Fe and Mn, and fine sediment contents presented significant correlation with Fe in Core I. The correlations between Fe and Mn suggest a source similarity, if no post-depositional mobilization occurred. Contrasting remobilizations of Fe and Mn are well-known,9,33 which may contribute to explain the lack of correlation between these metals in cores G and M, and the depletions in the 4–6 cm depth interval of core G (since depletions were not found for other sediment characteristics). The lack of correlation between TOC
and Mn may be a result of the expected Mn behavior in anaerobic, sulfidic sediments, in which Mn oxides are depleted due to microbial respiration34 and in reaction with FeS.35 Fine sediment contents correlated with Fe, but uncorrelated with Mn, have been observed in other environments (e.g., Soto-Jiménez and Paéz-Osuna36), since fine particles are rich in Fe-bearing minerals37 and Mn may be more susceptible to diagenetic mobilization than Fe.38
Large variabilities in Hg concentrations occurred (Table 3), ranging from values close to background level (maximum Hg EF in core G = 1.5) to values 2 orders of magnitude above this level (maximum Hg EF in core M = 175). The IHgT followed the same trend of Hg concentration between cores (G < E < I < M), with IHgT EFs ranging in 3.5–90 for cores E, I and M (Table 5). Core G showed a IHgT only 10% above the IHgBg, a variation within the analytical uncertainty of Hg determination, indicating
Table 3. Concentration depth distribution of studied sedimentary contituents and mercury enrichment factors (Hg EF) in the sediment cores
Core Depth/(cm) TOC/(mg g−1) Fe/(mg g−1) Mn/(µg g−1) Hg/(ng g−1) Hg EF a
G
0−2 24.7 17.7 130 61 1.4
2−4 24.0 18.5 121 65 1.5
4−6 23.1 11.5 85 59 1.4
6−9 20.8 16.1 124 47 1.1
9−12 24.1 10.8 94 51 1.2
12−15 18.3 15.8 126 46 1.1
15−20 20.2 16.4 123 42 1.0
20−25 24.5 15.6 119 45 1.0
E
0−2 18.0 11.4 95 128 3.0
2−4 16.7 12.1 101 135 3.1
4−6 16.4 12.0 103 152 3.5
6−9 20.1 13.2 112 139 3.2
9−12 15.7 13.1 119 123 2.9
12−15 16.5 12.2 113 133 3.1
15−20 26.3 13.1 116 148 3.4
20−25 15.5 13.8 125 184 4.3
I
0−2 50.8 23.5 184 716 17
2−4 47.5 17.0 120 713 17
4−6 38.6 14.1 102 540 13
6−9 36.0 15.4 140 680 16
9−12 35.5 16.5 154 828 19
12−15 50.9 18.2 186 1142 27
15−20 44.2 18.7 184 1023 24
20−25 44.2 16.7 158 1123 26
M
0−2 84.1 13.6 110 7506 175
2−4 50.9 13.8 154 5012 117
4−6 46.8 15.7 179 3653 85
6−9 42.4 15.5 165 3315 77
9−12 41.6 16.3 146 2762 64
12−15 36.5 15.4 162 3236 75
15−20 27.7 16.0 162 3855 90
20−25 19.1 17.8 147 4096 95
no significant anthropogenic storage. Although EFs and inventories may be affected by spatial and temporal changes in sediment composition and diagenesis,23,39 the results suggest that the studied sediments may be Hg sinks in the western bay area.
Godoy et al.22 determined sedimentation rates in Guapimirim, Estrela and São João de Merití Rivers estuarine areas by 210Pb dating, which ranged in 0.86–2.2 cm yr−1 after the 1950s. Bidone et al.40 reported a sedimentation rate of 1.1 cm yr−1 for a 210Pb-dated sediment core from Iguaçu River estuary. Considering these rates, the studied sediments reflect a very recent evolution of Hg accumulation (Table 3), corresponding to the last 1–3 decades. The upward Hg concentration increase in core M indicates no recent environmental quality improvement, whereas the Hg concentration increase in the upper layers
of core G do not suggest a substantial environmental quality degradation. Cores E and I presented a slightly decreased Hg accumulation in surface layers, as may be expected due to contamination control policies,22,23 but a substantial degree of contamination is still observed in its top layers (Hg EF = 3 and 17, respectively). While a recent Hg concentration increase in core G may be a result of Hg dispersion from diffuse sources, the transport of the Hg stored within São João de Merití River catchment appears to have promoted a greater contamination in the last few years, considering a sedimentation rate of 2.2 cm yr–1.22 However, further research is necessary to evaluate the possible contribution of methylation to determine these Hg enrichments in upper layers of estuarine sediments.
Mercury presented significant correlations with fine particles in core M, and with Mn in Core I (Table 4), indicating that Hg distribution in such sediments may be partially explained by associations with fine particles and Mn compounds. Redox stratifications in upper layers of cores G and E probably produce variable Hg chemical associations with sediment phases, possibly causing a lack of general correlations trends. On the other hand, there was a shift from a upward Hg concentration decrease in layers below 9–12 cm depth to a tendency, above this layer, of upward concentration increase in core M (Table 3). This promoted a peculiar Hg relationship with TOC, which showed an inverse trend within layers below minimum concentration (at 9–12 cm depth), while the opposite was found above it, resulting in a no significant correlation between the whole Hg and TOC datasets. This shift in the Hg-TOC relationship may be explained by a coupling among recent changes in the Hg input and an accentuation in the sediment capacity to retain Hg due to a greater organic matter accumulation in upper layers (Table 3), since there are evidences that Hg is mainly (> 95%) bound to organic matter in surface sediments from São João de Merití River estuary.41
Carreira et al.18 reported that eutrophication influenced the TOC levels in three sediment cores from Guanabara Bay, although these cores represent areas less eutrophicated (consequently less enriched in TOC) than that of core M. Considering eutrophication as a main factor determining the TOC accumulation in core M, the change in the Hg-TOC relationship in this core seems to be associated with a recent increase in the impact of eutrophication on sediment quality.
Previous studies of sediments from the whole Guanabara Bay area have showed correlations of other trace metals (e.g., Cu, Cr, Ni and Pb) with simultaneously-extracted concentrations of Fe and/or Mn, as well as with the contents of fine particles and TOC. 17,42 It is interesting
Table 4. Spearman correlation coefficients for data from each sediment
core (n = 8) and pooled data of all cores (n = 32) a
Fines TOC Fe Mn
Core G
TOC −0.52
Fe 0.62 0.00
Mn 0.21 −0.14 0.64
Hg 0.21 0.45 0.29 −0.05
Core E
TOC −0.24
Fe −0.38 −0.76
Mn −0.43 −0.48 0.81
Hg 0.17 −0.50 0.43 0.26
Core I
TOC 0.53
Fe 0.90 0.59
Mn 0.54 0.61 0.76
Hg 0.43 0.57 0.55 0.86
Core M
TOC 0.38
Fe −0.36 −0.79
Mn −0.26 −0.12 0.10
Hg 0.90 0.38 −0.40 −0.31
All cores
TOC 0.73
Fe 0.55 0.47
Mn 0.63 0.55 0.74
Hg 0.74 0.63 0.24 0.57
a Significant values are in bold (α = 0.05).
Table 5. Inventories of background Hg (IHgBg), excess Hg (IHgxs) and
total Hg (IHgT) concentrations, and IHgT enrichment factors (IHgT EF) in the sediment cores
Core IHgBg/(mg m−2) IHg xs/(mg m
−2) IHg T/(mg m
−2) IHg T EF
a
G 10.6 1.05 11.6 1.10
E 13.6 34.5 48.1 3.5
I 8.2 169 177 22
M 8.8 777 786 90
a IHg
to note that, with the exception of Hg and Fe data, all pooled data from the studied estuaries presented significant positive correlations (Table 4), probably due to a concurrent influence of sediment grain size and TOC on the distribution of metals.
Conclusions
An evaluation of the recent Hg accumulation in Guanabara Bay estuarine sediments was carried out along an eutrophication gradient, indicated by data reported in previous studies and reflected in the sediment physical quality and TOC distributions. Within this gradient, near-background Hg concentrations were recorded in Guapimirim River estuary and slight attenuations in the degree of Hg contamination were found in the estuaries from Estrela and Iguaçu Rivers, while an upward Hg concentration increase occurred in the chlor-alkali plant-affected sediments from São João de Merití River estuary. In this later estuary, Hg concentrations as high as 7500 ng g−1 and Hg inventories as high as 786 mg m−2 (175 and 90 times above the estimated background values, respectively) were recorded, and a recent shift from a negative to a positive relationship between Hg and TOC was observed. This shift may be possibly explained by a coupling of an increased riverine Hg input and an enhanced sediment capacity to accumulate organic matter-bound Hg due to an incresing TOC input, as an impact of eutrophication.
Acknowledgments
The authors thank the financial support from Fundação Carlos Chagas Filho de Amparo à Pesquisa do Estado do Rio de Janeiro (FAPERJ) and Concelho Nacional de Desenvolvimento Científico e Tecnológico (CNPq). This study was partially supported by FAPERJ-PRONEX project No. E-26.171.175. The authors thank the critical comments from an anonymous referee.
References
1. Gagnon, C.; Pelletier, E.; Mucci A.; Mar. Chem. 1997, 59, 159.
2. Lacerda, L. D.; Gonçalves, G.O.; Mar. Chem. 2001, 76, 47. 3. Sunderland, E. M.; Gobas, F. A. P. C.; Heyes, A.; Branfireun, B.
A.; Bayer, A. K.; Cranston, R. E.; Parsons, M. B.; Mar. Chem.
2004, 90, 91.
4. Tomiyasu, T.; Nagano, A.; Yonehara, N.; Sakamoto, H.; Rifardi, H.; Oki, K.; Akagi, H.; Sci. Total Environ. 2000, 257, 121. 5. Mirlean, N.; Andrus, V. E.; Baisch, P.; Mar. Pollut. Bull. 2003,
46, 331.
6. Sanders, C. J.; Santos, I. R.; Silva-Filho, E.V.; Patchineelam, S.R.; Mar. Pollut. Bull. 2006, 52, 1085.
7. Marins, R. V.; Lacerda, L. D.; Paraquetti, H. H. M.; Paiva, E.C.; Villas Boas, R.C.; Bull. Environ. Contam. Toxicol. 1998, 61, 57. 8. Canário, J.; Vale, C.; Caetano, M.; Madureira, M.J.; Environ.
Pollut. 2003, 126, 425.
9. Marchand, C.; Lallier-Vergès, E.; Baltzer, F.; Albéric, P.; Cossa, D.; Baillif, P.; Mar. Chem. 2006, 98, 1.
10. Covelli, S.; Faganeli, J.; Horvat, M.; Brambati, A.; Appl. Geochem. 2001, 16, 541.
11. Piani, R.; Covelli, S.; Biester, H.; Appl. Geochem. 2005, 20, 1546.
12. Marins, R. V.; Lacerda, L. D.; Gonçalves, G. O.; Paiva, E. C.; Bull. Environ. Contam. Toxicol. 1997, 58, 733.
13. Kjerfve, B.; Ribeiro, C. H. A.; Dias, G. T. M.; Filippo, A. M.; Quaresma, V. S.; Cont. Shelf Res. 1997, 17, 1609.
14. Rebello, A. L.; Haekel, W.; Moreira, I.; Santelli, R.; Schroeder, F.; Mar. Chem. 1986, 18, 215.
15. Baptista Neto, J. A.; Smith, B. J.; McAllister, J. J.; Environ. Pollut. 2000, 109, 1.
16. Kehrig, H. A.; Pinto, F. N.; Moreira, I.; Malm, O.; Org. Geochem. 2003, 34, 661.
17. Perin, G.; Fabris, R.; Manente, S.; Rebello Wagener, A.; Hamacher, C.; Scotto, S.; Wat. Res. 1997, 12, 3017.
18. Carreira, R. S.; Wagener, A. L. R.; Readman, J. W.; Fileman, T. W.; Macko, S. A.; Veiga, A.; Mar. Chem. 2002, 79, 207. 19. Costa, H.; Uma avaliação da qualidade das águas costeiras do
Estado do Rio de Janeiro; Fundação de Estudos do Mar; Rio de Janeiro, 1998.
20. Souza, C. M. M.; Pestana, M. H. D.; Lacerda, L. D.; Sci. Total Environ. 1986, 58, 63.
21. Rego, V. S.; Pfeiffer, W. C.; Barcellos, C. C.; Rezende, C. E.; Malm, O.; Souza, C. M. M.; Environ. Technol. 1993, 14, 167. 22. Godoy, J. M.; Moreira, I.; Bragança, M. J.; Wanderley, C.;
Mendes, L. B.; J. Radioanal. Nucl. Chem. 1998, 227, 157. 23. Machado, W.; Moscatelli, M.; Rezende, L. G.; Lacerda, L. D.;
Environ. Pollut. 2002, 120, 455.
24. Wasserman, J.C.; Freitas-Pinto, A.A.P.; Amouroux, D.; Environ. Technol. 2000, 21, 297.
25. Cardoso, A. G. A.; Boaventura, G. R.; Silva Filho, E. V.; Brod, J. A.; J. Braz. Chem. Soc. 2001, 12, 767.
26. Marins, R. V.; Paula Filho, F. J.; Maia, S. R. R.; Lacerda, L. D.; Quim. Nova 2004, 27, 763.
27. Molisani, M. M.; Marins, R. V.; Machado, W.; Paraquetti, H. H. M.; Bidone, E. D.; Lacerda, L. D.; Reg. Environ. Change.
2004, 4, 17.
28. Abessa, D. M. S.; Carr, R. S.; Rachid, B. R. F.; Sousa, E. C. P. M.; Hortelani, M. A.; Sarkis, J. E.; Mar. Pollut. Bull. 2005, 50, 875.
30. Machado, W.; Carvalho, M. F.; Santelli, R. E.; Maddock, J. E. L.; Mar. Pollut. Bull. 2004, 49, 89.
31. Maddock, J. E. L.; Carvalho, M. F.; Santelli, R. E.; Machado, W.; Water Air Soil Pollut. 2007, 181, 193.
32. Carreira, R. S.; Wagener, A. L. R.; Readman, J. W.; Est. Coast Shelf Sci. 2004, 60, 587.
33. Zwolsman, J. J. G.; Berger, G. W.; Van Eck, G. T. M.; Mar. Chem. 1993, 44, 73.
34. Shaw, T. J.; Gieskes, J. M.; Jahnke, R.A.; Geochim. Cosmochim. Acta 1990, 54, 1233.
35. Aller, R. C. ; Rude, P. D.; Geochim. Cosmochim. Acta 1988, 52, 751.
36. Soto-Jiménez, M. F.; Páez-Osuna, F.; Est. Coast Shelf Sci. 2001, 53, 259.
37. Salomons, W.; Förstner, U.; Metals in the hydrocycle; Springer; New York, 1984.
38. Warnken, K. W.; Gill, G. A.; Griffin, L. L.; Santschi, P. H.; Mar. Chem. 2001, 73, 215.
39. Silva, L. F. F.; Machado, W.; Lisboa Filho, S. D.; Lacerda, L. D.; Water Air Soil Pollut. 2003, 145, 67.
40. Bidone, E. D.; Carvalho, M. F.; Godoy, J. M.; Cordeiro R. C.; Machado, W.; Fonseca, M. O.; Santelli, R. E.; Proceedings of the 4th International Symposium Environmental Geochemistry
in Tropical Countries, Buzios, Brazil, 2004, 421.
41. Barrocas, P. R. G.; Wasserman, J. C. In Environmental geochemistry in the tropics; Wasserman, J. C.; Silva-Filho, E. V.; Villas-Boas, R., Eds.; Springer-Verlag; Heidelberg, 1998, p. 171.
42. Baptista Neto, J. A.; Gingele, F. X.; Leipe, T.; Brehme, I.; Environ. Geol. 2006, 49, 1051.
Received: April 20, 2007