Class A pan coefficients (Kp)
Class A pan coefficients (Kp)
Class A pan coefficients (Kp)
Class A pan coefficients (Kp)
Class A pan coefficients (Kp)
ttttto estimate daily r
o estimate daily r
o estimate daily r
o estimate daily r
o estimate daily refer
efer
efer
efer
eference e
ence e
ence e
ence ev
ence e
v
vapotr
v
v
apotr
apotr
apotranspir
apotr
anspir
anspir
anspiration (ET
anspir
ation (ET
ation (ET
ation (ETo)
ation (ET
o)
o)
o)
o)
Revista Brasileira de Engenharia Agrícola e Ambiental, v.7, n.1, p.111-115, 2003 Campina Grande, PB, DEAg/UFCG - http://www.agriambi.com.br
Paulo C. Sentelhas1 & Marcos V. Folegatti2
1 ESALQ/USP - Setor de Agrometeorologia, Departamento de Ciências Exatas. CP 9, CEP 13418-900, Piracicaba, SP.
Fone: (19) 3429-4283. E-mail: [email protected] (Foto)
2 ESALQ/USP. CP 9, CEP 13418-900, Piracicaba, SP. Fone: (19) 3429-4217. E-mail: [email protected]
Abstr Abstr Abstr Abstr
Abstract: act: act: act: act: The Class A pan coefficient (Kp) has been used to convert pan evaporation (ECA) to grass-reference evapotranspiration (ETo), an important component in water management of irrigated crops. There are several methods to determine Kp values, using wind speed, relative humidity and fetch length and conditions. This paper analyses the following methods to estimate Kp values: Doorenbos & Pruitt (1977); Cuenca (1989); Snyder (1992); Pereira et al. (1995); Raghuwanshi & Wallender (1998); and FAO/56 (Allen et al., 1998). The estimated and the observed values of Kp, obtained from the relationship between ETo measured in a weighing lysimeter and ECA measured in a Class A pan, were compared by regression analysis. The same routine was adopted to evaluate ETo estimates with different Kp values. The results showed that all methods to estimate Kp did not predict it well, with low correlation (R2 < 0.2), which resulted in estimates of ETo with high
dispersion (R2 < 0.8). The best Kp methods to estimate ETo were Pereira et al. (1995) and Cuenca
(1989), both presenting high efficiency. The use of an arbitrary and constant Kp (0.71) to estimate ETo, produced the same precision and accuracy as the estimates of Kp based on Pereira and Cuenca methods. This fixed value is a practical and simple option to convert ECA into ETo, but this value must be calibrated for each place under different climatic conditions.
K K K K
Keeeey wey wy wory wy worororordsdsdsdsds: pan coefficient, irrigation scheduling, weighing lysimeter
Coeficientes do T
Coeficientes do T
Coeficientes do T
Coeficientes do T
Coeficientes do Tanque Classe A (Kp) par
anque Classe A (Kp) par
anque Classe A (Kp) par
anque Classe A (Kp) par
anque Classe A (Kp) para a
a a
a a
a a estimativ
a a
estimativ
estimativ
estimativ
estimativa
a
a
a
a
diária da e
diária da e
diária da e
diária da e
diária da ev
v
v
v
vapotr
apotr
apotr
apotranspir
apotr
anspir
anspir
anspiração de r
anspir
ação de r
ação de r
ação de r
ação de referência (ET
eferência (ET
eferência (ET
eferência (ET
eferência (ETo)
o)
o)
o)
o)
Resumo: Resumo: Resumo: Resumo:
Resumo: O coeficiente do tanque classe A (Kp) tem sido empregado para se estimar a evapotranspiração de referência (ETo), importante componente no manejo de água de culturas irrigadas, a partir da evaporação do tanque Classe A (ECA). Existem diversos métodos para se determinar os valores de Kp, cuja maioria é baseada nas informações de velocidade do vento, umidade relativa e extensão e condições da área de bordadura, ao redor do tanque. Neste trabalho foram analisados os seguintes métodos de estimativa do Kp: Doorenbos & Pruitt (1977), Cuenca (1989), Snyder (1992) e Pereira et al. (1995); Raghuwanshi & Wallender (1998) e FAO/56 (Allen et al., 1998). Os valores de Kp, estimados e calculados pela relação entre a ETo medida em lisímetro de pesagem e a ECA, foram comparados por meio de análise de regressão. O mesmo procedimento foi utilizado para se avaliar o desempenho dos diferentes métodos de determinação do Kp na estimativa da ETo, a partir da ECA, cujos resultados mostraram que a concordância entre os valores de Kp calculados e estimados pelos diferentes métodos, foi pequena (R2 < 0,2),
o que resultou em estimativas de ETo com alta dispersão (R2 < 0,8). Os melhores métodos de
determinação do Kp, para a estimativa da ETo, foram os de Pereira et al. (1995) e Cuenca (1989), ambos apresentando alta eficiência. O uso de um Kp arbitrário e constante (0,71) na estimativa da ETo resultou na mesma precisão e exatidão das estimativas feitas com os valores de Kp determinados pelos métodos de Pereira e de Cuenca. O uso de um valor constante de Kp é uma opção simples e prática para se estimar ETo a partir da ECA, porém este valor necessita ser calibrado para cada local, sob diferentes condições climáticas.
P P P P
Palaalaalaalaalavrvrvrvrvras-chaas-chavas-chaas-chaas-chavvvveeeee: coeficiente do tanque, manejo da irrigação, lisímetro de pesagem
Month T (oC)
RH (%)
U (m s-1)
n (h d-1)
SR (MJ m-2 d-1)
R (mm)
Dec 95 24.5 77.7 1.9 6.7 18.1 222.2
Jan 96 25.7 81.0 1.4 6.6 18.3 314.8
Feb 96 26.0 84.0 1.5 6.2 17.5 258.3
Mar 96 24.9 85.0 1.5 6.4 16.0 146.5
Apr 96 23.1 78.4 1.6 8.0 15.0 12.0
May 96 19.5 80.0 1.6 6.8 12.6 36.3
Jun 96 18.3 76.2 1.6 7.3 11.7 23.3
Jul 96 17.3 74.7 1.7 7.7 12.6 2.3
Aug 96 19.9 68.2 1.8 8.5 15.6 23.7
Sep 96 20.9 76.0 1.9 6.3 15.0 135.2
Oct 96 23.1 79.6 1.8 6.9 17.1 238.5
Nov 96 23.4 79.5 2.0 6.2 17.0 212.0
Dec 96 25.2 84.8 1.5 6.0 17.2 188.3
INTRODUCTION
Reference evapotranspiration (ETo) is an essential component for use in water supply planning and irrigation scheduling (Snyder, 1992) since the crop evapotranspiration (ETc) is estimated by ETo multiplied by the crop coefficient (Kc). One common method to estimate ETo is converting the class A pan evaporation (ECA) into ETo by using a pan coefficient (Kp), which varies depending on the site and the weather conditions as showed by Doorenbos & Pruitt (1977) and Allen et al. (1998).
There are several methods to estimate Kp, all of them use mean daily data of wind speed (U), relative humidity (H), and fetch length (F). Doorenbos & Pruitt (1977) reported a table with Kp values ranging from 0.40 to 0.85, depending on these variables and the ground cover type surrounding the pan.
However, with modern automatic weather stations and computer facilities, it is convenient to automate ECA to ETo conversions using equations (Snyder, 1992). In order to solve this problem, Cuenca (1989) suggested a polynomial equation to predict Kp values from U, H, and F. According to Snyder (1992) the equation proposed by Cuenca is complex, and in some cases the output is quite different from the original data found in Doorenbos & Pruitt’s table (Doorenbos & Pruitt, 1977). Then, Snyder (1992) presented another equation to predict Kp using the same variables in a multiple linear regression. Subsequently, Pereira et al. (1995) proposed a model for the Kp which was based on the relationship between ETo and ECA, both estimated by Penman-Monteith equation, adopting a maximum Kp value equal to 0.85. After that, Raghuwanshi & Wallender (1998) suggested a new equation to estimate Kp using categorical (Yes = 1; No = 0) and quantitative variables based on U, H, and F. The predicted Kp obtained by the authors showed better fit than Cuenca’s or Snyder’s equations in relation to the data from Doorenbos & Pruitt’s table.
In the FAO/56 Bulletin, Allen et al. (1998) presented another regression equation derived from Doorenbos & Pruitt’s table, but they mentioned that the use of that equation may not be sufficient to consider all local environmental factors influencing Kp and that local adjustment may be required, making an
appropriate calibration of ECA against ETo measured by a lysimeter or computed with the Penman-Monteith method, as presented by Conceição (2002).
Although there are several methods to estimate Kp, few are the papers that evaluated their precision and accuracy under Brazilian climatic conditions. Most of the methods have shown that Kp value is highly dependent on surrounding conditions and is determined by U, H and F. According to Pereira et al. (1995), fetch distance (F) is extremely difficult to estimate as it varies continuously as the field dries down, and only a guess can be given for any given day. The same authors considered another problem with the application of the Doorenbos & Pruitt’s table: the first class of the daily wind speed, which is
up to 175 km d-1, is too high for most of the Brazilian tropical
climates. According to Villa Nova et al. (1996) determination of Kp is the greatest problem in converting ECA into ETo and from this to crop evapotranspiration (ETc).
Based on the above discussion, the objective of this paper was to evaluate different methods used to predict Kp values and their influence on the daily estimates of ETo. In addition, we tested a constant value of Kp as a simple and practical option to convert ECA into ETo.
MATERIAL AND METHODS
In order to evaluate the different methods used to predict Kp values, data consisting of temperature (T), relative humidity (H), and wind speed at 2 m (U), from an automatic weather station located at ESALQ, University of São Paulo, Piracicaba,
SP, Brazil (latitude: 22o42’ S; longitude: 47o38’ W; altitude: 546
m) were used (Table 1). Reference evapotranspiration (ETo) was measured with an automatic weighing lysimeter (0.65 m
depth; 1.20 m length; 0.85 m width) covered with Paspalum
notatum L. The grass was clipped whenever necessary to keep its height between 0.08 and 0.15 m, as suggested by FAO (Smith, 1991) to obtain the proper ETo, during 112 days from December 1995 to December 1996. On the other days there were opera-tional difficulties with this kind of lysimeter because of high intensity rainfall and wind which resulted in uncertainties and errors as described by Pereira et al. (2002). Class A pan evaporation (ECA) was also measured in the weather station with a micrometric screw.
The values of Kp were calculated by the relationship between ETo, from the lysimeter, and ECA, and estimated from the following methods:
a) Doorenbos and Pruitt’s Table (Doorenbos & Pruitt, 1977)
b) Cuenca (1989)
Kp = 0.475 - 2.4 x 10⁻⁴U + 5.16 x 10⁻³H + 1.18 x 10⁻³F
- 1.6 x 10⁻⁵H 2 - 1.01 x 10⁻⁶F 2 - 8.0 x 10⁻⁹H 2U
- 1.0 x 10⁻⁸H 2F
where U = mean daily wind speed at 2 m height in km d-1; H =
mean daily relative humidity in percentage; and F = upwind fetch of low-growing vegetation, equal to 20 m in this study.
T - mean air temperature; H - mean relative humidity; U - mean wind speed at 2 m above the surface; n - effective hours of sunshine; SR - incoming solar radiation; R - rainfall
Table 1. Monthly climatic conditions during the experimental period, in Piracicaba, state of São Paulo, Brazil, from December 1995 to December 1996
c) Snyder (1992)
Kp = 0.482 + 0.024 ln(F) - 0.000376U + 0.0045H
d) Pereira et al. (1995)
Kp = 0.85 (s + γ) / [s + γ (1 + rc/ra)]
where s = the slope of the vapour pressure curve at the daily
average air temperature; γ = the psychrometric coefficient; and
rc/ra = the relationship between the grass canopy resistance to
the water vapour diffusion (rc) and the resistance offered by
the air layer to exchange water vapour from the evaporating
surface (ra) given by an empiric relation with the wind speed,
suggested by Allen et al. (1989) and adopted by FAO (Smith, 1991; Allen et al., 1998):
rc/ra = 0.34U
e) Raghuwanshi & Wallender (1998)
Kp = 0.5944 + 0.024X1 - 0.0583X2 - 0.1333X3
- 0.2083X4 + 0.0812X5 + 0.1344X6
where X1 = ln of the fetch distance (F) in m; X2, X3, and X4 =
wind speed categories of 175-425, 425-700, and >700 km d-1,
respectively, and were assigned values of one or zero depending upon their occurrence (a zero value for these variables
represented a wind speed < 175 km d-1); X
3 and X4 = relative
humidity categories of 40-70% and >70%, respectively (a zero value for these variables represent a relative humidity < 40%).
f) FAO/56 (Allen et al., 1998)
Kp = 0.108 0.0286U + 0.0422 ln (F) + 0.1434 ln (H)
- 0.000631 [ln (F)]2 ln (H)
g) Constant Kp: this value was determined for Piracicaba, SP, Brazil, by the relationship between ETo and ECA with data from December 1995 to December 1996, during 112 days, and tested with independent data obtained in the same conditions described above, from January 1997 to October 1997, during 123 days.
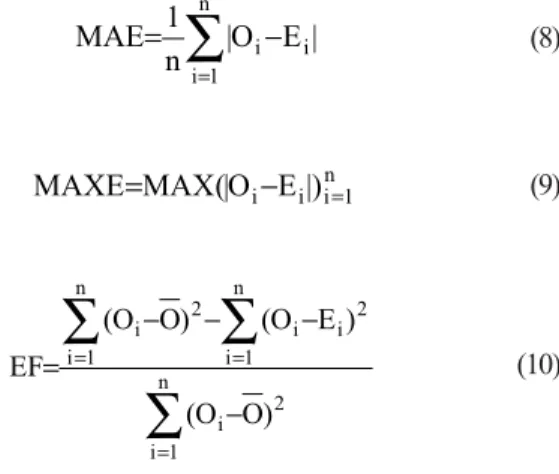
To evaluate the performance of the Kp methods in daily ETo estimates, using the Class A pan method (ETo = ECA . Kp), several performance criteria were used including regression analysis, agreement index (D), mean absolute error (MAE), maximum absolute error (MAXE), and efficiency (EF), as suggested by Willmott et al. (1985) and Zacharias et al. (1996). These criteria are defined as:
∑
∑
= = − + − − − = n 1 i 2 i i n 1 i 2 i i ) | O O | | O E | ( ) E O ( 1 D∑
= − = n 1 i i i E|O | n 1 MAE n 1 i i i E|)
O | ( MAX
MAXE= − =
∑
∑
∑
= = = − − − − = n 1 i 2 i n 1 i 2 i i n 1 i 2 i ) O O ( ) E O ( ) O O ( EFwhere Oi = observed value; Ei = estimated value; and O = mean
observed values.
RESULTS AND DISCUSSION
Figure 1 shows the relationship between Kp estimated by Doorenbos & Pruit’s table and the Eqs. 1, 2, 3, 5, and 6 and the calculated values (Kp = ETo/ECA). It can be seen that Kp predicted by all methods remained between 0.6 and 0.9 while the calculated values varied from 0.4 to 1.0. In general, all methods did not predict Kp values very well, with low
correlation (R2 < 0.2). Pereira et al. (1995) found similar results
evaluating their method (Eq. 3). This performance is explained, in part by the fact that most of these methods were developed based on the values presented by Doorenbos & Pruitt (1977). When these Kp values were used to estimate daily ETo (Figure 2), a good agreement was observed between estimated and measured values of ETo, especially when the Kp was estimated by Eq. 1 and Eq. 3. ETo estimated with Kp from Doorenbos & Pruit’s table and Eqs. 2, 5 and 6 presented, in general, an overestimation between 4 and 12%. However, the
R2 values, which indicate the precision of the estimates, varied
between 0.69 and 0.77, which is a consequence of the poor accuracy and precision of the Kp methods. Similar results were found by Conceição (2002) when studying monthly ETo estimated by Class A and Penman-Monteith methods.
Table 2 presents the statistical analysis of ETo estimates using different Kp methods. The best Kp equations to convert ECA into ETo were Eq. 3, and Eq. 1. With these methods, the relationship between measured and estimated ETo showed high accuracy and good precision: Pereira’s method (b = 0.9926,
D = 0.937, R2 = 0.7647 and EF = 0.756); Cuenca’s method
(b = 1.014, D = 0.927, R2 = 0.7219 and EF = 0.723). The other
methods presented a bad performance, mainly when ECA was converted in ETo by the use of Kp obtained from Doorenbos & Pruitt’s table and Snyder’s equation (Eq.2). In these cases, the relationship between measured and estimated ETo showed an overestimation of 7 and 12%, respectively, and low efficiency (EF < 0.6).
-y = 0.7319x + 0.1533 R2
= 0.1732
0.0 0.2 0.4 0.6 0.8 1.0
A
A. B.
y = 1.4979x - 0.3788 R2 = 0.1843
B
C.
D.
y = 0.9281x - 0.0327 R2 = 0.1779
C
y = 1.0837x - 0.0511 R2 = 0.1677
0.0 0.2 0.4 0.6 0.8 1.0
0.0 0.2 0.4 0.6 0.8 1.0
D
E. F.
y = 1.0097x - 0.0403 R2 = 0.1527
0.0 0.2 0.4 0.6 0.8 1.0
E
y = 1.7602x - 0.6224
R2
= 0.1998
0.0 0.2 0.4 0.6 0.8 1.0
F
Kp Kp
Kp = ET
o/ECA
Kp = ET
o/ECA
Figure 1. Relationship between daily measured Kp values and those estimated using the following methods: (A) Doorenbos and Pruitt table, (B) Cuenca - Eq. (1), (C) Snyder - Eq. (2), (D) Raghuwanshi & Wallender - Eq. (5), (E) Pereira - Eq. (3), (F) FAO/56 - Eq. (6), in Piracicaba, SP, Brazil
y = 1.0717x R2
= 0.6955
0.0 2.0 4.0 6.0 8.0 10.0
A) D oorenbos & P ruitt
E
T
o (mm d
-1) Estimated
y = 1.0141x R2
= 0.7219
B ) C uenc a
y = 1.1197x
R2
= 0.6998
C ) S nyder
y = 1.0421x
R2
= 0.7129
0.0 2.0 4.0 6.0 8.0 10.0
0.0 2.0 4.0 6.0 8.0 10.0
D) Raghuw anshi & W allander
y = 0.9926x
R2
= 0.7647
0.0 2.0 4.0 6.0 8.0 10.0
E) Pereira
y = 1.0547x R2
= 0.731
0.0 2.0 4.0 6.0 8.0 10.0
F) FAO /56
ETo (mm d-1) Lysimeter ETo (mm d-1) Lysimeter
Figure 2. Relationship between daily measured ETo and ETo estimated using Kp determined by: (A) Doorenbos & Pruitt table, (B) Cuenca - Eq. (1), (C) Snyder - Eq. (2), (D) Raghuwanshi & Wallender - Eq. (5), (E) Pereira - Eq. (3), (F) FAO/56 - Eq. (6), in Piracicaba, SP, Brazil
Kp
A. Doorenbos & Pruitt B. Cuenca C. Snyder
D. Raghuwanshi & Wallander E. Pereira F. FAO/56
E
T
o (mm d
-1) Estimated
ETo (mm d-1) Lysimeter
Pereira’s and Cuenca’s methods was obtained. This is proved by the analysis with independent data (Figure 4 and Table 2) where the accuracy (b = 0.9837 and D = 0.927) and precision
(R2 = 0.7309 and EF = 0.716) of the estimates were very similar
to those obtained with the Kp determined by the Pereira’s and
Table 2. Statistical analysis* for the comparison between
measured and estimated daily reference evapotranspiration, using different methods to determine Kp values
* D - agreement index; MAE - mean absolute error; MAXE - maximum absolute error; EF - efficiency
D MAE MAXE EF
Kp Method
(mm d-1)
Doorenbos &Pruitt 0.898 0.521 2.39 0.585
Cuenca 0.927 0.444 2.21 0.723
Snyder 0.868 0.640 2.81 0.411
Raghuwanshi & Wallender 0.917 0.459 2.33 0.676
Pereira 0.937 0.426 1.67 0.756
FAO/56 0.916 0.476 2.41 0.659
Kp = 0.71 0.927 0.453 2.07 0.716
y = 0.71x R2 = 0.72
0.0 2.0 4.0 6.0 8.0 10.0
0.0 2.0 4.0 6.0 8.0 10.0
ET
o (mm d
-1)
ECA (mm d-1)
Figure 3. Relationship between daily measured ETo and ECA, in Piracicaba, SP, Brazil
y = 0.9837x R2 = 0.7309
0.0 2.0 4.0 6.0 8.0 10.0
0.0 2.0 4.0 6.0 8.0 10.0
ET
o (mm d
-1) - Estimated
ETo (mm d-1) - Lysimeter
Figure 4. Relationship between measured and estimated (0.71ECA) daily ETo, using independent data, in Piracicaba, SP, Brazil
2. The best ETo estimates were obtained when Kp values obtained by the Pereira’s and Cuenca’s methods were used.
3. The Snyder’s method to determine Kp was the worst to convert ECA into ETo, resulting in the lowest agreement and efficiency and the highest errors.
4. The use of a constant value of Kp showed to be a simple and practical option to convert ECA into ETo, however, this value must be calibrated and tested for different climatic conditions.
LITERATURE CITED
Allen, R.G.; Jensen, M.E.; Wright, J.; Burman, R.D. Operational estimates of reference evapotranspiration. Agronomy Journal, Madison, v.81, p.650-662. 1989.
Allen, R.G.; Pereira, L.S.; Raes, D.; Smith, M. Crop evapotranspiration: guidelines for computing crop water requirements. Rome: FAO, 1998. 301p. Irrigation and Drainage Paper, 56
Conceição, M.A.F. Reference evapotranspiration based on Class A pan evaporation. Scientia Agricola, Piracicaba, v.59, n.3, p.417-420, 2002.
Cuenca, R.H. Irrigation system design: an engineering approach. New Jersey: Prentice-Hall, Englewood Cliffs. 1989. 133p. Doorenbos, J.; Pruitt, W.O. Crop water requeriments. Rome:
FAO, 1977. 179p. Irrigation and Drainage Paper, 24
Pereira, A.R.; Santiago, A.V.; Maggiotto, S.R.; Folegatti, M.V. Problemas operacionais com lisímetro de pesagem durante a estação chuvosa e em dias secos com rajadas de vento. Revista Brasileira de Agrometeorologia, Santa Maria, v.10, n.1, p.51-56, 2002.
Pereira, A.R.; Villa Nova, N.A.; Pereira, A.S.; Barbieri, V. A model for the class A pan coefficient. Agricultural and Forest Meteorology, Amsterdam, v.76, p.75-82, 1995.
Raghuwanshi, N.S.; Wallender, W.W. Converting from pan evapo-ration to evapotranspievapo-ration. Journal of Irrigation and Drainage Engeneering of ASCE, New York, v.124, n.5, p.275-277, 1998. Smith, M. Report on expert consultation on procedures for revision of FAO methodologies for crop water requirements. Rome: FAO. 1991. 45p.
Snyder, R.L. Equation for evaporation pan to evapotranspiration conversion. Journal of Irrigation and Drainage Engeneering of ASCE, New York, v.118, n.6, p.977-980, 1992.
Villa Nova, N.A.; Pereira, A.R.; Barbieri, V. Evapotranspiration as a function of leaf area index and class A pan evaporation. Revista Brasileira de Agrometeorologia, Santa Maria, v.4, n.2, p.35-37, 1996.
Willmott, C.J.; Ackleson, S.G.; Davis, R.E.; Feddema, J.J.; Klink, K.M.; Legates, D.R.; O’Donnell, J.; Rowe, C.M. Statistics for the evaluation and comparison of models. Journal of Geophysical Research, Ottawa, v.90, n.C5, p.8995-9005, 1985. Zacharias, S.; Heatwole, C.D.; Coakley, C.W. Robust quantitative techniques for validating pesticide transport models. Transac-tions of the ASAE, St. Joseph, v.39, n.1, p.47-54, 1996.