ESTIMATION OF SOIL MOISTURE IN THE ROOT-ZONE FROM
REMOTE SENSING DATA
(1)Bergson Guedes Bezerra(2), Carlos Antonio Costa dos Santos(3), Bernardo Barbosa da Silva(4), Aldrin Martin Perez-Marin(5), Marcus Vinícius Cândido Bezerra(6), José Renato
Cortez Bezerra(7) & Tantravahi Venkata Ramana Rao(6)
SUMMARY
Field-based soil moisture measurements are cumbersome. Thus, remote sensing techniques are needed because allows field and landscape-scale mapping of soil moisture depth-averaged through the root zone of existing vegetation. The objective of the study was to evaluate the accuracy of an empirical relationship to calculate soil moisture from remote sensing data of irrigated soils of the Apodi Plateau, in the Brazilian semiarid region. The empirical relationship had previously been tested for irrigated soils in Mexico, Egypt, and Pakistan, with promising results. In this study, the relationship was evaluated from experimental data collected from a cotton field. The experiment was carried out in an area of 5 ha with irrigated cotton. The energy balance and evaporative fraction (ΛΛΛΛΛ) were measured by the Bowen ratio method. Soil moisture (θθθθθ) data were collected using a PR2 - Profile Probe (Delta-T Devices Ltd). The empirical relationship was tested using experimentally collected ΛΛΛΛΛ and θθθθθ values and was applied using the ΛΛΛΛΛ values obtained from the Surface Energy Balance Algorithm for Land (SEBAL) and three TM - Landsat 5 images. There was a close correlation between measured and estimated θθθθθ values (p<0.05, R2 = 0.84) and there were no significant differences
according to the Student t-test (p<0.01). The statistical analyses showed that the
(1) Research Project carried out with financial support from CNPq. Received for publication on February 2, 2012 and approved on April 16,
2013.
(2) Fellow Researcher, Training Institutional Program (PCI), National Institute of Semi Arid (INSA). P.O. Box 10067. CEP 58429-970
Campina Grande (PB). E-mail: [email protected]; [email protected]
(3) Adjunct Professor, Federal University of Campina Grande (UFCG), Academic Unit of Atmospheric Science (UACA). Av. Aprígio
Veloso, 882. Bairro Universitário. CEP. 58429-140 Campina Grande (PB). E-mail: [email protected]
(4) Lecturer Professor, Federal University of Pernambuco, Department of Geographical Sciences. Av. Prof. Moraes Rego, 1235. Cidade
Universitária. CEP 50670-901 Recife (PE). E-mail: [email protected]
(5) Researcher, INSA, Associate Professor of Soil Science Graduate Program, Federal University of Paraíba, Center for Agricultural
Sciences, Campus II. Rodovia BR 079, Km 12. CEP 58.397-000 Areia (PB). E-mail: [email protected]
(6) Assistant Professor UFCG/UACA. E-mail: [email protected]; [email protected]
(7) Researcher, Brazilian Agricultural Research Company - National Center for Cotton Research (EMBRAPA-Algodão). Rua Oswaldo
empirical relationship can be applied to estimate the root-zone soil moisture of irrigated soils, i.e. when the evaporative fraction is greater than 0.45.
Index terms: standard relationship, SEBAL, energy balance, evaporative fraction, latent heat flux.
RESUMO:ESTIMATIVA DA UMIDADE DE SOLO NA ZONA RADICULAR A PARTIR DE DADOS DE SENSORIAMENTO REMOTO
Medições de umidade do solo em campo são complicadas. Assim, técnicas de sensoriamento remoto são necessárias, pois permitem o mapeamento da umidade do solo, em escala de campo e regional, na profundidade média da zona radicular da vegetação existente. O objetivo deste estudo foi avaliar a precisão de uma relação empírica para obter a umidade do solo a partir de dados de sensoriamento remoto para as condições irrigadas nos solos da Chapada do Apodi, no semiárido brasileiro. A relação empírica já foi testada para as condições irrigadas em algumas regiões do planeta como México, Egito e Paquistão, apresentando resultados promissores. Essa relação foi avaliada a partir de dados coletados em um experimento em campo de algodão. A campanha experimental foi realizada em uma área de 5 ha com algodão irrigado. Foram medidos os componentes do balanço de energia e a fração evaporativa (Λ), utilizando o método da razão de Bowen. Coletaram-se, ainda, dados de umidade do solo (θ) usando uma sonda de perfil PR2 (Delta-T Devices Ltd). A relação empírica foi testada utilizando os valores de Λ e θ experimentalmente coletados e foi aplicada usando os valores de Λ obtidos a partir do algoritmo SEBAL e três imagens TM - Landsat 5. Há forte correlação entre os valores medidos e estimados de θ (p<0,05) e R2 = 0,84; não houve diferenças significativas em nível de p<0,01, segundo o teste de Student. De acordo com as análises estatísticas, a relação empírica pode ser aplicada para estimar a umidade do solo na zona radicular sobre condições irrigadas, ou seja, para fração evaporativa maior que 0,45.
Termos de indexação: relação-padrão, SEBAL, balanço de energia, fração evaporativa, fluxo de calor latente
INTRODUCTION
Soil moisture is widely recognized as a key variable in numerous environmental studies related to meteorology, hydrology, and agriculture (Ahmad & Bastiaanssen, 2003; Vischel et al., 2008; Mattia et al., 2009; Kong et al., 2011). For hydrological and agricultural purposes, the estimation of soil moisture is crucial since it controls the quantity of water available for vegetation growth (Cook et al., 2006), as well as the deep aquifer recharge (Seneriviratne et al., 2006; Kjellström et al., 2007; Lam et al., 2011); and soil saturation, which controls the partitioning of rainfall between runoff and infiltration, and sediment transport (Vivoni et al., 2007; Ávila et al., 2011). In meteorology, several climate studies have indicated that surface-atmosphere energy transfer, the atmospheric circulation and precipitation are significantly affected by spatial and temporal variations of soil moisture, which controls evapotranspiration by its influence on evaporation and water availability to plants and influences the partitioning of latent and sensible heat as well (Savenije, 1995; Grayson et al., 1997; Entekhabi et al., 1999; Cook et al., 2006). Soil moisture is also
fundamental in the biogeochemical cycle of CO2, since
an ecosystem can switch from a CO2 sink to a CO2
source, according to the soil water availability (Cabral et al., 2011).
The high spatial and temporal variability of soil moisture caused by the heterogeneity of soil texture, topography, vegetation, and climate in the natural environment makes soil moisture difficult to measure (Kong et al., 2011). A complete description of spatial and temporal variability of soil moisture requires frequent and multiple three-dimensional measurements (Scott et al., 2003). Due to operational problems, these measurements become virtually unviable. However, the spatial and temporal variability of soil moisture can be determined by the significantly modernized remote sensing techniques, especially based on data obtained by (active and passive) microwave sensors or satellite images (Moran et al., 2002; Su et al., 2003; Wang et al., 2007; Vischel et al., 2008; Crow et al., 2008; Pauwels et al., 2009; Pierdicca et al., 2010). However, data measurements by microwave sensors limit estimates of soil moisture to the surface layer (± 5 cm) (Ahmad & Bastiaanssen, 2003; Crosson et al., 2005). On the other hand, an empirical relationship between the evaporative
fraction (Λ), defined as the ratio between latent heat
flux and available energy (net radiation minus soil heat flux) (Shuttleworth et al., 1989) and soil moisture
on data from two large-scale climate-hydrology studies, investigating soil moisture-evaporation-biomass interactions. This was the First ISCLCP (International Satellite Land Surface Climatology Project) Field Experiment FIFE (Sellers et al., 1992). The other study was the ECHIVAL Field Experiment in Desertification-Threatened Areas EFEDA (Bolle et al., 1993). Scott et al. (2003) modified this relationship
by the standardization of θ with saturated soil
moisture (θsat), called the relative soil moisture
content:
( )
{1 /0.421}
sat e
/q = -L
q (1)
The relative soil moisture content θ/θsat (-) ranges
from 0 (totally dry soil) to 1.0 (full saturation). As proposed by Ahmad & Bastiaanssen (2003), equation (1) is denominated standard relationship and can be applied to a wide range of soils. Scott et al. (2003) showed that this equation, without any modification, could be directly applied to irrigated soils of the Lerma-Chapala basin in Mexico, while Ahmad & Bastiaanssen (2003) showed that this method requires no calibration and can be comprehensively applied without soil data to irrigated areas in the region of Rechna Doab in the Indus River Basin. Mohamed et al. (2004) applied the method without previous calibration studies to the spatial variability of evaporation and moisture storage in the swamps of the Upper Nile, Egypt.
The application of the standard relationship using
Λ provided by remote sensing satellites resulted in
spatially distributed θ values for greater depths than
those covered by microwave sensor data. The spatial
variability of θ became possible due to the spatial
variability of Λ obtained from energy balance from
remote sensing data by algorithms such as SEBAL (Bastiaanssen et al., 1998a, b), S-SEBI (Roerink et al., 2000; Sobrino et al., 2007), and SEBS (Su, 2002).
The extrapolation of θ to plant root zone is viable since
θsat values represent the moisture conditions in this
layer (Scott et al., 2003; Ahmad & Bastiaanssen, 2003; Mohamed et al., 2004).
This article aims to evaluate the performance of the standard relationship (Equation 1) to estimate the soil moisture of an irrigated area in the Brazilian
semi-arid region, and apply the standard relationship to Λ
by SEBAL and TM - Landsat 5 images.
MATERIALS AND METHOD
The study was carried out on the Apodi Plateau, near the state border between Rio Grande do Norte and Ceará, in the northeastern region of Brazil. The experiment was conducted at the Experimental Station of EMPARN (Agricultural Research Organization of Rio Grande do Norte), in the county of Apodi (5o 37’ 37" S; 37o 49’ 54" W, 130 m asl).
According to Thornthwaite (1948), the regional climate is semi-arid, mean annual pluvial precipitation is 920 mm, concentrated between March and June, and the
mean air temperature ranges from 23.5 oC (August)
to 28.3 oC (April). The soils of the study area were
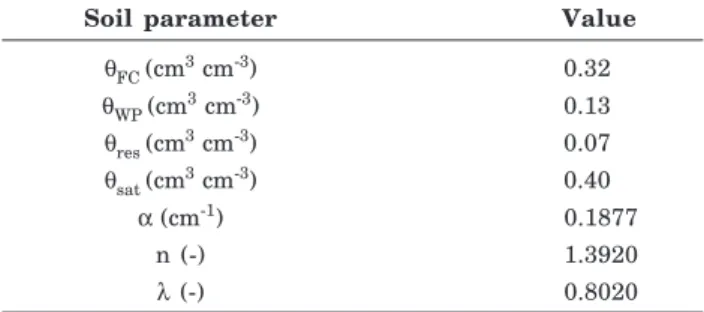
classified as Cambissoil (Embrapa, 2006) with a sandy-clay-loam texture, according to the USDA (United States Department of Agriculture) classification (with sand, silt and clay contents of 57, 9 and 34 %, respectively). A more detailed description of the study area was published by Bezerra et al. (2012a). The soil moisture at field capacity and permanent wilting point, besides the van Genuchten-Mualem parameters (van Genuchten, 1980), which are representative for the root zone of cotton, are presented in table 1.
The trials were carried out in an irrigated 5.0-ha area, where cotton cultivar BRS 187 8H was planted in the dry seasons of 2008 and 2009, irrigated by sprinkler irrigation Cotton was sown in a row spacing
of 0.9 m at a within-row density of 10 plants m-1,
with a total of approximately 133,000 plants ha-1.
The energy balance and evaporative fraction (Λ) were
estimated and soil moisture measured.
The energy balance of cotton was expressed by means of bulk energy and heat fluxes (Perez et al., 1999; Teixeira et al., 2007; Yunusa et al., 2011):
Rn = LE + H + G (2)
where Rn is net radiation (W m-2), measured by a net
radiometer model NR-LITE (Kipp & Zonen, Delft, The
Netherlands), G is the soil heat flux (W m-2),
measured 0.02 m below the surface using soil heat flux plates (model HFP01SC-L Hukseflux Thermal Sensors, Delft, The Netherlands). LE and H are the
latent and sensible heat fluxes (W m-2), respectively.
LE was derived from the energy balance equation (Equation 2) and the Bowen ratio concept (Bowen, 1926):
b +
-=
1 G Rn
LE (3)
where β is the Bowen ratio, which was obtained
through the following equation:
Soil parameter Value
θFC(cm3 cm-3) 0.32
θWP(cm3 cm-3) 0.13
θres(cm3 cm-3) 0.07
θsat(cm3 cm-3) 0.40
α (cm-1) 0.1877
n (-) 1.3920
λ (-) 0.8020
Table 1. Field capacity (θθθθθFC), permanent wilting point
(θθθθθWP) and van Genuchten-Mualem parameters
(θθθθθres, θθθθθsat, αααα, n, and α λλλλλ) of the experimental area, in
e T D D g = b (4)
where γ is the psychrometric constant, and ∆T and
∆e are the gradients of temperature and actual vapor
pressure, respectively, measured at two levels above the crop canopy, by psychrometers with copper-constantan thermocouples (type T). Data were measured every 5 s and averages recorded every 20 min on a CR3000 data logger (Campbell Sci, Logan, UT, USA).
The evaporative fraction (Λ) was obtained by the
following equation: G Rn LE -= L (5)
The soil moisture was measured twice a week using PR2 - Profile Probe (Delta-T Devices Ltd., Cambridge, UK), at six depths (10, 20, 30, 40, 60, and 100 cm).
The standard relationship (Equation 1) was
evaluated by comparing θ and Λ measured in the trials.
The q values were estimated by the standard method
(Equation 1), using Λ, obtained by the BREB (Bowen
Ratio-Energy Balance) method and compared with the results of the PR2 - Profile Probe. The significance level of differences between these results was analyzed by
the determination coefficient (R2), root mean square
error (RMSE) and Student’s t-test (p<0.01), according to the following equations (Wilks, 2006):
(
)
å
= -= n 1 k 2 k k m e n 1 RMSE (6) ÷÷ ø ö çç è æ -= e m s N 1 N 1 s e m t (7)where ek and mk are kth estimated and measured
values, respectively, m and e are, respectively, the
measured and estimated means, and Nm and Ne are
sample sizes.
The standard relationship (Equation 1) was applied
using the Λ values obtained from three TM - Landsat
5 images. The images for path/row 216/064 were provided by the Brazilian Institute for Space Research (INPE), for November 01, November 17 and December 19, 2008. The steps to obtain the energy balance by SEBAL involve radiometric calibration and the calculation of albedo, thermal emissivity, surface emissivity, longwave radiation (incoming and outgoing), and finally the values of Rn, G, H, and LE for satellite overpass time. LE was calculated as a “residual” of the surface energy balance equation. These steps were described in detail by Bastiaanssen (2000), Bezerra et al. (2008), Santos et al. (2010), and Bezerra et al. (2012b).
The energy balance components provided by SEBAL were validated using data obtained by the BREB
method, although SEBAL had been validated for irrigated soils in the semi-arid region of Brazil (Bezerra et al., 2008; Folhes et al., 2009; Teixeira et al., 2009; Santos et al., 2010). An error analysis was performed using the Mean Absolute Error (MAE) and Mean Absolute Percentage Error (MAPE), as given by the equations (Wilks, 2006):
å
= -= n 1 k k k m e n 1 MAE (8)å
= -= n 1 k k k k m m e n 1 MAPE (9)where ek and mk are the kth of n pairs of estimated
and measured values.
RESULTS AND DISCUSSION
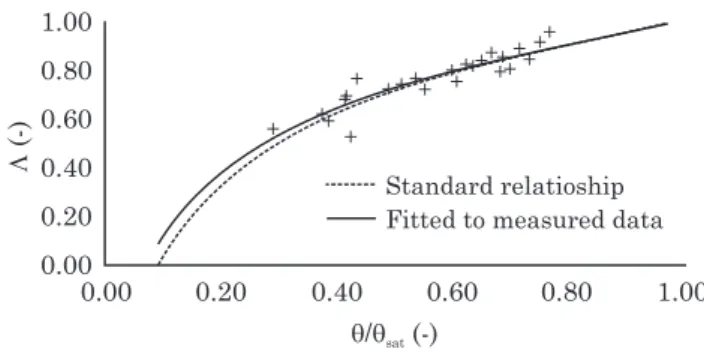
Figure 1 shows the relation between θ/θsat and Λ
based on the field observations and the standard curve (Equation 1). The root mean square error (RMSE)
between θ estimated by standard relationship and field
data was 0.02 cm3 cm-3 for Λ, ranging from 0.56 to
0.96. Ahmad & Bastiaanssen (2003) found RMSE
values of 0.05 cm3 cm-3 under wheat-rice rotation in
the Rechna Doab region of an irrigation system in
the Indus River Basin, in Pakistan, for Λ values
ranging from 0.48 to 0.94. Similar values were found by Scott et al. (2003) in irrigated soils of the Lerma-Chapala basin, in Mexico.
According to Ahmad & Bastiaanssen (2003), the deviation from the standard curve could be associated
to (1) instrumental errors (both for θ and Λ), (2) the
different scales between θ and Λ, and (3) the empirical
character of equation 1. The difference between the
observation scales of θ and Λ is a relevant factor,
because while the θ values were locally measured and
representative for a reduced area, Λ values were
derived from observed meteorological variables from a range of hundreds of meters. The range of the BREB
1.00 0.80 0.60 0.40 0.20 0.00
0.00 0.20 0.40 0.60 0.80 1.00
q q/ sat(-)
L
(-)
Standard relatioship Fitted to measured data
+ +++
+++ ++++ + ++++++++ ++
++
Figure 1. Relationship between field observations of relative soil moisture (θθθθθ/θθθθθsat) and evaporative
method should be hundreds of meters and uniform, to provide a sufficient distance to establish an equilibrium boundary layer (Allen et al., 2011).
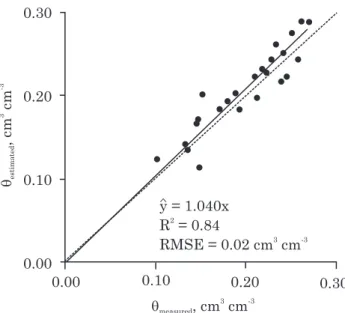
The θ values measured and estimated by the
standard curve were compared (Figure 2). There was a close correlation (p<0.05) with the coefficient of determination of 0.84 and there were no significant differences according to the Student t-test (p<0.01). Consequently, the standard curve (Equation 1) can be applied to soils of irrigated cotton on the Apodi Plateau with typical values expected for irrigated soils
(RMSE = 0.02 cm3 cm-3, Λ = 0.56 - 0.96). Under other
conditions, e.g., in rainfed agriculture, under water stress caused by insufficient irrigation, in areas of native vegetation and/or for bare soil in dry periods,
considerably lower Λ values are expected, due to
uncertainties in the q estimates.
The range of errors between measured and
estimated θ values are plotted in figure 3, showing
differences of -0.034 to 0.05 cm3 cm-3. The errors were
predominantly > 0.010 cm3 cm-3, for Λ > 0.60 (Figure
3). In the Doab Rechner area of an irrigation system in the Indus River basin, Ahmad & Bastiaanssen (2003) observed that these errors tended to increase
systematically in absolute numbers as Λ increases.
In this study, no error tendency was observed at
Λ < 0.5, since the experiment was limited to the
irrigated area.
The assessment of the standard method consisted
of calculating soil moisture from Λ on a pixel-to-pixel
basis, using TM-Landsat 5 images and SEBAL. The
θsat of the root-zone was obtained by the gravimetric
method at 0.40 cm3 cm-3. Three clear-sky images were
used. These images were acquired 33, 49 and 81 days after cotton emergence. The overlay images covered the experimental area of EMPARN, which consisted of irrigated fields, pasture, native vegetation, and bare soil.
The SEBAL validation (Table 2) consisted of the comparison of energy fluxes, estimated by SEBAL and
computed by BREB, to calculate Λ. The MAE was
less than 20 W m-2 (Table 2) and MAPE of Rn and LE
less than 3 %, indicating full reliability. On the other hand, the greatest uncertainty associated to SEBAL was verified in the G estimates (MAPE > 20 %). This was however considered a minor problem by Bastiaanssen et al. (1998b), because microscale soil heat flux measurements are representative of a very small influence sphere and therefore incompatible with the size of one Thematic Mapper pixel anyhow. Moreover, uncertainty decreases with increasing scale (Bastiaanssen et al., 1998b, 2000). According to Bastiaanssen et al. (2000), the error (1-ha resolution) varies from 10 to 20 %. For an area of 1000 ha, the error is reduced to 5 % and for farmland regions of 1 million ha the error becomes negligibly small.
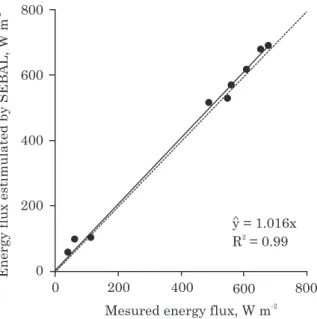
Figure 4 shows a scatter plot of SEBAL-estimated energy fluxes versus field measurements. The high agreement between the two approaches was evidenced by the determination coefficient of 0.99, confirming SEBAL as an appropriate tool to calculate energy fluxes at the Earth’s surface on a spatial scale.
The spatial distribution of soil moisture in the root zone at the Experimental Station of EMPARN on the Apodi Plateau (Figure 5) was calculated for three dates, i.e., a) Nov-01, b) Nov-17 and c) Dec-19 of 2008. Soil moisture was highest in the root zone of the irrigated
cotton field (highlighted) (θ around 0.32 cm3 cm-3).
The images acquired on Nov-01 and Nov-17 (Figure 5a,b) coincided with the irrigation dates. Note that the soil moisture of the entire cotton field was at field capacity. The image of Dec-19 (Figure 5c) did not coincide with the irrigation event. For this reason, the soil moisture in part of the cotton field was below
field capacity (θ around 0.25 cm3 cm-3). Our results
demonstrate that the methodology applied in this study can detect the effect of irrigation in the selected area, to maintain the soil more humid than in the surrounding area.
0.30
0.20
0.10
0.00
0.00 0.10 0.20 0.30
qmeasured, cm cm
3 -3
qestimated
, cm
cm
3
-3
y = 1.040x R = 0.84
RMSE = 0.02 cm cm
2
3 -3
Figure 2. Scatter plot between θθθθθ values, measured and estimated by the standard method.
+ + +
+ +++++ +
+ +++++
+++++++
+
0.07
0.02
-0.03
-0.08
0.00 0.20 0.40
L(-)
0.60 0.80 1.00
qestimated
-cm
cm
3
-3
qmeasured
,
Figure 3. Difference between soil moisture in the cotton root zone estimated by standard relationship (θθθθθEstimated) and measured (θθθθθMeasured)
CONCLUSIONS
1. The standard relationship can be applied without any calibration and/or modification to estimate soil moisture in the root zone of soils on the Apodi Plateau,
800
600
400
200
0
0 200 400 600 800
Mesured energy flux, W m-2
Energy flux estimulated by SEBAL, W m
-2
y = 1.016x R = 0.992
Figure 4. Scatter plot of field-measured versus SEBAL-estimated energy fluxes.
Figure 5. Map of soil moisture in the root zone on (a) Nov-01, (b) Nov-17 and (c) Dec-19 of 2008 at the Experimental Station of EMPARN, Apodi Plateau (cotton field indicated by the dotted square).
Rn G LE
BREB SEBAL BREB SEBAL BREB SEBAL
W m-2
01/Nov 656.0 680.0 61.0 98.0 563.0 570.0
17/Nov 680.0 690.0 115.0 104.0 492.0 515.0
19/Dec 610.0 620.0 41.0 60.0 551.0 530.0
Mean 649.0 663.0 72.0 87.0 535.0 530.0
MAE 14.0 15.0 5.0
MAPE (%)(1) 2.3 20.7 1.0
Table 2. Comparison of energy fluxes estimated by SEBAL (Surface Energy Balance Algorithm for Land) and by BREB (Bowen Ratio-Energy Balance)
(1) MAPE values multiplied by 100 %.
since soil saturation is representative for the moisture conditions in the plant root zone.
2. Applications of the standard relationship are more reliable for irrigated soils or with sufficient soil
moisture, i.e. Λ greater than 0.45.
3. For other conditions, such as bare soil, native vegetation and pasture during dry periods, the standard relationship should be tested experimentally.
ACKNOWLEDGEMENTS
The authors gratefully acknowledge the Conselho Nacional de Desenvolvimento Científico e Tecnológico (CNPq) for financial support and the Empresa Brasileira de Pesquisa Agropecuária (EMBRAPA) and Empresa de Pesquisa Agropecuária do Rio Grande do Norte (EMPARN) for allowing the use of the area and administrative structure of the experimental station.
LITERATURE CITED
AHMAD, M. & BASTIAANSSEN, W.G.M. Retrieving soil moisture storage in the unsaturated zone using satellite imagery and bi-annual phreatic surface fluctuations. Irrig. Drain. Syst., 17:141-161, 2003.
ALLEN, R.G.; PEREIRA, L.S.; HOWELL, T.A. & JENSEN, M.E. Evapotranspiration information reporting: I. Factors governing measurement accuracy. Agric. Water Manage., 98:899-920, 2011.
ÁVILA, L.F.; MELLO, C.R.; MELLO, J.M. & SILVA, A.M. Padrão espaço-temporal da umidade volumétrica do solo em uma bacia hidrográfica com predominância de Latossolos. R. Bras. Ci. Solo, 35:1801-1810, 2011. BASTIAANSSEN, W.G.M. SEBAL-based sensible and latent
BASTIAANSSEN, W.G.M.; MENENTI, M.; FEDDES, R.A. & HOLTSLAG, A.A.M. A remote sensing surface energy balance algorithm for land (SEBAL). 1. Formulation. J. Hydrol., 212/213:198-212, 1998a.
BASTIANSSEN, W.G.M.; PELGRUN, H.; WANG, J.; MA, Y.; MORENOM, J.F.; ROERINK, G.J. & van der WAL, T. A remote sensing surface energy balance algorithm for land (SEBAL). 2. Validation. J. Hydrol., 212/213:213-229, 1998b. BASTIAANSSEN, W.G.M.; MOLDEN, D.J. & MAKIN, I.A. Remote sensing for irrigated agriculture: examples from research and possible applications. Agric. Water Manage., 46:137-155, 2000.
BEZERRA, B.G.; SILVA, B.B. & FERREIRA, N.J. Estimativa da evapotranspiração real diária utilizando-se imagens digitais TM - Landsat 5. R. Bras. Meteorol., 23:305-317, 2008. BEZERRA, B.G.; SILVA, B.B.; BEZERRA, J.R.C.; SOFIATTI,
V. & SANTOS, C.A.C. Evapotranspiration and crop coefficient for sprinkler-irrigated cotton in Apodi Plateau semiarid lands of Brazil. Agric. Water Manage., 107:86-93, 2012a.
BEZERRA, M.V.C.; SILVA, B.B.; BEZERRA, B.G.; BORGES, V.P. & OLIVEIRA, A.S. Evapotranspiração e coeficiente de cultura do algodoeiro irrigado a partir de imagens de sensores orbitais. R. Ci. Agron., 43:64-71, 2012b. BOLLE, H.J.; OLIVER, H.R. & SHUTTLEWORTH, W.J.
EFEDA: European field experiment in a desertification-threatened area. Ann. Geophys., 11:173-189, 1993. BOWEN, I.S. The ratio of heat losses by conduction and by
evaporation from any water surface. Phys. Rev., 27:779-787, 1926.
CABRAL, M.R.O.; GASH, J.H.; ROCHA, H.R.; MARSDEN, C.; LIGO, M.A.V.; FREITAS, H.C.; TATSCH, J.D. & GOMES, E. Fluxes of CO2 above a plantation of eucalyptus in
southeast Brazil. Agric. For. Meteorol., 151:49-59, 2011. COOK, B.I.; BONAN, G.B. & LEVIS, S. Soil moisture
feedbacks to precipitation in Southern Africa. J. Climate, 19:4198-4206, 2006.
CROSSON, W.L.; LIMAYE, A.S. & LAYMON, C.A. Parameter sensitivity of soil moisture retrievals from airborne C-and X-BC-and radiometer measurements in SMEX02. IEEE T. Geosci. Remote Sens., 43:2842-2853, 2005.
CROW, W.T.; KUSTAS, W. & PRUEGER, J.H. Monitoring root-zone soil moisture through the assimilation of a thermal remote sensing-based soil moisture proxy into a water balance model. Remote Sens. Environ., 112:1268-1281, 2008.
EMPRESA BRASILEIRA DE PESQUISA AGROPECUÁRIA -EMBRAPA. Centro Nacional de Pesquisa de Solos. Sistema brasileiro de classificação de solos. 2.ed. Rio de Janeiro, 2006. 306p.
ENTEKHABI, D.; ASRAR, G.R.; BETTS, A.K.; BEVEN, K.J.; BRAS, R.L.; DUFFY, C.J.; DUNNE, T.; KOSTER, R.D.; LETTERMAIER, D.P.; McLAUGHLIN, D.B.; SHUTTLEWORTH, W.J.; van GENUCHTEN, M.T.; WEI, M-Y. & WOOD, E.F. An agenda for land surface hydrology research and a call for the second international hydrological decade. B. Am. Meteorol. Soc., 80:2043-2058, 1999.
FOLHES, M.T.; RENNÓ, C.D. & SOARES, J.V. Remote sensing for irrigated water management in the semiarid Northeast of Brazil. Agric. Water Manage., 96:1398-1408, 2009.
GRAYSON, R.B.; WESTERN, A.W. & CHIEW, F.H.S. Preferred states in spatial soil moisture patterns: Local and nonlocal controls. Water Resour. Res., 33:2897-2908, 1997.
KJELLSTRÖM, E.; BÄRRING, L.; JACOB, D.; JONES, R.; LENDERINK, G. & SCHÄR, C. Modelling daily temperature extremes: recent climate and future changes over Europe. Climatic Change, 81:249-265, 2007. KONG, X.; DORLING, S. & SMITH, R. Soil moisture modelling
and validation at an agricultural site in Norfolk using the Met Office surface exchang scheme (MOSES). Meteorol. Appl., 18:18-27, 2011.
LAM, A.; KARSSENBERG, D.; van den HURT, B.J.J.M. & BIERKENS, M.F.P. Spatial and temporal connections in groundwater contribuition to evaporation. Hydrol. Earth Syst. Sci., 15:2621-2630, 2011.
MATTIA, F.; SATALINO, G.; PAUWELS, V.R.N. & LOEW, A. Soil moisture retrieval through a merging of multi-temporal L-band SAR data and hydrologic modelling. Hydrol. Earth Syst. Sci., 13:343-356, 2009.
MOHAMED, Y.A.; BASTIAANSSEN, W.G.M. & SAVENIJE, H.H.G. Spatial variability of evaporation and moisture storage in the swamps of the upper Nile studied by remote sensing techniques. J. Hydrol., 289:145-164, 2004. MORAN, M.S.; HYMER, D.C.; QI, J. & KERR, Y. Comparison
of ERS-2 SAR and Landsat TM imagery for monitoring agricultural crop and soil conditions. Remote Sens. Environ., 79:243-252, 2002.
PAUWELS, V.R.N.; BALENZANO, A.; SATALINO, G.; SKRIVER, H.; VERHOEST, N.E.C. & MATTIA, F. Optimization of soil hydraulic model parameters using Synthetic Aperture Radar data: An integrated multidisciplinary approach. IEEE T. Geosci. Remote Sens., 47:455-467, 2009.
PEREZ, P.J.; CASTELLVI, F.; IBAÑEZ, M. & ROSEL, J.I. Assessment of reliability of Bowen ratio method for partitioning fluxes. Agric. For. Meteorol., 97:141-150, 1999.
PIERDICCA, N.; PULVIRENTI, L. & BIGNAMI, C. Soil moisture over vegated terrains using multitemporal remote sensing data. Remote Sens. Environ., 114:440-448, 2010.
ROERINK, G.J.; SU, Z. & MENENTI, M. S-SEBI: A simple remote sensing algorithm to estimate the surface energy balance. Phys. Chem. Earth Pt. B, 25:147-157, 2000. SANTOS, C.A.C.; BEZERRA, B.G.; SILVA, B.B. & RAO, T.V.R.
SAVENIJE, H.H.G. Does moisture feedback affect rainfall singnificantly? Phys. Chem. Earth 20: 507-513, 1995. SCOTT, C.; BASTIAANSSEN, W.G.M. & AHMAD, M. Mapping
root zone soil moisture using remotely sensed optical imagery. J. Irrig. Drain. E-ASCE, 129:326-335, 2003. SELLERS, P.J.; HALL, F.G.; ASRAR, G.; STREBBEL, D.E. &
MURPHY, R.E. An overview of the first International Satellite Land Surface Climatology Project (ISLSCP) Field Experiment (FIFE). J. Geophys. Res., 97:18345-18371, 1992.
SENERIVIRATNE, S.I.; LÜTHI, D.; LITSCHI, M. & SCHÄR, C. Land-atmosphere coupling and climate change in Europe. Nature, 443:205-209, 2006.
SOBRINO, J.A.; GÓMEZ, M.; JIMÉNEZ-MUÑOZ, J.C. & OLIOSO, A. Application of a simple algorithm to estimate daily evapotranspiration from NOAA-AVHRR images for the Iberian Peninsula. Remote Sens. Environ., 110:139-148, 2007.
SHUTTLEWORTH, W.J.; GURNEY, R.J.; HSU, A.Y. & ORMSBY, J.P. FIFE: The variations in energy balance partition at surface flux sites. In: REMOTE SENSING AND LARGE-SCALE GLOBAL PROCESSES, 3., Baltimore, 1989. Proceedings… Baltimore, 1989. p.67-74.
SU, Z. The surface energy balance system (SEBS) for estimation of turbulent heat fluxes. Hydrol. Earth Syst. Sci., 6:85-100, 2002.
SU, Z.; YACOB, A.; WEN, J.; ROERINK, G.; HE, Y.; GAO, B.; BOOGAARD, H. & van DIEPEN, C. Assessing relative soil moisture with remote sensing data: Theory, experimental validation, and application to drought monitoring over the North China Plain. Phys. Chem. Earth, 28:89-101, 2003.
TEIXEIRA, A.H.; BASTIAANSSEN, W.G.M.; AHMAD, M.D. & BOS, M.G. Reviewing SEBAL input parameters for assessing evapotranspiration and water productivity for the Low-Middle São Francisco River basin, Brazil: Part A: Calibration and validation. Agric. For. Meteorol., 149:462-476, 2009. TEIXEIRA, A.H.C.; BASTIAANSSEN, W.G.M. & BASSOI, L.H.
Crop water parameters of irrigated wine and table grapes to support water productivity analysis in the São Francisco river, basin, Brazil. Agric. Water Manage., 94:31-42, 2007. THORNTHWAITE, C.W. An approach toward a rational
classification of climate. Geogr. Rev., 38:55-94, 1948. van GENUCHTEN, M.TH. A closed-from equation for
predicting the hydraulic conductivity of unsaturated soils. Soil Sci. Soc. Am. J., 44:892-898, 1980.
VISCHEL, T.; PEGRAM, G.G.S.; SINCLAIR, S.; WANER, W. & BARTSCH, A. Comparison of soil moisture fields estimated by catchment modeling and remote sensing: A case study in South Africa. Hydrol. Earth Syst. Sci., 12:751-767, 2008. VIVONI, E.R.; ENTEKHABI, D.; BRAS, R.L. & IVANOV, V.Y. Controls on runoff genration and scale-dependence in a distributed hydrologic model. Hydrol. Earth Syst. Sci. 11:1683-1701, 2007.
WANG, L.; QU, J.J.; ZHANG, S.; HAO, X. & DASGUPTA, S. Soil moisture estimataion using MODIS and ground measurements in eastern China. Intern. J. Remote Sens., 28:1413-1418, 2007.
WILKS, D.S. Statistical methods in the atmospheric science. San Diego, Academic Press, 2006. 648p.