Rev. Caatinga
COWPEA LEAF AREA, BIOMASS PRODUCTION AND PRODUCTIVITY UNDER
DIFFERENT WATER REGIMES IN CASTANHAL, PARÁ, BRAZIL
1PAULO JORGE DE OLIVEIRA PONTE DE SOUZA2*, VIVIAN DIELLY DA SILVA FARIAS2, MARCUS JOSÉ ALVES DE LIMA3, THAYNARA FERNANDES RAMOS2, ADRIANO MARLISOM LEÃO DE SOUSA2
ABSTRACT – This work evaluated the effect of soil water availability on growth and productivity variables of
cowpea in northeastern Pará, Brazil. The experiment was carried out in a field of 2,100 m2 at the experimental
site of the Federal Rural University of Amazon, during the driest season of the years 2011, 2012 and 2013, in a
completely randomised design with two treatments (irrigated and non-irrigated), both with 12 replications in
the reproductive phase (2012 and 2013). Growth and productivity data were submitted to analysis of variance
with two variation factors (water regime and experimental year) at 5% probability. Student's t-test at 5%
probability was used in the means of the stomatal conductance data, since this was monitored only in 2012. Final biomass production presented a reduction of 54.3% in 2012 and 26.4% in 2013 as a result of water deficit
(DEF) of 76 and 26 mm, respectively. Mean stomatal conductance was reduced by 73% in the grain-filling
stage as a result of the lower water availability during this period. Average cowpea productivity under water
deficit reached 1,257 kg ha-1 in 2012 and 1,396 kg ha-1 in 2013. The reduction in water supply over the
reproductive period significantly decreased production by 72 and 41% (F test, p < 0.05) in 2012 and 2013, respectively. An accumulated water deficit during the reproductive phase caused a maximum LAI reduction of 47% in 2012 (DEF of 76 mm) and of 13% in 2013 (DEF of 26 mm).
Keywords: Vigna unguiculata. Productivity. Water availability.
PRODUÇÃO DE ÁREA FOLIAR E BIOMASSA E PRODUTIVIDADE DO FEIJÃO-CAUPI SOB
REGIMES HÍDRICOS EM CASTANHAL, PARÁ
RESUMO - O objetivo deste trabalho foi avaliar o efeito da disponibilidade de água no crescimento e
produtividade do feijão-caupi cultivado no Nordeste do estado do Pará, Brasil. O experimento foi realizado em
uma área de 2.100 m2 na Fazenda Escola da Universidade Federal Rural da Amazônia, durante o período
menos chuvoso de 2011, 2012 e 2013, em um delineamento inteiramente casualizado com dois tratamentos (irrigado e não irrigado), com 12 repetições na fase reprodutiva (2012 e 2013). Dados de crescimento e de produtividade foram submetidos a análise de variância com dois fatores de variação (regime hídrico e ano
experimental) a 5% de probabilidade. Utilizou-se o teste t de Student a 5% de probabilidade nas médias de
condutância estomática por ser monitorada apenas em 2012. A produção final de biomassa apresentou redução de 54,3% em 2012 e de 26,4% em 2013 devido a ocorrência de uma deficiência hídrica (DEF) de 76 e de 26 mm, respectivamente. A condutância estomática média foi reduzida em 73% na fase de enchimento de grãos devido a menor disponibilidade de água nesta fase. A produtividade média do caupi sob baixa deficiência
hídrica atingiu 1.257 kg ha-1 em 2012 e 1.396 kg ha-1 e 2013. A redução da água diminuiu em 72% e 41% o
rendimento do caupi (teste F, p < 0,05) em 2012 e 2013, respectivamente. A deficiência hídrica acumulada na fase reprodutiva causou redução de 47% no máximo IAF em 2012 (DEF de 76 mm) e de 13% em 2013 (DEF de 26 mm).
Palavras-chave: Vigna unguiculata. Produtividade. Disponibilidade hídrica.
_____________________ *Corresponding author
1Received for publication in 04/04/2016; accepted in 11/28/2016.
2Institute Environmental and Water Resources, Universidade Federal Rural da Amazônia, Belém, PA, Brazil;
[email protected], [email protected], [email protected], [email protected].
INTRODUCTION
Cowpea (Vigna unguiculata L. Walp) has a high socioeconomic importance in Brazil and is one of the most important sources of protein (CARVALHO et al., 2012) and of great importance in the basic diet of the poor population (BORGES et al, 2012). The high genetic variability (ANDRADE et al., 2010) and high adaptability to a variety of environmental conditions (NEVES et al., 2009), coupled with a high nutritional level (CARVALHO et al., 2012) and low production costs (MODESTO JUNIOR; ALVES, 2012), make cowpea beans an excellent option against hunger in the poorest regions of the world.
Water availability is one of the most important environmental factors in plant growth control (NASCIMENTO; PEDROSA; SOBRINHO, 2004), and although the Amazon region presents a high volume of rainfall compared to other regions of Brazil, the climatic regime of this area limits cowpea production to the first half of the year, when water is readily available without the need for alternative supply through irrigation.
Previous studies in other regions of Brazil have shown that different levels of water in the soil influence the growth and grain yield of this crop and, depending on the cultivar adopted, the effect of water availability becomes more significant. Silva and Neves (2011) cultivated 20 cowpea genotypes in the Northeast of Brazil, with productivities ranging
between 669 and 1,070 kg ha-1 under dry conditions
and between 982 and 1,832 kg ha-1 under irritation.
This represents an average increase of 69% in productivity as a result of water supply. Although cowpea has a large relevance in the State of Pará, its production and productivity has been decreasing since 2003 due to several technical, commercial, political and, above all, climatic problems (REBELLO; COSTA; FIGUEIRÓ, 2011).
Depending on the place and time of the year, mainly in the Brazilian Northeast, the cultivation conditions of the species are considered adverse,
with the occurrence of water deficiency coupled with high temperatures, which requires production strategies where water acts as the limiting factor (RAMOS et al., 2012). Due to the economic importance of this crop for the region, this study aims to evaluate the effect of soil water availability on grain growth and yield of cowpea. The experiment was performed over a period of three
years under irrigated and non-irrigated conditions.
MATERIAL AND METHODS
The experiment was carried out from 2011 to 2013 in the northeastern region of the state Para, at the experimental site of the Federal Rural University of Amazon, about 80 km from the city of Belém. The field was located in an area with 0.21 ha of cowpea cultivation (1°19'24.48"S; 47°57'38.20"W). The regional climate, according to the Koppen classification, is Ami. Maximum and minimum temperatures are 35 and 18°C, respectively, with an average annual temperature of 26°C. Average relative humidity and annual rainfall are 80% and 2,571.6 mm, respectively (TENÓRIO et al, 1999).
An automatic weather station was installed at the experimental area to monitor the meteorological variables. It consisted of a datalogger (CR10X, Campbell Scientific) and a multiplexer (AM16/32A, Campbell Scientific) configured to generate averages every 10 minutes. Data of temperature (Tar), relative air humidity (RH), global radiation (Rg), volumetric soil water content (US) through time domain reflectometry (TDR) and precipitation were sampled.
For physical and chemical soil
characterisation, samples were collected throughout the experimental area at depths of 0 to 0.2 m. Soil samples were analysed at the soil laboratory of the Federal Rural University of Amazon (UFRA). The soil was classified as a sandy loam textured Latosol; the results of the analyses are shown in Table 1. Due to logistic reasons, the area used in 2011 was different from that used in 2012 and 2013.
Table 1. Chemical and physical soil parameters in the experimental site of UFRA, Castanhal-PA, in the three experiments.
Soil chemical characteristics (0-0.20 m)
pH P Na2+ Ca2+ Mg Ca2++Mg2+ Al3+ SOM
Year (in H2O) (mg dm
-3
) (cmolc dm
-3
) (g kg-1)
2011 5.9 31.56 - 1.43 0.67 - 0.24 2.82
2012/13 4.7 2 12 1 0.50 1.1 0.45 9.11
Soil physical characteristics (0-0.20 m)
Clay Silt Sand Soil density Field capacity
Permanent wilting point
Critical humidity
Available water capacity
Year (g kg-1) (kg dm-3) (m3 m-3) (mm cm-1)
2011 120 110 760 1.55 0.19 0.085 0.114 1.63
Rev. Caatinga
The soil was prepared at the end of the rainy season of the region. Seeds were sown mechanically, adopting a spacing of 0.5 m between rows, averaging 10 plants per linear meter. Overall density was 200,000 plants per ha. Prior to sowing, the seeds were treated with both fungicide and insecticide. Seeding was carried out on August 10, September 25 and October 1 of 2011, 2012 and 2013, respectively,
at a rate of 13-15 m-1 seeds. During sowing, soil
fertilisation, based on the results of the chemical analysis, was performed using a chemical fertiliser (urea, triple superphosphate and potassium chloride)
of the formulation 0:60:40 kg ha-1 of N, P and K.
Over the experimental time, herbicides and
insecticides were used when necessary.
Physiological maturation was reached on October 5, November 22 and November 26 of 2011, 2012 and 2013, respectively.
The cultivar used was BR3 Tracuateua, which presents a habit of indeterminate growth, prostrate
size and a cycle of 60-70 days; it is the most
recommended cowpea cultivar for the climatic
conditions of the eastern part of Para State (FREIRE FILHO et al., 2009). In addition, it presents moderate tolerance to high temperatures and water deficits (NASCIMENTO et al., 2011).
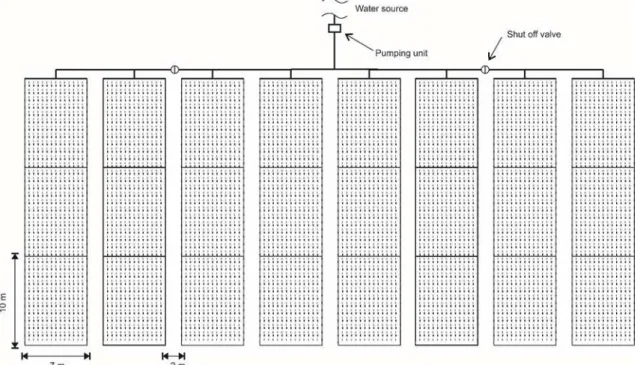
The experiment was carried out in an area of 30 x 70 m (≈ 0.21 ha) in two distinct locations within the site. The first one was a fallow area during 2011 and the second area, selected based on logistic reasons, was in an area previously covered with a secondary forest in 2012 and 2013. The distance between the two areas was 300 m. The delineation was completely randomised with 12 replicates (12 plots) of 10 x 7 m. In 2011, the 12 plots were submitted to natural rainfall conditions (dryland), while in 2012 and 2013, in another experimental area, the plots were submitted to two treatments,
irrigated and non-irrigated, totalling 24 experimental
plots; 12 plots were irrigated and 12 were non
-irrigated (Figure 1). Initially up to stage V4, the planting was submitted to an irrigation system without distinction of treatment in order to establish and standardise the crop (in 2012 and 2013).
Figure 1. Schematic design of the experimental area and irrigation system. Irrigation was performed using a drip
irrigation system with drip tapes with a distance of 0.20 m between drippers. Mean flow rate, as
measured in the field, was 0.602 L h-1 per dripper,
with a service pressure of 3 mwc. The dripping tapes used were made of additive polyethylene, with a nominal diameter of 16 mm and with integrated insert type emitters. They were positioned on the surface of the soil with each tape serving one planting line. When the plants reached the R5 stage, about 30 days after sowing (DAS), representing beginning of the reproductive phase, the experimental delineation was started with 12 plots
and 2 treatments, irrigated and non-irrigated (in 2012
and 2013).
The water blade applied during the experiment was controlled as a function of time according to the flow of the emitters, using manometers, registers and timer. Irrigation time was determined daily as a function of crop evapotranspiration (ETc) of the previous day. The value of ETc was calculated from the daily reference
evapotranspiration (ETo) obtained by the
Penman-Monteith method (ALLEN et al., 2011). The
the Federal Institute of Pará, Campus Castanhal, 3 km from the experimental area, and measured as a
function of the crop coefficient of cowpea (BASTOS et al., 2008).
To calculate the actual evapotranspiration of the crop (ETr) and the water deficit, the Thornthwaite and Mather method, modified by Pereira (2005), was adopted. It considers the available water capacity (AWC) of the experimental area (Table 1) and the effective depth of the radicular system visually observed in the field.
Phenological development was analysed daily according to the method of identification of crop stages described in Farias et al. (2015). Basically, continuous monitoring starts from germination, with three replicates per treatment of plots that consisted of lines of 1 meter in length, containing 10 plants in average.
Data for growth analysis was collected twice a week from the 10 DAS. We collected 5 plants per 0.5 linear meter in each treatment. The samples were separated into leaflets, petioles, stalks, peduncles,
flowers, pods and grains. Data were oven-dried at
70°C until constant weight, on average 56 hours, and weighed on a digital scale with precision of 0.01 g.
At the time of harvesting, three plots of 1 m2,
represented by lines of 2 linear meters previously defined for grain yield (PG), were selected. Leaf area was obtained by collecting six leaf discs per plant, totalling 30 discs per sample. The disc samples were carefully collected from the middle third of the fully expanded central leaflet. Leaf area index (LAI) was estimated considering these measures (discs areas) and the dry weight of the sampled leaves (BENINCASA, 2003).
In the experiment performed in 2012, stomatal conductance (gs) of the culture was
evaluated through a steady-state porometer (model
Type AP4 - Delta-T Devices). Measurements were
carried out during the day, between 8 a.m. and 4 p.m., on the abaxial faces of the central leaflet of the third leaf from the fully expanded apex (NASCIMENTO et al., 2011). Three plants in each treatment were sampled. We selected three evaluations days, representing the period of reproduction (R7 stage) at 41 DAS, grain filling (R8 stage) at 47 DAS and, finally, physiological maturation (R9 stage) at 58 DAS, respectively. Here, we justify the presentation of the results only for 2012, as this was the only year in which we had the equipment available for use in the field.
Total shoot biomass, LAI and grain yield data were submitted to analysis of variance with 5% probability. We considered two variation factors (treatment and experimental year) and the interaction
between them. Student's t-test at 5% probability was
used to identify significant differences in the means
of cowpea conductance data submitted to both
treatments, irrigated and non-irrigated.
RESULTS AND DISCUSSION
During the entire experiment, air temperatures ranged between 20.15 and 34.11°C, with a daily average of 27.56; 27.17 and 27.03ºC in 2011, 2012 and 2013, respectively. Mean daily relative air humidity over the three years were 83.41, 79.73 and 85.42%, respectively. These are optimum conditions for cowpea development, considering that this crop is adapted to warm climates (BASTOS et al., 2008; NASCIMENTO et al., 2011). Mean incident solar irradiance and average reference evapotranspiration observed during the experiment corresponded to
18.91, 17.78 and 17.86 MJ m-2 d-1 and 3.77, 3.21 and
3.12 mm day-1, respectively, for 2011, 2012 and
2013.
These results indicate that although the conditions were similar between the experiments, the year 2011 was considerably warmer and with greater energy availability. In addition, it presented a higher atmospheric demand for water vapor compared to other years. On the other hand, the experiment in 2013 occurred in a less hot and humid environment, requiring a lower atmospheric demand for water vapor. The difference in the meteorological conditions between the years acted as a factor of additional variation in the results obtained for the cowpea growth variables, as there was a significant interaction between treatments and experimental year (Table 3).
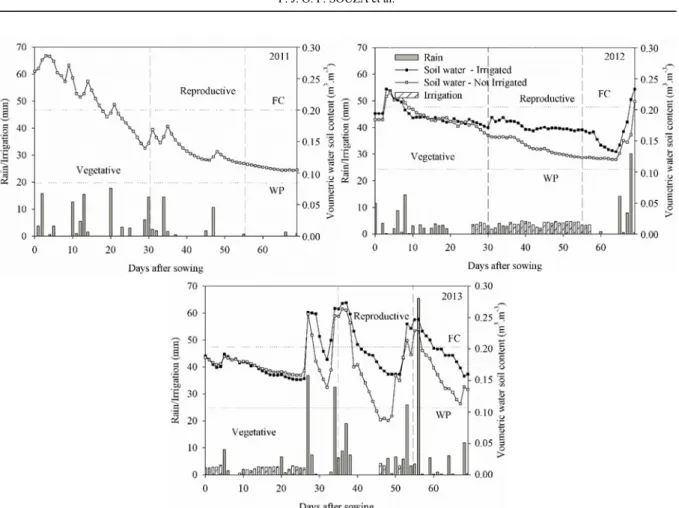
Figure 2 shows rainfall and soil moisture data during the cycle of cowpea cultivation over the three years of the experiment. Although the experiment was carried out in the season with the lowest rainfall, in order to be able to submit the cowpea to the absence of water in the reproductive phase, some precipitation was observed, mainly during the vegetative phase and at the end of the crop cycle. This was especially the case for the year 2013, in which a greater amount of rain was observed (Figure 2). Under these conditions, the irrigation blade was corrected as a function of precipitation (Figure 2).
Cumulative rainfall values between sowing
and physiological maturation (≈ 56 DAS) of 139.8 mm in 2011 and 76.56 mm in 2012 were
Rev. Caatinga
Figure 2. Rainfall and soil water variability during the experimental period. Castanhal, PA, 2011-2013.
Soil moisture remained high over the vegetative phase due to rainfall and water supply from the irrigation system; irrigation was supplied only in 2012 and 2013. Soil water content was always kept close to field capacity (Figure 2). It is noticeable that as a result of the rainfall in 2011 and 2013, soil water content achieved levels higher than field capacity on several occasions. Thus, the occurrence of a water surplus favoured plant growth (Table 1).
Based on this analysis and considering the physical characteristics of the soil, we conclude that the experiment of 2011 offered adequate conditions of water supply due to the greater capacity of water storage in the soil (Table 1). Thereby, water was the main factor impacting cowpea growth, especially during the reproductive phase when the rain had
ceased, since, unlike in the other years where irrigation was provided, water requirements were exclusively met by water stored in the soil.
Despite the occurrence of rain during the reproductive phases of 2012 and 2013, the absence of irrigation caused a significant reduction in soil
water content in the non-irrigated treatment. Thus, a
cumulative water deficit of 76 and 26 mm was observed in both years, respectively (Table 2). After 30 DAS, when the treatments were started in 2012 and 2013, a continuous reduction in soil water content was observed. This was most likely the result of the natural exhaustion of soil reserves due to the absence of irrigation and, at a rate higher than observed in 2011, due to the lower water storage capacity in the new area (Table 1).
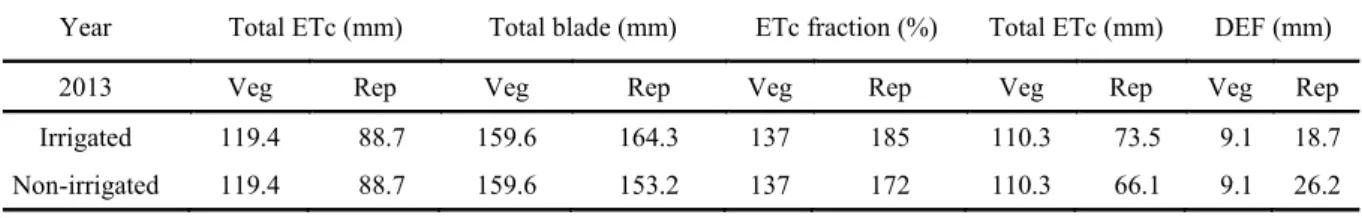
Table 2. Water consumption, applied water blade (rain + irrigation) and water deficit in the experiment (DEF).
Year Total ETc (mm) Total blade (mm) ETc fraction (%) Total ETc (mm) DEF (mm)
2011 Veg Rep Veg Rep Veg Rep Veg Rep Veg Rep
Irrigated - - - -
Non-irrigated 100.9 114.8 107.5 32.3 106 28 89.7 59.5 11.2 49.6
2012 Veg Rep Veg Rep Veg Rep Veg Rep Veg Rep
Irrigated 83.3 106.2 84.9 103.7 102 98 76.1 102.9 7.2 3.2
Table 2. Continuation.
During the vegetative period (0 to 30 DAS), total water demand, represented by ETc, was 100.9, 83.3 and 119.4 mm in 2011, 2012 and 2013, respectively. During the reproductive phase (up to 56 DAS), total water demand was 114.8, 106.2 and 88.7 mm, respectively. This variation generated a total demand from sowing to physiological maturation of 215.7, 189.5 and 208.1 mm, respectively. According to Andrade Junior et al. (2003), cowpea requires a minimum of 300 mm of precipitation in order to obtain high production values in some regions of Brazil, without the need for irrigation.
Throughout the experiment in 2011, cowpea received a total water (rain) amount that corresponded to 64.8% of its demand for evapotranspiration. In contrast, in the experiment if 2012, this total was 189.5 mm (≈ 99.5% of total ETc) and 93.7 mm (≈ 50.3% of total ETc) of water, in the
irrigated and non-irrigated treatment, respectively;
which was offered by both rainfall and irrigation (in the irrigated treatment) (Table 2).
In the 2011 experiment, water was only supplied through rainfall and corresponded to approximately 106 and 28% of the water demand in the vegetative and reproductive phases, respectively. However, although the plantation had received only 28% of its water demand in the reproductive phase, the higher water storage capacity in the soil resulted in a lower water deficit than that observed in 2012, which corresponded to 50 mm.
The occurrence of only 10.4 mm of rain in the reproductive phase of 2012 indicates that cowpea received no more than 10% of its demand for the phenological phase in this treatment. This fact caused a water deficiency of 76 mm at this stage, corroborating the hypothesis that the crop experienced water stress during its most critical
phase in the non-irrigated treatment of 2012. Similar
results have been observed by Nascimento et al. (2011).
The experiment in 2013, on the other hand, occurred under conditions where water supply exceeded the demand. Although the year 2013 experienced high rainfall, which provided 185 and 172%, respectively, of the demand for ETc during
the reproductive phase in the irrigated and
non-irrigated treatment, a large part of the rainfall
occurred on consecutive days, such as the rainfall
events between 30 and 40 DAS and 50 and 60 DAS (Figure 2). This suggests that excess and, subsequently, surface drainage occurred; this would also have greatly contributed to soil moisture values, which were well above field capacity. The water capacity of the experimental area was only 36.5 mm for the effective depth of the root system considered (25 cm).
However, within the reproductive period of 2013, in particular between 38 and 48 DAS, the absence of rainfall caused a rapid consumption of soil water, due to the physical characteristics of the soil (Table 1), leading to critical soil humidity. Nonetheless, there was a subsequent increase in soil water content as a result of concentrated rain events between 50 and 60 DAS. This may have contributed to the observed difference in biomass and LAI between the treatments evaluated in this year. When analysing the cycle as a whole, the volume of water available from rainfall and irrigation exceeded the water demand of the crop (Table 2), preventing water lack. However, in spite of the higher rainfall in 2013, water deficits of 19 and 26 mm were observed during the reproductive phase in the irrigated and
non-irrigated treatments, respectively (Table 2).
There was a significant effect (p < 0.05) of the interaction between treatments (irrigated and
non-irrigated) and experimental year for most of the
analysed variables, except for total biomass at 41 DAS (Table 3). The data in Table 3 indicate that
it is not possible to analyse the results together, except for the total biomass right after the beginning of the treatments, since the experimental period contributed to the differences found for each treatment.
Figure 3 presents the biomass production of the above ground parts under dry and irrigated conditions for the three experimental years. It is noticeable that cowpea did not show any difference in biomass production during the vegetative phase because there was no water limitation. However, there was a significant difference (test F, p < 0.05) shortly after the beginning of the treatments (Figure 3a). In the experimental site and under optimal water conditions, cowpea can reach a mean total biomass
of 176.6 ± 4.18 g m-2 up to the onset of flowering.
During this phase, a water deficit of 11, 7 and 9 mm was observed for 2011, 2012 and 213, respectively.
Year Total ETc (mm) Total blade (mm) ETc fraction (%) Total ETc (mm) DEF (mm)
2013 Veg Rep Veg Rep Veg Rep Veg Rep Veg Rep
Irrigated 119.4 88.7 159.6 164.3 137 185 110.3 73.5 9.1 18.7
Rev. Caatinga
Table 3. Summary of the combined variance analysis of total shoot biomass at 41 DAS (g m-2), final total biomass (g m-2),
leaf area index (LAI) at physiological maturation and productivity (g m-2) as a function of the irrigated and non-irrigated condition and the experimental year (2012 and 2013).
*Significant at 5% probability by test F.
In 2012 and 2013, under irrigation, albeit with
a slight water deficit during the growth cycle of 10.4 mm and 27.8 mm, respectively, final average
total biomass production reached 528.31 ± 32.41 and
538.45 ± 32.41 gm-2, respectively. When analysing
the significant effect of water availability (F test, p < 0.05), it can be observed that final biomass production of the above ground part was reduced by 54.3% in 2012 and by 26.4% in 2013. This was most likely due to the water deficiency in the reproductive phase (Table 2), which reached 241.2 ± 14.83 and
396.06 ± 46.57 g m-2 under natural field conditions
in 2012 and 2013, respectively. Although the experiment of 2011 has occurred under dry conditions and an accumulated water deficit of
50 mm in the reproductive phase (Table 2), the final
production of total shoot biomass was
466.47 ± 5.96 g m-2, only 12.5% lower than the value
obtained under conditions of low water deficiency in 2012 and 2013 (Table 2).
This slight difference demonstrates the importance of the soil water storage capacity in plant water supply, since the experimental area in 2011 had a greater storage capacity (Table 1). As storage capacity was associated with the high water supply by rainfall in the vegetative phase and some rain events occurring in the reproductive phase, a certain amount of water remained in the soil at levels above the critical humidity for a long period within the reproductive phase (Figure 2).
Figure 3. Total biomass of the aerial part of cowpea under irrigated and non-irrigated conditions in Castanhal, PA, in 2011
(a), 2012 (b) and 2013 (c).
Source of
variation DF
Mean squares
Biomass at 41 DAS Final biomass LAI Productivity Treatment 1 58,320* 553,300* 26.81* 67,090*
Experiment 1 5,234* 81,640* 10.43* 11,410*
Interaction 1 275 62,790* 6.84* 3,450*
Water stress interferes with several physiological plant processes. In the case of cowpea, other authors have observed significant reductions of physiological processes as a result of water stress, such as stomatal conductance and leaf water potential (MENDES et al., 2007; NASCIMENTO et al., 2011) as well as total chlorophyll content of leaves (BASTOS et al., 2011). As a consequence, the weight of the aerial parts is reduced.
Although cowpea is classified as tolerant to both water deficiency and excess soil water (NASCIMENTO et al., 2011), Mendes et al. (2007) demonstrated that the absence of water replacement in the reproductive phase at intervals of 7 to 8 days significantly reduced the number of pods produced in two cultivars. Also, water stress at intervals of 15 to 20 days in the vegetative phase delayed the onset of flowering. Bastos et al. (2011), studying the cultivar Tracuateua – 192, found significant differences in the number of pods per plant, number of grains per pod, weight of 100 grains and productivity when
subjected to moderate water stress in the reproductive phase.
Figure 4 shows the LAI variability along the growth cycle in the three experimental years. It is noticeable that cowpea significantly reduces its leaf area to the smallest sign of lack of soil water (Figure 4b). This has also been observed by Bastos et al. (2011, 2012). The maximum LAI value reached by cowpea in the irrigated treatment was 3.29 ± 0.15 at 48 DAS in 2012 and 3.26 ± 0.19 at 50 DAS in 2013, during the reproductive phase. The opposite was
observed in the non-irrigated treatment, where the
maximum value was only 1.75 ± 0.09 in 2012 and 2.84 ± 0.17 in 2013, about 4 and 9 days after the start of treatments, respectively. Leaf area production in 2011 reinforces the hypothesis that cowpea has developed under adequate conditions of water availability, although it was a dryland condition and in the presence of accumulated water deficiency of 50 mm, which is lower than that observed in 2012.
Figure 4. Leaf area index of cowpea under irrigated and non-irrigated conditions in Castanhal, PA, in 2011 (a), 2012 (b)
and 2013 (c).
The results found for the year 2012 show that cowpea cannot maintain leaf area production after being submitted to water stress. In addition, under these conditions and with a water deficit of 76 mm, the reduction in maximum LAI reached 47%, a value very close to that found by Bastos et al. (2011) for
the same cultivar; they obtained a reduction of 44% at maximum LAI by imposing water stress to cowpea plants in the reproductive phase. The observed leaf area reduction is most likely a survival strategy to reduce transpiration surface.
Rev. Caatinga
among 20 genotypes evaluated, the cultivar
Tracuateua - 192 was intolerant to drought when
experiencing water deficit in the reproductive phase. The same authors showed that the water deficit caused a greater reduction in leaf water potential and greater stomatal closure in the cultivar, resulting in a greater reduction in photoassimilate production and, subsequently, lower productivity.
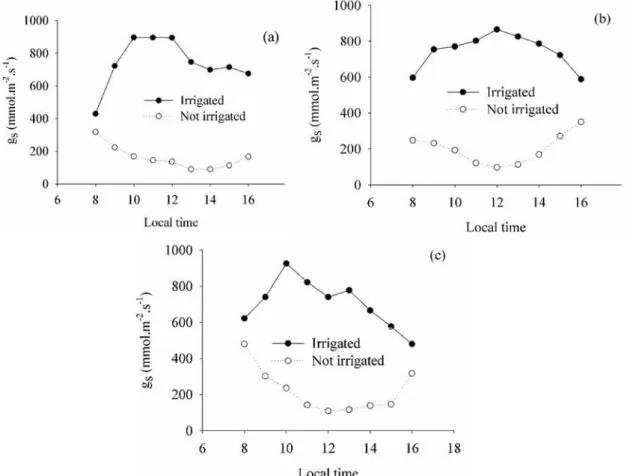
Figure 5 shows the diurnal curve of stomatal
conductance at 41, 47 and 58 DAS (phases
R7-R8-R9), corresponding to 11, 15 and 28 days
after the beginning of the water restriction in the
non-irrigated treatment during the experiment in
2012. In phase R7, the maximum gs value for the
irrigated treatment was 896.03 mmol m-2 s-1, between
10 a.m. and mid-day. Maximum conductance in the
non-irrigated condition occurred early in the day, at
around 8 a.m., reaching only 319.16 mmol m-2 s-1,
showing a continuous reduction in the following hours. The same pattern of temporal variability of gs was observed in phases R8 and R9, with significant
differences (t-test, p < 0.05) between irrigated and
non-irrigated conditions.
Figure 5. Diurnal cycle of stomatal conductance of irrigated and non-irrigated cowpea in the R7 (a), R8 (b) and R9 (c)
phases in the 2012 experiment.
Regarding the lower water supply during the
reproductive phase in the non-irrigated treatment in
2012 and the presence of an accumulated water deficit of 76 mm in the phase, stomatal conductance
ranged from 161.56 to 221.11 mmol m-2 s-1. This
corresponded to an average reduction of 73.45% compared to the irrigated treatment (Table 3). Previous studies on cowpea in different regions have shown that the variability of gs was similar to that observed in this study, with water availability being the main source stomatal conductance variation (DUTRA et al., 2015; MENDES et al. 2007).
Results of Paiva et al. (2005), obtained for the common bean, show that reduced water supply caused a decrease in stomatal conductance in the
reproductive phase. The values ranged from
610.89 to 726.64 mmol m-2 s-1 when irrigated at 40%
of the consumption of available soil water and from
256.01 to 440.85 mmol m-2 s-1 when exposed to
environmental conditions of the experiment.
Considering that stomatal control is an important characteristic of plants to limit water loss through reduction in stomatal conductance and consequent stomatal closure (PAIVA et al., 2005), we expected significant reductions in production and productivity of cowpea in the region. Such reductions were expressed by the low values of
conductance under the non-irrigation conditions of
Table 4. Mean values of stomatal conductance (gs, in mmol m2 s-1), volumetric soil water content (US, in m3 m-3) and accumulated water deficit (DEF, in mm) for irrigated and non-irrigated cowpea plants between the 41 and 58 DAS (Phase
R7 to R9) in 2012.
*Significant difference between the means in the column by Student's t-test (p < 0.05). Values in parenthesis correspond to
standard error.
There was a significant decrease (F test, p < 0.05) in productivity due to the lower supply of
water in the non-irrigated treatment (Table 5) in
2012 and 2013. Cowpea yield between 2011 and
2013 ranged from 1,115 to 1,396 kg ha-1. Such yields
are common for this region (OLIVEIRA et al., 2011) and occur as a response to a total water supply (rain + irrigation) of 140 and 324 mm up to physiological maturation, corresponding to the values of total water deficit in the reproductive phase between 50 and 3 mm. Similar results have been found by Freire Filho et al. (2009), who studied the yields of several cultivars used in the northeast of the
state Para in order to identify the most promising
ones. They obtained a variation of 638 to
1,782 kg ha-1 for the cultivar BR3
-Tracuteua. Bastos
et al. (2002) evaluated the cultivar BR14-Mulato in
the state of Piauí and obtained a productivity of
1,140 to 2,056 kg ha-1.
Although some cowpea cultivars have a tolerance to water deficit, decreased water availability in the reproductive phase caused a significant reduction in the yield of the cultivar Tracuateua. This confirmed its sensitivity to water lack, as also verified by Nascimento et al. (2011) and Bastos et al. (2011).
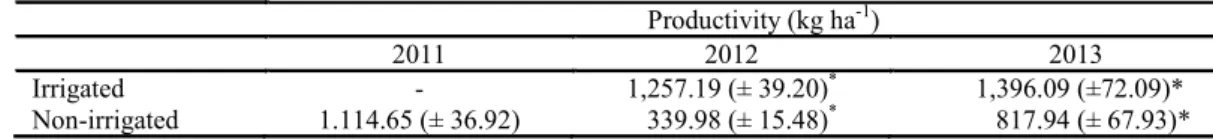
Table 5. Grain productivity (PG) of cowpea, cultivar Tracuateua, under irrigated and non-irrigated cultivation.
*Significant difference between the means in the column by the F test (p < 0.05). Values in parenthesis correspond to standard error.
The lack of irrigation in the reproductive phase was responsible for a significant reduction in cowpea productivity (72 and 41%, F test, p < 0.05)
in 2012 and 2013, providing only 340 and
818 kg ha-1 of the final yield, respectively (Table 4).
These results corresponded to a water supply (rainfall) during the reproductive phase of only 10.4 mm, which is about 10% of the total ETc of the phase (106.2 mm) in 2012 and of 153 mm in 2013 that caused the presence of a water deficit in the 76 and 26 mm phases, respectively (Table 2).
Although the water supply in 2013 was higher than the water demand of this phase, it occurred on three to four consecutive days. Thereby, a water surplus due to the soil water capacity was generated. Then, within about nine days without any rain, between 39 and 47 DAS, soil moisture reached a critical value (Figure 2). This is in agreement with the results by Mendes et al. (2007), who demonstrated that the absence of water replacement in the reproductive phase, at intervals of 7 to 8 days, significantly reduces the number of pods produced by some cowpea cultivars. Nascimento et al. (2011) obtained an average reduction of 60% in the productivity of different cowpea cultivars by
reducing water supply from 300 to 190 mm in the Northeast of Brazil.
Maximum cowpea yields in Brazil vary
between 1,400 and 2,900 kg ha-1 and are generally
obtained under water availability conditions ranging from 370 to 570 mm (ANDRADE JUNIOR et al., 2002). The difference observed in the productivity of cowpea was caused by the lower water availability of the soil. Water deficits lead to a reduction in productivity by impeding photosynthesis, as water is responsible for stomatal opening and maintenance of transpiration. Such processes are essential for carbon dioxide to become permeable in the leaf mesophyll (BUCHANAN; GRUISSEM; JONES, 2000).
The results of Nascimento et al. (2011) show that the same cultivar used under the climatic conditions in the northeastern part of Brazil can
reach a productivity of 1,024 kg ha-1 when grown
under full irrigation. On the other hand, however, it
has a low productivity (171 kg ha-1) when it
experiences a moderate water deficit in the reproductive phase, associated to 75% depletion of available water in the soil.
Studies on cowpea in Roraima, conducted by Oliveira et al. (2011), corroborate the grain yield
Phases R7 R8 R9
gs US DEF gs US DEF gs US DEF
Irrigated 742.0
*
(± 42.8)
0.168* (± 0.02)
1.8 745.78* (± 27.74)
0.171* (± 0.016)
2.5 705.60* (± 38.9) 0.164* (± 0.02) 3.4 Non-irrigated 161.6* (± 21.0) 0.14* (± 0.03)
21.7 199.53* (± 24.25)
0.132* (± 0.017)
40.5 221.11* (± 36.1)
0.123* (± 0.02)
84
Productivity (kg ha-1)
2011 2012 2013
Irrigated - 1,257.19 (± 39.20)* 1,396.09 (±72.09)*
Rev. Caatinga
results obtained in this experiment. According to the authors, the lowest irrigation depth (187 mm) reduced grain yield by 43.3%, considering that the highest water blade, 273 mm, yielded a productivity
of 1,420.51 kg ha-1.
According to Coelho (2003), adequate water supply by irrigation enables the plant to maintain a continuous flow of water and nutrients from the soil to the leaves. This benefits the growth, flowering and fruiting of the plant, thus resulting in an increased productivity. Considering the fact that high water deficits drastically affect the performance of some cowpea cultivars (NASCIMENTO; PEDROSA; SOBRINHO, 2004), further studies are needed to evaluate the level of water deficit tolerated by the cultivar BR3 Tracuateua under the climatic conditions of Northeastern Brazil.
CONCLUSIONS
The cultivar BR3 Tracuateua showed significant productivity reduction as a response to water deficit in the reproductive phase, between
26 and 76 mm imposed in the non-irrigated
treatment.
Maximum leaf area index was reduced by 13% under water deficit in the reproductive phase of 26 mm and by 47% when submitted to a water deficit of 76 mm.
Availability of soil water associated with low water deficiencies between 11 and 34 mm contributed to the production of total biomass and grain yield of cowpea in the study region.
ACKNOWLEDGEMENTS
We thank the National Council for Scientific and Technological Development (CNPq, Brazil) for its financial support to this research through the
Universal Project (process n° 483402/2012-5) and
the stipend of research productivity for the first
author (process n° 311145/2013-2). In addition, we
acknowledge Professor Eduardo Tavares Paes from UFRA for his assistance with statistical analysis.
REFERENCES
ALLEN, R. G. et al. Evapotranspiration information reporting: I. Factors governing measurement
accuracy. Agricultural Water Management,
Amsterdam, v. 98, n. 6, p. 899-920, 2011.
ANDRADE, F. N. et al. Estimativas de parâmetros
genéticos em genótipos de feijão-caupi avaliados
para feijão fresco. Revista Ciência Agronômica,
Fortaleza, v. 41, n. 2, p. 253-258, 2010.
ANDRADE JÚNIOR, A. S. et al. Métodos de estimativa da evapotranspiração de referencia diária
para Parnaíba e Teresina, Piauí. Revista Brasileira
de Agrometeorologia, Santa Maria, v. 11, n. 1, p. 63-68, 2003.
ANDRADE JÚNIOR, A. S. et al. Níveis de irrigação
na cultura do feijão caupi. Revista Brasileira de
Engenharia Agrícola e Ambiental, Campina
Grande, v. 6, n. 1, p. 17-20, 2002.
BASTOS, E. A. et al. Evapotranspiração e
coeficiente de cultivo do feijão-caupi do vale do
Gurguéia, PI. Irriga, Botucatu, v. 13, n. 2, p.
182-190, 2008.
BASTOS, E. A. et al. Identification of cowpea
genotypes for drought tolerance. Revista Ciência
Agronômica, Fortaleza, v. 42, n. 1, p. 100-107,
2011.
BASTOS, E. A. et al. Parâmentros de crescimento do feijão caupi sob diferentes regimes hídricos. Engenharia Agrícola, Jaboticabal, v. 22, n. 1, p. 43-50, 2002.
BASTOS, E. A. et al. Parâmetros fisiológicos e
produtividade de grãos verdes do feijão-caupi sob
déficit hídrico. Water Resources and Irrigation
Management, Cruz das Almas, v. 1, n. 1, p. 31-37, 2012.
BENINCASA, M. P. Análise de crescimento de
plantas: noções básicas. 2. ed. Jaboticabal, SP: Funep. 2003. 41 p.
BORGES, P. R. S.et al. Distribuição de massa seca e rendimento de feijão caupi inoculadas com rizóbio
em Gurupi, Revista Caatinga, Mossoró, v. 25, n. 1,
p. 37-44, 2012.
BUCHANAN, B. B.; GRUISSEM, W.; JONES, R. L. Biochemistry & Molecular Biology of Plants. 1. ed. Rockville: American Society of Plant Physiologists, 2000, 1408 p.
CARVALHO, A. F. U. et al. Nutritional ranking of 30 Brazilian genotypes of cowpeas including determination of antioxidant capacity and vitamins. Journal of Food composition and Analysis, San
Diego, v. 26, n. 1-2, p. 81-88, 2012.
COELHO, A. M. Fertirrigação em culturas anuais
produtoras de grãos. Revista Trimestral da
Associação Brasileira de Irrigação e Drenagem,
Brasilia. v. 2, n. 58, p. 44-54, 2003.
DUTRA, A. F. et al. Parâmetros fisiológicos e
componentes de produção de feijão-caupi cultivado
Ciências Agrárias, Recife, v. 10, n. 2, p. 189-197,
2015.
FARIAS, V. D. S. et al. Temperaturas basais e necessidade térmica para o ciclo de desenvolvimento
do feijão-caupi. Enciclopédia Biosfera, Goiânia, v.
11, n. 21, p. 1781-1792, 2015.
FREIRE FILHO. R. et al. BRS Milênio e BRS
Urubuquara: cultivares de feijão-caupi para a região
Bragantina do Pará. Revista Ceres, Viçosa, v. 56, n.
6, p. 749-752, 2009.
MENDES, R. M. S. et al. Relações fonte-dreno em
feijão-de-corda submetido à deficiência hídrica.
Revista Ciência Agronômica, Fortaleza, v. 38, n. 1,
p. 95-103, 2007.
MODESTO JUNIOR, M. S.; ALVES, R. N. B.
Custo de produção de feijão-caupi cultivado em
sistemas de parcagem e tração animal, no município
de Tracuateua, Pará. Amazônia. Ciência &
Desenvolvimento, Belém, v 8, n 15, p. 7-16, 2012.
NASCIMENTO, J. T., PEDROSA, M. B., SOBRINHO, J. T. Efeito da variação de níveis de água disponível no solo sobre o crescimento e produção de feijão caupi, vagens e grãos verdes. Horticultura Brasileira, Brasilia, v. 22, n. 2, p. 174-177. 2004.
NASCIMENTO, S. P. et al. Tolerância ao déficit
hídrico em genótipos de feijão-caupi. Revista
Brasileira de Engenharia Agrícola e Ambiental,
Campina Grande, v. 15, n. 8 p. 853-860. 2011.
NEVES, A. L. R. et al. Acumulação de biomassa e
extração de nutrientes por plantas de feijão-de-corda
irrigadas com água salina em diferentes estádios de
desenvolvimento. Ciência Rural, Santa Maria, v. 39,
n. 3, p. 758-765, 2009.
OLIVEIRA, G. A. et al. Resposta do feijão-caupi as
lâminas de irrigação e as doses de fósforo no cerrado
de Roraima. Revista Ciência Agronômica,
Fortaleza, v. 42, n. 4, p. 872-882, 2011.
PAIVA, A. S. et al. Condutância estomática em folhas de feijoeiro submetido a diferentes regimes de
irrigação. Engenharia Agrícola, Jaboticabal, v. 25,
n. 1, p. 161-169, 2005.
PEREIRA, A. R. Simplificando o balanço hídrico de
Thornthwaite e Mather. Bragantia, Campinas, v. 64,
n. 2, p. 311-313, 2005.
RAMOS, H. M. M. et al. Estratégias ótimas de
irrigação do feijão-caupi para produção de grãos
verdes. Pesquisa Agropecuária Brasileira, Brasília,
v. 47, n. 4, p. 576-583, 2012.
REBELLO, F. K.; COSTA, A. J. G.; FIGUEIRÓ, C. L. M. Conjuntura da produção e comercialização do feijão caupi no Nordeste Paraense: safra 2010. Contexto Amazônico, Belém, v. 4, n. 18, p. 1-4,
2011.
SILVA, J. A. L.; NEVES, J. A. Componentes de produção e suas correlações em genótipos de feijão
caupi em cultivo de sequeiro e irrigado. Revista
Ciência Agronômica, Fortaleza, v. 42, n. 3, p. 702-713, 2011.
TENÓRIO, A. R. M. et al. Mapeamento dos solos