Detection of shellfish toxins from scallops in Guangzhou seafood market
Huazhang L (1), Wen-xue L (1), Quan-xin Z (1), Guang-yu Y (1), Jun-tao L (1), Li M (2), Wei Z (1)
(1) Department of Toxicology, Guangzhou Center for Disease Control and Prevention, Guangzhou, Guangdong, People’s Republic of China; (2) Department of Preventive Medicine, Guangzhou Military Region CDC, Guangzhou, People’s Republic of China.
Abstract: To evaluate scallop safety in the Guangzhou seafood market, contents of shellfish toxins in adductor muscle, mantle skirts, gills and visceral mass of scallops were examined using enzyme-linked immunosorbent assay (ELISA) and mouse unit assay. The results showed that: paralytic shellfish poisoning contents were up to 37.44 mg/100 g by ELISA and 319.99 MU/100 g by mouse unit assay, which did not exceed the limits of national standards (80 mg/100g and 400 MU/100 g); the contents of diarrhetic shellfish poisoning were 142.04 mg/100g and 0.2 MU/100 g, which exceeded the national standard limits (60 mg/100g); neurotoxic shellfish poisoning was undetectable; the contents of amnesic shellfish poisoning reached 220.12 mg/100g (no limit value could be referred to) . In addition, these poisons were present mainly in visceral mass and gills rather than adductor muscle and mantle skirts, suggesting that these toxins accumulate in a tissue-specific manner.
Key words: paralytic shellfish poisoning, diarrheic shellfish poisoning, neurotoxic shellfish poisoning, amnesic shellfish poisoning, enzyme-linked immunosorbent assay, mouse unit assay.
O
R
IG
IN
A
L
P
A
P
E
R
INTRODUCTION
Shellfish mainly feed on single-celled marine algae (1). Thus, toxins in some algae can be accumulated or metabolized by shellfish and eventually transformed into shellfish toxins (2-6). There are four types of shellfish toxins: paralytic shellfish poisoning (PSP), diarrhetic shellfish poisoning (DSP), neurotoxic shellfish poisoning (NSP) and amnesic shellfish poisoning (7). Among these, PSP and DSP are most harmful to humans (8).
In recent years, scallop poisoning incidents have occurred frequently in Guangdong province and in its neighbors Hong Kong and Macao. To evaluate the situation of scallop contamination and to oversee the safety of the scallop market, the above four shellfish toxins in scallops from the Guangdong seafood market were examined using
enzyme-linked immunosorbent assay (ELISA). Besides, PSP and DSP were also detected with mouse unit assay in order to verify the ELISA results.
MATERIALS AND METHODS
Materials and Reagents
PSP, DSP, NSP and ASP detection kits were purchased from Abraxis BioScience (USA). Fresh scallops originated from Shandong and Zhanjiang were obtained from the Guangzhou seafood market.
Experimental Animals
by asphyxiation with CO2. The experimental protocol followed the “Declaration of Helsinki” and was approved by the Ethics Committee for Animal Experimentation of the Guangzhou Center for Disease Control and Prevention.
Sample Preparation
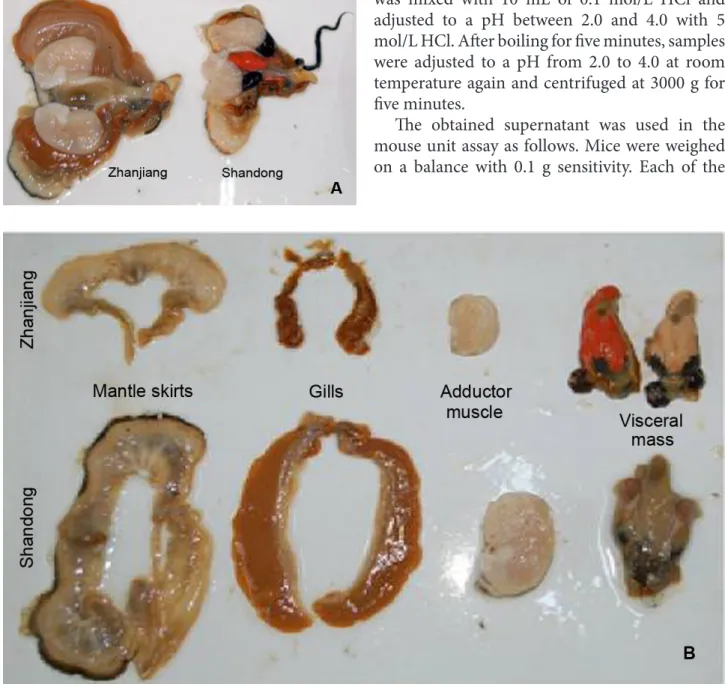
Shells of scallops were opened by cutting along the adductor muscles. Their adductor muscles, gills, mantle skirts and visceral masses were collected, homogenized and stored at –20°C for future use. Figure 1 shows the opened scallops and their organs. The scallops from the Shandong sea area were larger than those from the sea area of Zhanjian although both of them belong
to the same species of Placopecten megallancius, according to the identification report by South China Sea Institute of Oceanography, Chinese Academy of Sciences.
PSP Measurement
PSP was measured by ELISA and mouse unit assay. For ELISA, 10 g of obtained homogenate was mixed with 10 mL of 0.1 mol/L HCl. After being boiled for five minutes under stirring, the mixture was centrifuged at 3500 g for ten minutes at 4°C. The obtained supernatant was adjusted to pH 4.0 using 5 mol/L HCl. After undergoing 1000-fold dilution with sample buffer, the PSP level was detected using the ELISA kit according to the protocol provided by the manufacturer.
For the mouse unit assay, 10 g of homogenate was mixed with 10 mL of 0.1 mol/L HCl and adjusted to a pH between 2.0 and 4.0 with 5 mol/L HCl. After boiling for five minutes, samples were adjusted to a pH from 2.0 to 4.0 at room temperature again and centrifuged at 3000 g for five minutes.
The obtained supernatant was used in the mouse unit assay as follows. Mice were weighed on a balance with 0.1 g sensitivity. Each of the
three control mice was intraperitoneally injected with 1 mL of HCL with pH ranging from 2.0 to 4.0 and another three mice were similarly injected with 1 mL of supernatant. Their performance and death time were recorded. If at least one mouse died within seven minutes after injection, the experiment was performed one more time to determine the toxicity of the sample. If any mouse died in less than five minutes, the experiment was performed again using diluted sample until a mouse died within 5 to 7 minutes.
The content of PSP was calculated as the number of mouse units per 100 g of scallop based on the recorded death time of each mouse, correlation curve of PSP death time to mouse unit and body weight correction, as shown in Table 1 (6, 9). Data were expressed as mean value of three experiments.
DSP Measurement
DSP was measured by ELISA and mouse unit assay. For ELISA, 1 g of homogenate was extracted with 6 mL of 80% (v/v) methanol and centrifuged at 3500 g for ten minutes at 4°C. The pellet was repeatedly extracted with 2 mL of 80% methanol until the total volume of the collected supernatant reached 10 mL. The supernatant was then filtered through a 0.45-mm membrane,
diluted 1000-fold and used for ELISA analysis according to the manufacturer’s protocol.
For the mouse unit assay, 200 g of homogenate was extracted with 600 g acetone under stirring and filtered with a Büchner funnel. The pellet was re-extracted with acetone twice. The extracts were combined together, transferred into a 500-mL flask and vacuum concentrated at 56°C until an oily liquid surface appeared. The concentrated liquid was then completely transferred into a separatory funnel by washing the sticky wall with 100 to 200 mL of ether and a small amount of water. After removal of the water layer (lower), the ether fraction was washed twice with half the volume of water.
The collected ether fraction was concentrated in a vacuum in a 250-mL conical flask at 35°C and further concentrated in a 100-mL conical flask in a vacuum to remove the ether. The obtained sample was diluted with 1% Tween-60 saline solution to 10 mL. One milliliter of the solution corresponded to 20 g of the original sample and was used as the starting solution in mouse unit assay performed similarly to the description above except that the assay was repeated if all three mice died within 24 hours and the sample was diluted with 1% Tween-60 saline solution after extensive shaking. One mouse unit was defined as the amount of toxin that leads to the death of a mouse weighing 16 to 20 g (6). DSP content was calculated according to Table 1, which lists the required minimum injection amount and maximum dilution fold that cause the death of two or more mice within 24 hours (10).
ASP Measurement
Four grams of homogenate was mixed with 16 mL of 50% (v/v) aqueous methanol solution and vortexed for one minute. The supernatant was obtained by centrifugation at 3000 g for ten minutes at room temperature and used to measure ASP content using an ELISA kit according to the manufacturer’s protocol.
NSP Measurement
One gram of homogenate was mixed with 90% aqueous methanol solution and vortexed for one minute. The supernatant was collected by centrifugation at 3000 g for ten minutes at room temperature and used to measure ASP content using an ELISA kit according to the manufacturer’s protocol.
Table 1. Minimum injection amount and maximum dilution fold of shellfish poisonings that caused the death of two or more mice within 24 hours
Sample volume (2)Injection value (MU/g)Mouse unit
Stock
solution 1.0 0.05
Stock
solution 0.5 0.1
1/2 diluent 1.0 0.1
1/2 diluent 0.5 0.2
1/4 diluent 1.0 0.2
1/4 diluent 0.5 0.4
1/8 diluent 1.0 0.4
1/8 diluent 0.5 0.8
1/16 diluent 1.0 0.8
Table 2. PSP contents measured by ELISA in scallops from Shandong and Zhanjiang
Sample
Adductor muscle (mg/100 g)
Visceral mass (mg/100 g)
Mantle skirts (mg/100 g)
Gill
(mg/100 g) Province
1 0.65 ± 0.13 1.59 ± 0.32 0.9 ± 0.18 3.81 ± 0.76 Zhanjiang
2 2.24 ± 0.45 23.1 ± 4.62 8.05 ± 1.61 11.23 ± 2.25 Zhanjiang
3 1.19 ± 0.24 18.63 ± 3.73 4.91 ± 0.98 19.07 ± 3.81 Zhanjiang
4 1.04 ± 0.21 23.21 ± 4.64 10.85 ± 2.17 9.66 ± 1.93 Zhanjiang
5 0.66 ± 0.13 6.27 ± 1.25 1.39 ± 0.28 2.07 ± 0.40 Zhanjiang
6 0.44 ± 0.09 4.37 ± 0.87 2.17 ± 0.43 21.38 ± 4.28 Zhanjiang
7 0.86 ± 0.17 24.58 ± 4.92 9.86 ± 1.97 6.59 ± 1.32 Zhanjiang
8 0.33 ± 0.07 8.56 ± 1.71 2.66 ± 0.53 20.17 ± 4.03 Zhanjiang
9 0.52 ± 0.1 33.28 ± 6.66 3.65 ± 0.73 10.52 ± 2.1 Zhanjiang
10 0.33 ± 0.07 17.31 ± 3.46 1.81 ± 0.36 3.27 ± 0.65 Zhanjiang
11 0.61 ± 0.12 37.44 ± 7.49 3.59 ± 0.72 22.09 ± 4.4 Zhanjiang
12 2.24 ± 0.45 2.83 ± 0.57 2.83 ± 0.57 3.11 ± 0.62 Shandong
13 0.15 ± 0.03 3.11 ± 0.62 2.71 ± 0.54 5.51 ± 1.1 Shandong
14 0.29 ± 0.06 5.512 ± 1.1 2.78 ± 0.56 5.94 ± 1.19 Shandong
15 0.66 ± 0.13 5.936 ± 1.19 2.7 ± 0.54 3.55 ± 0.71 Shandong
16 0.15 ± 0.03 3.555 ± 0.71 2.82 ± 0.56 9.67 ± 1.93 Shandong
17 0.34 ± 0.07 9.67 ± 1.93 1.59 ± 0.32 3.81 ± 0.76 Shandong
RESULTS
PSP Contents
The contents of all poisonings measured by ELISA were calculated based on the standard curves. As shown in Table 2, PSP was detected in scallops from both Shandong and Zhanjiang, where samples presented levels that reached 9.67 mg/100 g and 37.44 mg/100 g, respectively, lower than the limit (80 mg/100 g) required by
Table 3. PSP contents measured by mouse unit assay in scallops from Shandong and Zhanjiang
Sample
Adductor muscle (MU/100 g)
Visceral mass (MU/100 g)
Mantle skirts (MU/100 g)
Gill
(MU/100 g) Province
1 < 175 < 175 < 175 < 175 Zhanjiang
2 < 175 197.42 < 175 < 175 Zhanjiang
3 < 175 < 175 < 175 < 175 Zhanjiang
4 < 175 198.39 < 175 < 175 Zhanjiang
5 < 175 < 175 < 175 < 175 Zhanjiang
6 < 175 < 175 < 175 182.78 Zhanjiang
7 < 175 210.11 < 175 < 175 Zhanjiang
8 < 175 < 175 < 175 < 175 Zhanjiang
9 < 175 284.48 < 175 < 175 Zhanjiang
10 < 175 < 175 < 175 < 175 Zhanjiang
11 < 175 319.99 < 175 188.05 Zhanjiang
12 < 175 < 175 < 175 < 175 Shandong
13 < 175 < 175 < 175 < 175 Shandong
14 < 175 < 175 < 175 < 175 Shandong
15 < 175 < 175 < 175 < 175 Shandong
16 < 175 < 175 < 175 < 175 Shandong
17 < 175 < 175 < 175 < 175 Shandong
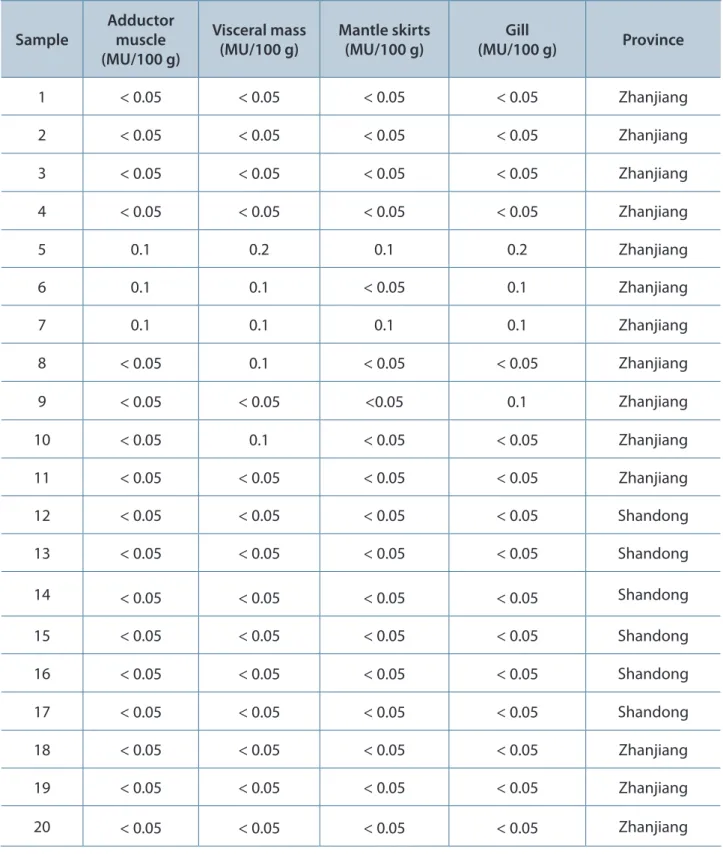
DSP Contents
DSP contents measured by ELISA are listed in Table 4. Scallops from Zhanjiang contained a higher DSP level, peaking at 142.04 mg/100 g, greater than the limit (60 mg/100 g) regulated by Chinese national standard (11). PSP content in scallops from Shandong presented a peaking level of 33.86 mg/100 g, lower than the limit. Similar to DSP, PSP also accumulated in visceral mass and gills rather than mantle skirts and adductor muscle.
Table 4. DSP contents measured by ELISA in scallops from Shandong and Zhanjiang
Sample
Adductor muscle (mg/100 g)
Visceral mass (mg/100 g)
Mantle skirts (mg/100 g)
Gill
(mg/100 g) Province
1 4.04 ± 0.81 4.31 ± 0.86 4.75 ± 0.95 4.91 ± 0.98 Zhanjiang
2 4.83 ± 0.97 33.85 ± 6.77 5.4 ± 1.08 24.08 ± 4.82 Zhanjiang
3 12.51 ± 2.5 10.16 ± 2.03 4.42 ± 0.88 14.9 ± 2.98 Zhanjiang
4 6.5 ± 1.3 8.02 ± 1.6 5.78 ± 1.16 16.71 ± 3.34 Zhanjiang
5 61.74 ± 12.35 142.04 ± 28.41 105.51 ± 21.1 142.04 ± 28.41 Zhanjiang 6 44.88 ± 8.98 112.78 ± 22.56 23.93 ± 4.79 119.43 ± 23.89 Zhanjiang 7 55.66 ± 11.13 119.43 ± 23.89 112.77 ± 22.55 74.01 ± 14.8 Zhanjiang
8 5.33 ± 1.07 55.18 ± 11.04 5.21 ± 1.04 41.74 ± 8.35 Zhanjiang
9 4.52 ± 0.9 34.54 ± 6.91 3.51 ± 0.7 55.66 ± 11.13 Zhanjiang
10 4.96 ± 0.99 52.32 ± 10.46 3.96 ± 0.79 23.93 ± 4.79 Zhanjiang
11 4 ± 0.8 37.44 ± 7.49 5.28 ± 1.06 22 ± 4.4 Zhanjiang
12 3.52 ± 0.7 11.56 ± 2.31 5.58 ± 1.12 8.97 ± 1.79 Shandong
13 5.85 ± 1.17 33.86 ± 6.77 4.31 ± 0.86 3.5 ± 0.7 Shandong
14 3.37 ± 0.67 5.34 ± 1.07 3.78 ± 0.76 7.13 ± 1.43 Shandong
15 5.14 ± 1.03 8 ± 1.6 5.46 ± 1.09 4.67 ± 0.93 Shandong
16 5.93 ± 1.19 4.8 ± 0.96 4.2 ± 0.84 3.78 ± 0.76 Shandong
17 4.92 ± 0.98 6.49 ± 1.3 5.25 ± 1.05 7.86 ± 1.57 Shandong
18 5.42 ± 1.08 6.29 ± 1.26 3.36 ± 0.67 5.42 ± 1.08 Zhanjiang
19 4.53 ± 0.91 5.15 ± 1.03 3.3 ± 0.66 5.27 ± 1.05 Zhanjiang
Table 5. DSP contents measured by mouse unit assay in scallops from Shandong and Zhanjiang
Sample
Adductor muscle (MU/100 g)
Visceral mass (MU/100 g)
Mantle skirts (MU/100 g)
Gill
(MU/100 g) Province
1 < 0.05 < 0.05 < 0.05 < 0.05 Zhanjiang
2 < 0.05 < 0.05 < 0.05 < 0.05 Zhanjiang
3 < 0.05 < 0.05 < 0.05 < 0.05 Zhanjiang
4 < 0.05 < 0.05 < 0.05 < 0.05 Zhanjiang
5 0.1 0.2 0.1 0.2 Zhanjiang
6 0.1 0.1 < 0.05 0.1 Zhanjiang
7 0.1 0.1 0.1 0.1 Zhanjiang
8 < 0.05 0.1 < 0.05 < 0.05 Zhanjiang
9 < 0.05 < 0.05 <0.05 0.1 Zhanjiang
10 < 0.05 0.1 < 0.05 < 0.05 Zhanjiang
11 < 0.05 < 0.05 < 0.05 < 0.05 Zhanjiang
12 < 0.05 < 0.05 < 0.05 < 0.05 Shandong
13 < 0.05 < 0.05 < 0.05 < 0.05 Shandong
14 < 0.05 < 0.05 < 0.05 < 0.05 Shandong
15 < 0.05 < 0.05 < 0.05 < 0.05 Shandong
16 < 0.05 < 0.05 < 0.05 < 0.05 Shandong
17 < 0.05 < 0.05 < 0.05 < 0.05 Shandong
18 < 0.05 < 0.05 < 0.05 < 0.05 Zhanjiang
19 < 0.05 < 0.05 < 0.05 < 0.05 Zhanjiang
20 < 0.05 < 0.05 < 0.05 < 0.05 Zhanjiang
ASP Contents
ASP contents measured by ELISA are listed in Table 6. As shown, ASP was detectable in visceral mass and gills, but not adductor muscle or mantle skirts of scallops from both Zhanjiang and
Table 6. ASP contents measured by ELISA in scallops from Shandong and Zhanjiang
Sample
Adductor muscle (mg/100g)
Visceral mass (mg/100g)
Mantle skirts (mg/100g)
Gill
(mg/100g) Province
1 3.17 ± 0.32 2.87 ± 0.29 2.94 ± 0.29 4.03 ± 0.4 Zhanjiang
2 10.32 ± 1.03 64.04 ± 6.4 7.1 ± 0.71 47.59 ± 4.76 Zhanjiang
3 3.49 ± 0.35 5.71 ± 0.57 3.05 ± 0.31 78.7 ± 7.87 Zhanjiang
4 3.43 ± 0.34 23.9 ± 2.39 9.5 ± 0.95 22.51 ± 2.25 Zhanjiang
5 5.3 ± 0.53 4.35 ± 0.44 3.98 ± 0.4 5.35 ± 0.54 Zhanjiang
6 5.05 ± 0.51 220.16 ± 2.2 6.03 ± 0.6 39.75 ± 3.98 Zhanjiang
7 4.95 ± 0.5 2.96 ± 0.3 3.74 ± 0.37 5.63 ± 0.56 Zhanjiang
8 3.52 ± 0.35 3.66 ± 0.37 3.42 ± 0.34 3.07 ± 0.31 Zhanjiang
9 2.53 ± 0.25 27.92 ± 2.79 1.57 ± 0.16 32.16 ± 3.22 Zhanjiang
10 2.57 ± 0.26 12.3 ± 1.23 4.36 ± 0.44 76.82 ± 7.68 Zhanjiang
11 2.17 ± 0.22 40.28 ± 4.03 1.39 ± 0.14 69.77 ± 6.98 Zhanjiang
12 3.73 ± 0.37 58.25 ± 5.83 2.09 ± 0.21 21.26 ± 2.13 Shandong
13 1.33 ± 0.13 16.89 ± 1.69 1.57 ± 0.16 8.2 ± 0.82 Shandong
14 1.7 ± 0.17 19.79 ± 1.98 2.74 ± 0.27 5.43 ± 0.54 Shandong
15 3.45 ± 0.35 19.19 ± 1.92 1.22 ± 0.12 7.9 ± 0.79 Shandong
16 4.55 ± 0.46 22.4 ± 2.24 2.69 ± 0.27 7.44 ± 0.74 Shandong
17 2.46 ± 0.25 15.41 ± 1.54 2.16 ± 0.22 7.13 ± 0.71 Shandong
18 1.19 ± 0.12 84.04 ± 8.4 2.33 ± 0.23 7.1 ± 0.71 Zhanjiang
19 2.76 ± 0.28 2.29 ± 0.23 1.23 ± 0.12 4.82 ± 0.48 Zhanjiang
Table 7. NSP contents measured by ELISA in scallops from Shandong and Zhanjiang
Sample
Adductor muscle (mg/100g)
Visceral mass (mg/100g)
Mantle skirts (mg/100g)
Gill
(mg/100g) Province
1 0.25 ± 0.08 0.35 ± 0.11 0.04 ± 0.01 0.16 ± 0.05 Zhanjiang
2 0.26 ± 0.08 0.36 ± 0.11 0.01 ± 0 0.44 ± 0.13 Zhanjiang
3 0.22 ± 0.07 0.3 ± 0.09 0.03 ± 0.01 0.14 ± 0.04 Zhanjiang
4 0.37 ± 0.11 0.52 ± 0.16 0 ± 0 0.21 ± 0.06 Zhanjiang
5 0.27 ± 0.08 0.37 ± 0.11 0.02 ± 0.01 0.13 ± 0.04 Zhanjiang
6 0.36 ± 0.11 0.51 ± 0.15 0.03 ± 0.01 0.17 ± 0.05 Zhanjiang
7 0.18 ± 0.05 0.25 ± 0.08 0.01 ± 0 0.12 ± 0.04 Zhanjiang
8 0.36 ± 0.11 0.5 ± 0.15 0.03 ± 0.01 0.16 ± 0.05 Zhanjiang
9 0.26 ± 0.08 0.36 ± 0.11 0 ± 0 0.03 ± 0.01 Zhanjiang
10 0.28 ± 0.08 0.39 ± 0.12 0.04 ± 0.01 0.03 ± 0.01 Zhanjiang
11 0.21 ± 0.06 0.3 ± 0.09 0.01 ± 0 0.02 ± 0.01 Zhanjiang
12 0.42 ± 0.13 0.59 ± 0.18 0.02 ± 0.01 0.04 ± 0.01 Shandong
13 0.22 ± 0.07 0.3 ± 0.09 0 ± 0 0 ± 0 Shandong
14 0.23 ± 0.07 0.33 ± 0.1 0.01 ± 0 0.03 ± 0.01 Shandong
15 0.12 ± 0.04 0.17 ± 0.05 0.22 ± 0.07 0.04 ± 0.01 Shandong
16 0.31 ± 0.09 0.44 ± 0.13 0.61 ± 0.18 0.02 ± 0.01 Shandong
17 0.16 ± 0.05 0.22 ± 0.07 0.19 ± 0.06 0 ± 0 Shandong
18 0.27 ± 0.08 0.38 ± 0.11 0.29 ± 0.09 0.03 ± 0.01 Zhanjiang
19 0.12 ± 0.04 0.17 ± 0.05 0.19 ± 0.06 0.03 ± 0.01 Zhanjiang
20 0.27 ± 0.08 0.38 ± 0.11 0.24 ± 0.07 0.02 ± 0.01 Zhanjiang
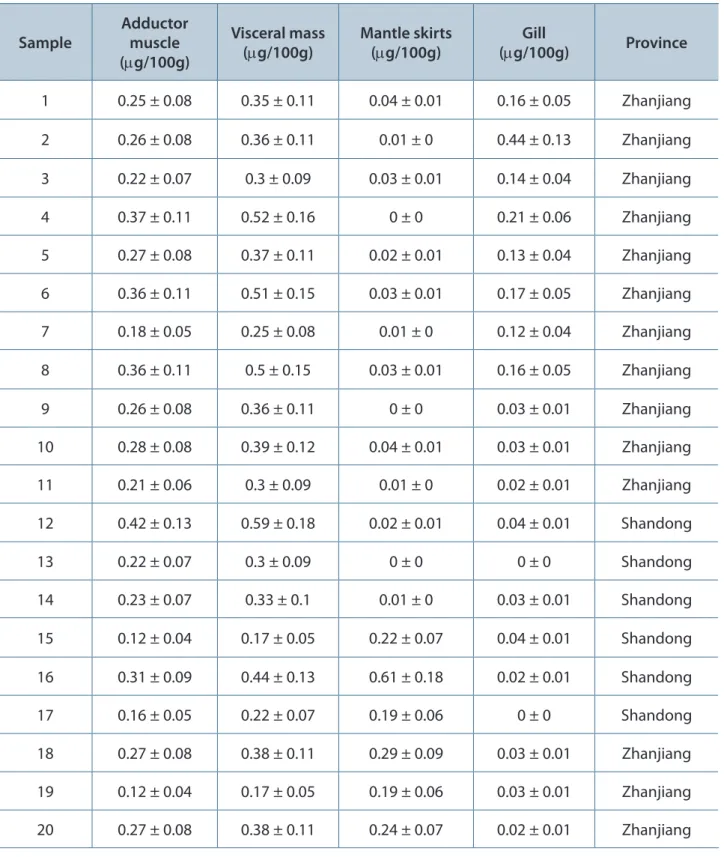
NSP Contents
Table 7 shows that NSP contents in scallops from Zhanjiang and Shandong were lower than the detection limit, 0.45 mg/100 g, indicating that the scallops contained little or no NSP.
DISCUSSION
alone (12). Among them, PSP and DSP are most common toxins (8, 12, 13). In particular, PSP has been considered to be among the most harmful and widely distributed toxins worldwide (14). The toxins are generally accumulated in shellfish bodies. But depending on the species, they are accumulated in different tissues and organs. For example, toxins can be rapidly accumulated in mussels and scallops, mostly in the digestive tract, ventricle, mantle skirts or gills. Some toxins can remain in shellfish for months or even years (15).
Today, shellfish toxins are normally examined by means of the mouse unit assay, ELISA, or high performance liquid chromatography (HPLC). Mouse unit assay is the designated standard method for detection of shellfish poisonings in Japan and other countries with a high incidence of shellfish poisoning. Although it is technically easy to master and does not require specialized equipment, the method is quite complex operatively and lacks specificity; in another words, it cannot distinguish among different type of toxins (16-18).
HPLC can accurately and quantitatively identify various components of toxins. However, the method is limited by a lack of standard materials and it requires expensive equipment, so that it is not suitable for large-scale screening. Compared with the above two methods, ELISA is very specific, highly sensitive and rapid, and requires a very small amount of sample. Therefore, it permits simultaneous examination of many samples, obtains results in a very short period and is suitable for rapid screening of shellfish toxins (19).
In the present study, we first conducted preliminary screening using ELISA and further reevaluated the results by the mouse unit assay to ensure their accuracy and reliability (20). We found that PSP was accumulated mainly in the visceral mass and gills of scallops; only small amounts were accumulated in mantle skirts, but none was detected in adductor muscle. In contrast, DSP was accumulated not only in adductor muscle and mantle skirts but also in gills and visceral mass at high levels, especially in the latter two areas. Like PSP, ASP was only accumulated in visceral mass and gills at very high levels, but not in mantle skirts or adductor muscle. NSP was undetectable in scallops from Shandong and Zhanjiang. The differences in toxin
distributions between the tissues might be due to the different functions of the organs or tissues. For example, visceral mass and gills are the main organs to metabolize the toxins, while mantle skirts and adductor muscle are irrelevant to toxin metabolization. Furthermore, such tissue and organ variability may be on account of differences in blood supply or lipid content, which must be validated in future research.
In addition, shellfish toxins present diverse geographical distribution. Scallops from Shandong had very low shellfish toxin levels, whereas those from Zhanjiang were much higher, some several times above the national limit, which may be related to such aspects of the local marine environments as climatic condition, sanitation status, water eutrophication, algae species, algae quantity and even contamination.
To reduce the impact of shellfish poisonings on human health, it is recommended that, firstly, people should not eat visceral mass or gills since they might accumulate very high toxin levels, and secondly, mantle skirts and adductor muscle should be cleaned and boiled thoroughly before eating (7). In addition, a sound monitoring system should be established to monitor red tide in order to prevent accumulation of shellfish toxins in scallops caused by environmental pollution.
COPYRIGHT
© CEVAP 2011
SUBMISSION STATUS Received: October 28, 2010.
Accepted: January 25, 2011.
Abstract published online: January 26, 2011.
Full paper published online: February 28, 2011.
CONFLICTS OF INTEREST
There is no conflict.
FINANCIAL SOURCE
National High Technology Research and Development Program of China (863 Program, 2006AA02A311), Guangdong Science and Technology Department (93085) and Guangzhou municipal bureau of Science and Technology (2009Z1-E061) provided the financial grants.
ETHICS COMMITTEE APPROVAL
Guangzhou Center for Disease Control and Prevention, Guangzhou, People’s Republic of China.
CORRESPONDENCE TO
WEI ZHU, Department of Toxicology, Guangzhou Center for Disease Control and Prevention, Guangzhou, Guangdong, 510080, People’s Republic of China. Phone: 86-20-36545123, Email: zhuyc126@126.com.
REFERENCES
1. Torgersen T, Lindegarth S, Ungfors A, Sandvik M. Profiles and levels of fatty acid esters of okadaic acid group toxins and pectenotoxins during toxin
depuration. Part I: brown crab (Cancer pagurus).
Toxicon. 2008;52(3):407-17.
2. Moustafa A, Loram JE, Hackett JD, Anderson DM, Plumley FG, Bhattacharya D. Origin of saxitoxin biosynthetic genes in cyanobacteria. PLoS One. 2009; 4(6):e5758.
3. Rundberget T, Gustad E, Samdal IA, Sandvik M, Miles CO. A convenient and cost-effective method for monitoring marine algal toxins with passive samplers. Toxicon. 2009;53(5):543-50. 4. Jiang TJ, Wang DZ, Niu T, Xu YX. Trophic transfer
of paralytic shellfish toxins from the cladoceran (Moina mongolica) to larvae of the fish (Sciaenops
ocellatus). Toxicon. 2007;50(5):639-45.
5. Torgersen T, Miles CO, Rundberget T, Wilkins AL. New esters of okadaic acid in seawater and
blue mussels (Mytilus edulis). J Agric Food Chem.
2008;56(20):9628-35.
6. Selwood AI, Ginkel R, Wilkins AL, Munday R, Ramsdell JS, Jensen DJ, et al. Semisynthesis of S-desoxybrevetoxin-B2 and brevetoxin-B2, and assessment of their acute toxicities. Chem Res Toxicol. 2008;21(4):944-50.
7. Berenguer JA, Gonzalez L, Jimenez I, Legarda TM, Olmedo JB, Burdaspal PA. The effect of commercial processing on the paralytic shellfish poison (PSP) content of naturally-contaminated
Acanthocardia tuberculatum L. Food Addit
Contam. 1993;10(2):217-30.
8. Fleming LE, Easom J, Baden D, Rowan A, Levin B. Emerging harmful algal blooms and human
health: Pfiesteria and related organisms. Toxicol
Pathol. 1999;27(5):573-81.
9. AOAC. Official methods of analysis of AOAC.
18th ed. Gaithersburg, MD: AOAC International,
2005.
10. Combes RD. The mouse bioassay for diarrhetic shellfish poisoning: a gross misuse of laboratory animals and of scientific methodology. Altern Lab Anim. 2003;31(6):595-610.
11. General Administration of Quality Supervision, Inspection and Quarantine of the People’s Republic of China. Safety Qualification for Agricultural Product – Safety Requirement for Non-environmental Pollution Aquatic Products (GB18406.4-2001). Beijing: China Standard Press; 200. p. 69-70.
12. Viviani R. Eutrophication, marine
biotoxins, human health. Sci Total Environ. 1992;Suppl:631-62.
13. Reboreda A, Lago J, Chapela MJ, Vieites JM, Botana LM, Alfonso A, et al. Decrease of marine toxin content in bivalves by industrial processes. Toxicon. 2010;55(2-3):235-43.
14. Lehane M, Fidalgo Sáez MJ, Magdalena AB, Ruppén Cañás I, Díaz Sierra M, Hamilton B, et al. Liquid chromatography – multiple tandem mass spectrometry for the determination of ten azaspiracids, including hydroxyl analogues in shellfish. J Chromatogr A. 2004;1024(1-2):63-70. 15. Blanco J, Mariño C, Martín H, Acosta CP.
Anatomical distribution of diarrhetic shellfish
poisoning (DSP) toxins in the mussel Mytilus
galloprovincialis. Toxicon. 2007;50(8):1011-8.
16. Draisci R, Croci L, Giannetti L, Cozzi L, Lucentini L, De Medici D, Stacchini A. Comparison of mouse bioassay, HPLC and enzyme immunoassay methods for determining diarrhetic shellfish poisoning toxins in mussels. Toxicon. 1994; 32(11):1379-84.
17. Usleber E, Donald M, Straka M, Martlbauer E. Comparison of enzyme immunoassay and mouse bioassay for determining paralytic shellfish poisoning toxins in shellfish. Food Addit Contam. 1997;14(2):193-8.
18. Inami GB, Crandall C, Csuti D, Oshiro M, Brenden RA. Feasibility of reduction in use of the mouse bioassay: presence/absence screening for saxitoxin in frozen acidified mussel and oyster
extracts from the coast of California with in vitro
methods. J AOAC Int. 2004;87(5):1133-42. 19. Turner AD, Norton DM, Hatfield RG, Morris
S, Reese AR, Algoet M, et al. Refinement and extension of AOAC Method 2005.06 to include additional toxins in mussels: single-laboratory validation. J AOAC Int. 2009;92(1):190-207. 20. Garet E, González-Fernández A, Lago J, Vieites