and Bone M eal Produced in the State of M inas Gerais
ABSTRACT
The present st udy invest igat ed t he chem ical com posit ion and metabolizable energy levels of ten meat and bone meals (M BM ) produced in M inas Gerais state (Experiment I) and evaluated the grow th performance of broilers fed w ith diets containing those M BM (Experiment II). In the first experiment, energy values (apparent metabolizable energy [AM E] and corrected apparent metabolizable energy [AM En]) of ten different M BM w ere determined using the traditional method w ith total collection of excreta. Four hundred forty 21 day-old Hubbard broilers w ere used. A reference corn and soybean meal-based diet w as replaced in 20% by the feed containing M BM to be tested. A completely randomized experimental design w as used w ith eleven treatments (one reference diet and ten M BM ), four repetitions per treatment and 10 birds per repetition (5 males and 5 females). In the second experiment, five M BM s from the ten analyzed in Experiment 1 w ere used as phosphorus source and compared to a diet containing bicalcium phosphate. The grow th performance of the broilers fed w ith these diets w as analyzed, considering tw o ages of the onset of M BM inclusion in the diet (1 or 7 days of age). One-day-old Hubbard broilers (1,320 birds) w ere housed in 44 plot s w it h 30 birds per experimental unit. The experiment consisted of 11 treatments in a 5x2 factorial arrangement, w ith five sources of M BM , tw o ages for the onset of inclusion, and a reference treatment w ithout addition of M BM . The results obtained show ed a great variation in the chemical composition and apparent metabolizable energy of the evaluated meals. No significant differences w ere found on the performance of broilers fed diets w ith different M BM or the diet w ith bicalcium phosphate as phosphorus source. The performance of broilers w as not significantly influenced by the onset of M BM inclusion in the diets.
INTRODUCTION
During the last years, beef cattle production in Brazil has increased, w hich resulted in an higher production of slaughter by-products that can be used in animal feeding. The meat and bone meal (M BM ) can be considered t he main slaught er by-product , because of t he great est proportion of materials and residues that cannot be used in human nutrition and are thus used to produce M BM . M inas Gerais State has contributed for the increase in the production of this ingredient because it has one of the most important bovine herds of Brazil.
Now adays, poultry industry consumes most of the M BM produced in that state. M BM is considered to be a good source of amino acids, as w ell as a source of minerals and vitamins. For a long time, M BM has been used mainly as a source of high quality protein, an essential raw material to elaborate diets for animals in need of protein w ith high
Antonio Gilberto Bertechini
Depto. de Zootecnia - Universidade Federal de Lavras Caixa Postal 37
37200-000 - Lavras - M G - Brasil
E-mail: [email protected] M ail Address
Keyw ords
Broilers, ingredient , m eat and bone m eal, metabolizable energy, Salmonella
Sartorelli SA1
Bertechini AG2
Fassani EJ3
Kato RK3
Fialho ET2
1-M aster of Science (Animal Production)
2Profº Depto. de Zootecnia UFLA, Lavras -M G - Brasil
3-Ph.D student - Depto. de Zootecnia – UFLA/ CAPES, Lavras - M G - Brasil
Aut hor(s)
biological value. Besides, it also contains phosphorus, an im port ant m ineral in anim al m et abolism . The increase in soybean m eal ut ilizat ion result ed in a decrease in the use of M BM as the main protein source. Thus, it became the first choice as a phosphorus source, due to the high cost of the inorganic sources for that mineral. In spite of the great use of M BM in chicken diets, the nutritional composition of the many M BM s that can be found in M inas Gerais is not yet know n. Several farms and food industries produce diets based on nutrient requirement tables compiled abroad, such as NRC (1 9 9 4 ). Never t h eless, d u e t o d if f eren t product ion and processing processes, t he chemical composit ion and energy values present ed by t hese t ables are dif f erent f rom t he values report ed by brazilian authors, such as nutrient requirements from t he Cent ro Nacional de Pesquisa em Suínos e Aves (Embrapa, 1991) and Rostagno et al. (2000).
This research w as undertaken to study the chemical and energetic compositions, presence of microorganisms an d f o reig n b o d ies, as w ell as t o evalu at e t h e perf orm ance of birds f ed diet s cont aining M BM s produced in M inas Gerais State.
M ATERIAL AND M ETHODS
Tw o exp erim en t s u sin g b ro iler ch ick en s w ere conducted. Experim ent 1 det erm ined t he chem ical composition and metabolizable energy (M E), and the presence of microorganisms and foreign bodies in M BM s produced in M inas Gerais State using an assay w ith one-day-old broilers.
Exp erim en t 2 w as co n d u ct ed t o evalu at e t h e performance of broilers fed w ith 5 different M BM s that had been analyzed in Experiment 1, at 2 different ages of inclusion onset (1 and 7 days). The M BM s chosen w ere according to the standard classification of the Divisão de Fiscalização de Alim ent os para Anim ais (Difisa, 1989). M BM percentage in the diets w as adjusted so that equal phosphorus levels w ere supplemented to all treatments .
Experiment 1 used 440 Hubbard broilers aging 21 days and housed randomly in 44 cages in batteries. The birds w ere given 11 experimental diets: one reference diet (Table 1) and 10 experimental diets in w hich 20% of the experimental diet w as substituted by the diets cont aining t he M BM s. A com plet ely random ized experimental design w as used, w ith 4 repetitions per treatment, and 10 birds per repetition (5 of each sex). M ean body w eight w as 690 g w hen they w ere housed. After 3 days of pre-experimental period, feces w ere
collected for 5 days, using the total collection method. The average minimum and maximum t emperat ures regist ered during t he t rial w ere 20.0 and 31.5oC,
respectively.
Dry matter, crude protein, ash, ether extract, calcium and M BM w ere evaluated according AOAC (1990), and gross energy w ere determined in calorimeter “ Parr” 1271 model.
Apparent metabolizable energy (AM E) and corrected apparent metabolizable energy (AM En) of the M BM s w ere determined according to M atterson et al. (1965).
Th e ch em ical co m p o sit io n o f t h e ref eren ce an d experimental diets is show n in Table 2.
M icrobiological analysis w ere performed according to the methods described by the American Public Health Association (Speck, 1984), and microscopic evaluations
Table 1 – Composition of the basal diet – Experiment 1.
Ingredients %
Corn 68.627
Soybean meal 27.800
Vegetal oil 0.300
Limestone 1.000
Dicalcium phosphate 1.600
Iodized salt 0.385
DL-methionine 0.113
M ineral premix1 0.050
Vitamin premix2 0.100
Zinc bacitracin 0.025
Total 100.000
Calculated composition3
Dry matter (% ) 89.16
Protein (% ) 18.51
Calcium (% ) 0.867
Available phosphorus (% )4 0.400
Gross energy (kcal/kg) 4,434
1 - M ineral premix, levels/kg: Fe, 100g; Cu, 12g; M n, 160g; Zn, 120g; I, 2.5g; Co, 0.8g; Se, 0.3g.
2 - Vitamin premix, levels/kg: Vitamin A, 12,800,000 IU; Vitamin D3, 3,000,000 IU; Vitamin E, 10g; Vitamin K3, 3g; Thiamin, 2,2g; Riboflavin, 7g; Pyridoxine, 3g; Vitamin B12, 16mg; Niacin, 45g; Calcium pantothenate, 15g; Folacin, 1.3g; Biotin, 70mg; Antioxidant, 30g. 3 - Analysis done at Laborat ório de Pesquisa Animal f rom t he Departamento de Zootecnia - UFLA.
Table 2 – Composition1,2 of experimental diets – Experiment 1.
1 - As-fed basis.
2 - Analysis done at Laboratório de Pesquisa Animal from the Departamento de Zootecnia - UFLA.
Treatment Dry matter (% ) Protein (% ) Calcium(% ) Total phosphorus (% ) Gross energy (kcal/ kg)
T1 89.52 21.80 4.06 2.31 4,149
T2 88.76 22.11 4.04 2.19 4,107
T3 88.28 22.79 3.36 1.78 4,380
T4 88.32 23.02 3.54 1.75 4,317
T5 90.27 23.17 3.50 1.70 4,266
T6 89.82 23.48 3.27 1.93 4,261
T7 89.81 24.32 2.84 1.36 4,464
T8 90.14 25.15 3.09 1.56 4,313
T9 90.01 25.69 3.36 1.57 4,364
T10 90.15 26.07 2.42 1.71 4,413
T11 89.16 18.51 0.86 0.40 4,434
Table 3 – Treatments used in the Experiment 2 according the M BM sources and inclusion onset.
1 - M BM 03 (39.94% CP and 7.31% P). B= M BM 05 (41.84% CP and 6.91% P). C= M BM 06 (43.36% CP and 8.09% P). D= M BM 08 (51.73% CP and 6.24% P). E= M BM 09 (54.40% CP and 6.25% P).
Treatment M BM sources Inclusion onset (days of age)
T1 A1 1
T2 A 7
T3 B 1
T4 B 7
T5 C 1
T5 C 7
T7 D 1
T8 D 7
T9 E 1
T10 E 7
T11 -
-w ere m ade according t o t he m et hod approved by t h e A m erican A sso ciat io n o f Feed M icro sco p ist s (A A FM , 1992).
In Experiment 2, 1320 one-day-old Hubbard broiler chicks were used. The birds were weighed (mean=41.5 g), allocated in 44 cages (4 per treatment) w ith 30 birds
p er exp er im en t al u n it y. A ver ag e m in im u m an d m axim u m t em p erat u res w ere 1 8 .0 an d 2 8 .4 ºC, respectively. During the experimental phase, birds w ere g iven w at er an d f eed ad lib it u m. A ran d o m ized
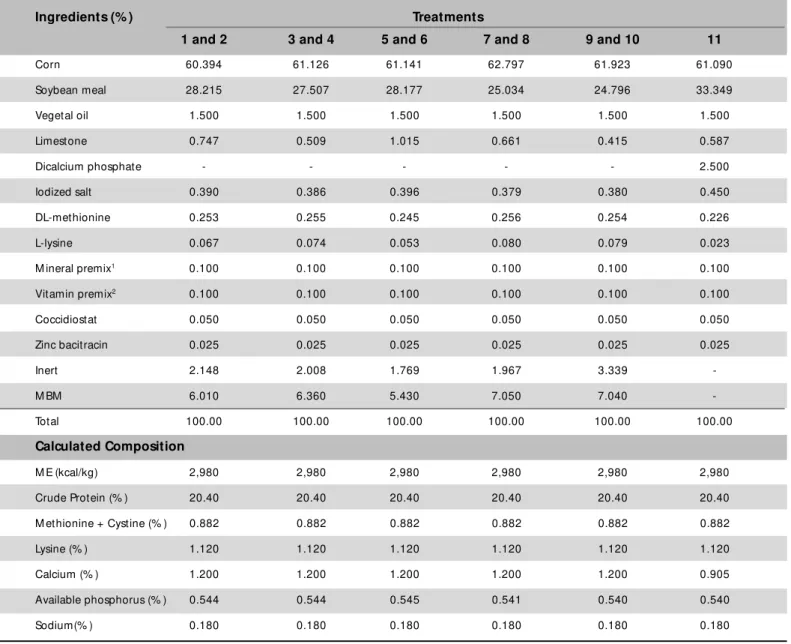
Table 4 – Composition of starter basal diets (1 to 21 days) – Experiment 2.
1- M ineral premix, levels/kg: Fe, 100g; Cu, 12g; M n, 160g; Zn, 120g; I, 2.5g; Co, 0.8g; Se, 0.3g.
2- Vitamin premix, levels/kg: Vitamin A, 12,800,000 IU; Vitamin D3, 3,000,000 IU; Vitamin E, 10g; Vitamin K3, 3g; Thiamin, 2.2g; Riboflavin, 7g; Pyridoxine, 3g; Vitamin B12, 16mg; Niacin, 45g; Calcium pantothenate, 15g; Folacin, 1.3g; Biotin, 70mg; Antioxidant, 30g.
Ingredients (% ) Treatments
1 and 2 3 and 4 5 and 6 7 and 8 9 and 10 11
Corn 60.394 61.126 61.141 62.797 61.923 61.090
Soybean meal 28.215 27.507 28.177 25.034 24.796 33.349
Vegetal oil 1.500 1.500 1.500 1.500 1.500 1.500
Limestone 0.747 0.509 1.015 0.661 0.415 0.587
Dicalcium phosphate - - - 2.500
Iodized salt 0.390 0.386 0.396 0.379 0.380 0.450
DL-methionine 0.253 0.255 0.245 0.256 0.254 0.226
L-lysine 0.067 0.074 0.053 0.080 0.079 0.023
M ineral premix1 0.100 0.100 0.100 0.100 0.100 0.100
Vitamin premix2 0.100 0.100 0.100 0.100 0.100 0.100
Coccidiostat 0.050 0.050 0.050 0.050 0.050 0.050
Zinc bacitracin 0.025 0.025 0.025 0.025 0.025 0.025
Inert 2.148 2.008 1.769 1.967 3.339
-M B-M 6.010 6.360 5.430 7.050 7.040
-Total 100.00 100.00 100.00 100.00 100.00 100.00
Calculated Composition
M E (kcal/kg) 2,980 2,980 2,980 2,980 2,980 2,980
Crude Protein (% ) 20.40 20.40 20.40 20.40 20.40 20.40
M ethionine + Cystine (% ) 0.882 0.882 0.882 0.882 0.882 0.882
Lysine (% ) 1.120 1.120 1.120 1.120 1.120 1.120
Calcium (% ) 1.200 1.200 1.200 1.200 1.200 0.905
Available phosphorus (% ) 0.544 0.544 0.545 0.541 0.540 0.540
Sodium(% ) 0.180 0.180 0.180 0.180 0.180 0.180
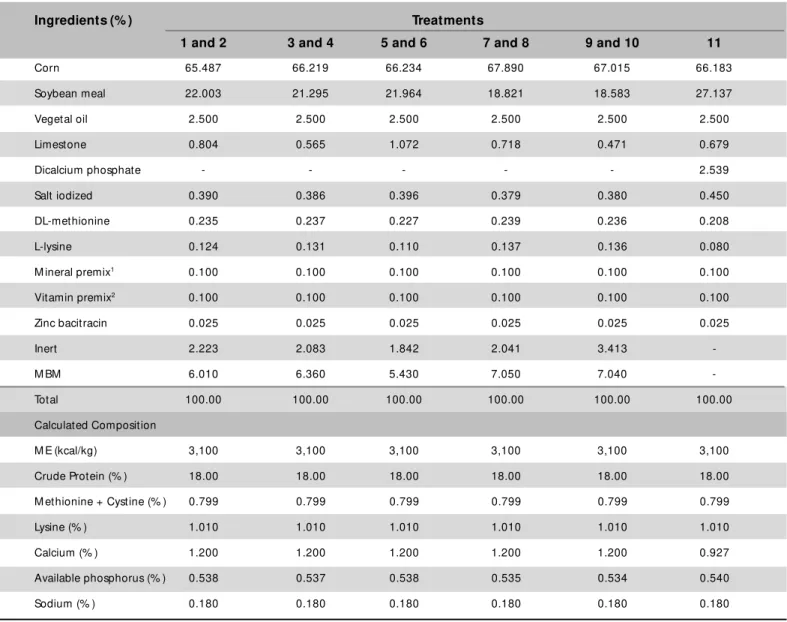
source and 2 ages for the onset of M BM inclusion in t he diet , 1 or 7 days) and an ext ra t reat ment w it h dicalcium phosphate as phosphorus source (Table 3). Inclusion level of M BM in the diets w as calculated so that all treatments had the same amount of phosphorus provided. The composition of the experimental starter diet s (1 t o 21 days) is show n in Table 4 and t he composition of the grow er diets (21 to 42 days) is show n in Table 5. Diets w ere formulated using the ingredient
composition tables of Rostagno et al. (2000), except
the metabolizable energy values of M BM s, w hich w ere determined in Experiment 1.
Weight gain (g), feed intake (g) and feed conversion (g/g) w ere evaluated and data w ere statistically analyzed using the softw are SANEST (Statistical Analysis System) as described by Sarries et al. (1992). Performance means
Table 5 – Composition of grow er basal diets (21 to 42 days) – Experiment 2.
1- M ineral premix, levels/kg: Fe, 100g; Cu, 12g; M n, 160g; Zn, 120g; I, 2.5g; Co, 0.8g; Se, 0.3g.
2 - Vitamin premix, levels/kg: Vitamin A, 12,800,000 IU; Vitamin D3, 3,000,000 IU; Vitamin E, 10g; Vitamin K3, 3g; Thiamin, 2.2g; Riboflavin, 7g; Pyridoxine, 3g; Vitamin B12, 16mg; Niacin, 45g; Calcium pantothenate, 15g; Folacin, 1.3g; Biotin, 70mg; Antioxidant, 30g.
Ingredients (% ) Treatments
1 and 2 3 and 4 5 and 6 7 and 8 9 and 10 11
Corn 65.487 66.219 66.234 67.890 67.015 66.183
Soybean meal 22.003 21.295 21.964 18.821 18.583 27.137
Vegetal oil 2.500 2.500 2.500 2.500 2.500 2.500
Limestone 0.804 0.565 1.072 0.718 0.471 0.679
Dicalcium phosphate - - - 2.539
Salt iodized 0.390 0.386 0.396 0.379 0.380 0.450
DL-methionine 0.235 0.237 0.227 0.239 0.236 0.208
L-lysine 0.124 0.131 0.110 0.137 0.136 0.080
M ineral premix1 0.100 0.100 0.100 0.100 0.100 0.100
Vitamin premix2 0.100 0.100 0.100 0.100 0.100 0.100
Zinc bacitracin 0.025 0.025 0.025 0.025 0.025 0.025
Inert 2.223 2.083 1.842 2.041 3.413
-M B-M 6.010 6.360 5.430 7.050 7.040
-Total 100.00 100.00 100.00 100.00 100.00 100.00
Calculated Composition
M E (kcal/kg) 3,100 3,100 3,100 3,100 3,100 3,100
Crude Protein (% ) 18.00 18.00 18.00 18.00 18.00 18.00
M ethionine + Cystine (% ) 0.799 0.799 0.799 0.799 0.799 0.799
Lysine (% ) 1.010 1.010 1.010 1.010 1.010 1.010
Calcium (% ) 1.200 1.200 1.200 1.200 1.200 0.927
Available phosphorus (% ) 0.538 0.537 0.538 0.535 0.534 0.540
Sodium (% ) 0.180 0.180 0.180 0.180 0.180 0.180
RESULTS AND DISCUSSION
Experiment 1
Chemical composition (Table 6) and the presence of contaminants (Table 7) w ere different among the M BM s an alysed in M in as Gerais st at e. Co n sid erin g t h e contamination by M esophilus, molds and yeasts, all samples w ere classified as of good quality according to the criteria established by Andriguetto et al. (1990).
Coliforms w ere found in tw o M BM samples (Table 7). According to the considered criteria (Andriguetto et al.,
1990), 80% of the M BM s w ere w ithin the acceptable
range for that characteristic. Salmonella contamination
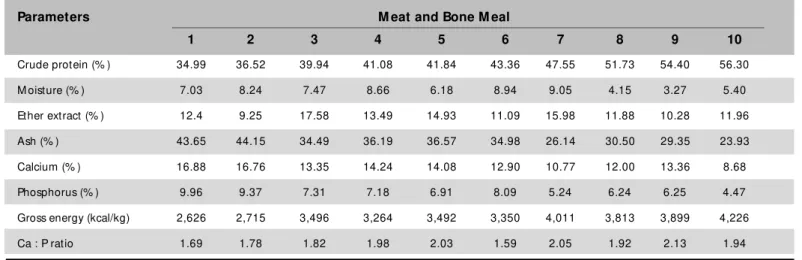
Table 6 – Chemical composition1,2 and gross energy values of the M BM - Experiment 1.
1- As-fed basis.
2 - Analysis done at Laboratório de Pesquisa Animal from the Departamento de Zootecnia - UFLA.
Parameters M eat and Bone M eal
1 2 3 4 5 6 7 8 9 10
Crude protein (% ) 34.99 36.52 39.94 41.08 41.84 43.36 47.55 51.73 54.40 56.30
M oisture (% ) 7.03 8.24 7.47 8.66 6.18 8.94 9.05 4.15 3.27 5.40
Ether extract (% ) 12.4 9.25 17.58 13.49 14.93 11.09 15.98 11.88 10.28 11.96
Ash (% ) 43.65 44.15 34.49 36.19 36.57 34.98 26.14 30.50 29.35 23.93
Calcium (% ) 16.88 16.76 13.35 14.24 14.08 12.90 10.77 12.00 13.36 8.68
Phosphorus (% ) 9.96 9.37 7.31 7.18 6.91 8.09 5.24 6.24 6.25 4.47
Gross energy (kcal/kg) 2,626 2,715 3,496 3,264 3,492 3,350 4,011 3,813 3,899 4,226
Ca : P ratio 1.69 1.78 1.82 1.98 2.03 1.59 2.05 1.92 2.13 1.94
Table 7 – M icrobiological1 and microscopic2 analysis of the M BM s – Experiment 1.
G: good < 106
A: Acceptable = 107
UA: Unacceptable > 107
(+): scarce. (++): moderate. (+++): abundant. (++++): full up area. M PN:M ost probable number.
1 - Analysis done at Laboratório de M icrobiologia dos Alimentos – Departamento de Ciências do Alimento - UFLA. 2 - Analysis done at Laboratório Nacional de Referência Animal (LANARA), Pedro Leopoldo, M G, Brazil.
M BM M esophillus M olt and Coliform Salmonella Hair Leather and Other
counts yeast counts (M PN) collagen
01 G G <3 Present ++ +++ Plastic (+)
02 G G 0.9 Present ++ + Absent
03 G G <3 Present ++ + Blood
04 G G <3 Present +++ +++ Vegetal Fiber
05 G G >140 Present + ++ Vegetal Fiber
06 G G <3 Absent + ++ Blood (+)
07 G G <3 Present ++ Vegetal Fiber
08 G G <3 Present + Vegetal Fiber
Plastic (+)
09 G G <3 Present + Innards (+)
10 G G <3 Present +++ Vegetal Fiber
Feather (+)
All samples w ere classif ied as meat and bone meal acco r d i n g t o t h e r eq u i r em en t s o f D i vi são d e Fiscalização de Aliment os para Animais (Dif isa, 1989), w it h phosphorus levels above 3.8% , independent of t h e p r o t ei n co n t en t . Th e m axi m u m al l o w ed calcium:phosphorus rat io is 2.2: 1 (Dif isa, 1989) and all samples f ulf illed t hat requirement . Similar result s w ere f ound by Coelho (1983) and Azevedo (1997).
The protein content of the analyzed samples should be 40 to 55% , according to Difisa (1989) and Rostagno
et al. (2000). Thus, the samples w ere graded as: M BM
type 40: samples 03, 04, 05 and 06; M BM type 45: sample 07; M BM type 50: samples 08 and 09; M BM type 55: sample 10. Samples 01 and 02 did not fit any standard. Crude protein (CP) results low er than 40% w ere also observed by Azevedo (1997) in three samples out of nine analyzed sam ples (30.47; 37.14 and 39.06% ). Sam ples w it hin t he sam e prot ein class show ed variations in the chemical composition. The variation might result from the fact that neither the equipment nor the raw material used to produce M BM have been standardized. The maximum w ater content allow ed by t he Depart ment of Agricult ure is 8.0% (Difisa, 1989). Therefore, M BM samples 02, 04, 06 and 07 have higher levels than the standard (8.24; 8.66; 8,94 and 9.04% , respectively).
The minimum ether extract value allow ed by Difisa (1989) is 8.0% , and all analyzed samples show ed values similar to the standard. According to Difisa (1989), the maximum ash values for M BM types 40, 45, 50 and 55 are 43; 36; 32 and 28% , respectively.
Samples 01 and 02 show ed higher values, 43.65 and 44.15% , respectively. How ever, crude protein levels of these samples w ere low er than the standard value (40). M BM samples 01 and 02 had crude protein values of 34.99 and 36.52% respectively.
Gross energy values (GE) varied great ly am ong samples. This w as expected due to the discrepant ash values. Sample 10 had a high GE content (4,226 kcal/ kg) as a result of t he high crude prot ein cont ent (56.30% ) and low mineral matter content (23.93% ); follow ed by sample 07 (4,011 kcal/kg), w hich did not show a high protein content, but show ed a high content of ether extract (15.98% ) and a low mineral matter level (30.50% ). A low GE content w as observed in M BM 01 (2,626 kcal/kg), probably because of the smaller protein content (34.99% ) found in the same sample together w ith one of the largest ash levels (43.65% ). Azevedo (1997) also found variable GE values (2,986 to 4,320 kcal/kg) giving strong evidence in the relation betw een GE and mineral matter.
The values of AM E found for the different M BM samples varied from 1,024 to 2,671 kcal/kg DM (Table 8). These AM E values w ere higher than the values reported in the ingredient composition table from Rostagno et al. (2000) for the same protein standard level. Analyzed
samples graded as protein standard 40 show ed AM E values from 2,032 to 2,379 kcal/kg DM w hereas the table show s 1,945 kcal/kg DM . For the standard 45, 2,671 kcal/kg DM of the analyzed sample against 2,004 kcal/kg DM of the table. For the standard 50 values from 2,025 to 2,438 kcal/kg DM against 2,227 kcal/kg DM of the table and for the standard 55 the value of 2,241 kcal/kg DM against 2,286 kcal/kg DM . The latter w as the only result low er than the values reported by Rostagno et al. (2000).
AM En values decreased af t er t hey w ere correct ed f or nit rogen balance (NB), except f or M BM 01 and 04, w hich increased f rom 1,151 t o 1,218 kcal/kg DM and 2,032 t o 2,080 kcal/kg DM , respect ively. The average A M En values obt ained in our st udy w as 98.22% of t he EM U values. Coelho (1983), Azevedo (1997) and Albino et al. (1992) also observed AM En
values low er t han AM E.
Experiment 2
The performance of the birds using the evaluated M BM s w as inside the normal values (Tables 9, 10 and 11), and no significant differences (p>0.05) w as seen
Table 8 – A M E an d A M En valu es o f t h e M BM s1 (k cal/k g
DM ±SEM2) – Experiment 1.
M BM AM E AM En
01 1,151 ± 181 1,218 ± 217
02 1,024 ± 329 980 ± 291
03 2,379 ± 83 2,344 ± 121
04 2,032 ± 100 2,080 ± 108
05 2,132 ± 287 2,076 ± 235
06 2,165 ± 449 2,075 ± 413
07 2,671 ± 125 2,604 ± 88
08 2,025 ± 536 1,987 ± 527
09 2,438 ± 35 2,437 ± 89
10 2,241 ± 292 2,092 ± 240
M ean 2,025 ± 533 1,989 ± 511
1 - M ean of 4 observations.
Table 9 – Effects of M BM sample and age of inclusion onset on body w eight – Experiment 2.
1 - NS (p>0.05).
Treatments Body w eight1 (g)
M BM Day 7 days 14 days 21 days 28 days 35 days 42 days
1 A 1 158 402 734 1,204 1,667 2,173
2 A 7 169 433 801 1,196 1,705 2,221
3 B 1 156 401 734 1,167 1,609 2,222
4 B 7 156 395 746 1,188 1,621 2,213
5 C 1 159 404 747 1,197 1,659 2,192
6 C 7 163 408 736 1,174 1,626 2,145
7 D 1 159 402 737 1,161 1,640 2,178
8 D 7 158 396 718 1,141 1,645 2,141
9 E 1 151 390 728 1,173 1,602 2,113
10 E 7 162 407 746 1,185 1,639 2,148
11 - - 156 402 746 1,186 1,662 2,184
M ean - - 159 403 743 1,179 1,643 2,175
C.V. (% ) - - 5.09 4.58 3.90 3.62 4.75 6.01
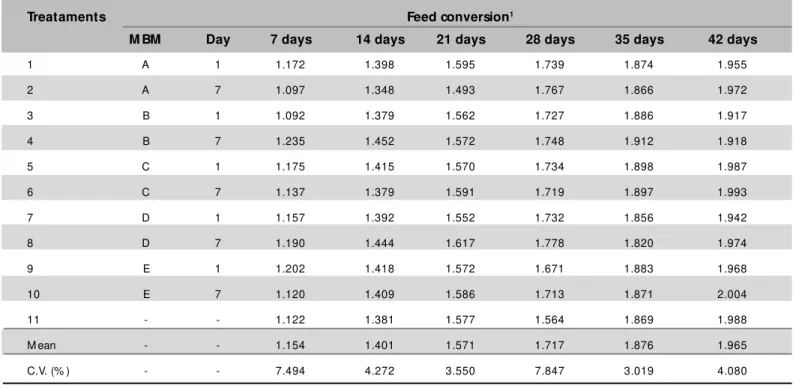
Table 10 – Effects of M BM sample and age of inclusion onset on feed conversion – Experiment 2.
1 - NS (p>0.05).
Treataments Feed conversion1
M BM Day 7 days 14 days 21 days 28 days 35 days 42 days
1 A 1 1.172 1.398 1.595 1.739 1.874 1.955
2 A 7 1.097 1.348 1.493 1.767 1.866 1.972
3 B 1 1.092 1.379 1.562 1.727 1.886 1.917
4 B 7 1.235 1.452 1.572 1.748 1.912 1.918
5 C 1 1.175 1.415 1.570 1.734 1.898 1.987
6 C 7 1.137 1.379 1.591 1.719 1.897 1.993
7 D 1 1.157 1.392 1.552 1.732 1.856 1.942
8 D 7 1.190 1.444 1.617 1.778 1.820 1.974
9 E 1 1.202 1.418 1.572 1.671 1.883 1.968
10 E 7 1.120 1.409 1.586 1.713 1.871 2.004
11 - - 1.122 1.381 1.577 1.564 1.869 1.988
M ean - - 1.154 1.401 1.571 1.717 1.876 1.965
am ong t hem at 7, 14, 21, 28, 35 and 42 days of age. These result s indicat e t hat a good nut rient supply w as provided by t he m eals. Furt herm ore, w hen t he specif ic energet ic cont ent of each M BM w as correct ed, t he perf orm ance of t he birds w as sim ilar. Regarding t he day of M BM inclusion onset in t he diet in t he init ial phase (1 or 7 days), t he f inal b o d y w eig h t o f t h e b ird s w as n o t sig n if ican t ly dif f erent (p> 0.05) bet w een ages (Table 9).
Age had no eff ect (p>0.05) on w eight gain, f eed conversion and f eed int ake at 7, 14, 21, 28, 35 and 42 days of age (Tables 9, 10 and 11, respect ively). Thus, changes in t he levels of inclusion (w it h diff erent prot ein) did not inf luence t he f inal energy cont ent , even w it h dif f erences in t he m et abolizable energy value f or t he several M BM s.
CONCLUSIONS
The analyzed M BM s show ed variat ion in chem ical com posit ion w it h high Salm onella cont am inat ion, and t he AM E and AM En values of t he M BM s w as dif f erent w it h average values of 2,025 and 1,989 kcal/kg, respect ively.
Perf orm ance of broilers f ed M BM s w as sim ilar w hen t he nut rit ion levels of t he diet w ere balanced, an d t h e M BM s u sed in t h e in it ial p h ase h ad n o
det rim ent al ef f ect on t he st udied param et ers. The source of phosphorus, M BM or dicalcium phosphat e, did not af f ect perf orm ance.
REFERENCES
Albino LFT, Rostagno HS, Tafuri M L, Silva M A. Determinação dos valores de energia metabolizável aparente e verdadeira de alguns alim ent os para aves, usando dif erent es m ét odos. Revist a da Sociedade Brasileira de Zootecnia, 1992; 26 (6): 1047-1058
AAFM - American Association of Feed M icroscopists. M anual of microscopic analysis of feedstuffs. 3ed. 1992. 211p.
Andriguetto JM , Perly L, M inardi I, Gemael A, Flemming JS, Souza GA, Filho AB. As bases e os fundamentos da nutrição animal. 4ed.
São Paulo: Nobel, 1990. 369p.
AOAC - Association of Official Analytical Chemist. Official methods of analysis. 15 ed. Arlington, 1990. 1230p.
A zeved o DM S. Fat o res q u e af et am o s valo res d e en erg ia metabolizável da farinha de carne e ossos para aves. [Dissertação de M estrado]. Viçosa:UFV, 1997. 68p.
Coelho M GR. Valores energéticos e de triptofano metabolizável de alimentos para aves, usando duas metodologias. [Dissertação de M estrado].Viçosa:UFV, 1983. 77p.
Difisa - Divisão de Fiscalização de Alimentos para Animais. Padrões of iciais de m at érias prim as dest inadas à alim ent ação anim al. Brasília:DIFISA, 1989. 40p.
Table 11 – Effects of M BM sample and age of inclusion onset on feed intake – Experiment 2.
1 - NS (p>0.05).
Treataments Feed intake1 (g)
M BM Day 7 days 14 days 21 days 28 days 35 days 42 days
1 A 1 137 505 1,099 2,022 3,050 4,172
2 A 7 142 529 1,134 2,042 3,170 4,302
3 B 1 126 497 1,083 1,951 2,960 4,165
4 B 7 142 513 1,108 2,004 3,022 4,157
5 C 1 139 512 1,108 2,005 3,070 4,271
6 C 7 137 504 1,106 1,994 3,010 4,195
7 D 1 136 501 1,079 1,938 2,962 4,152
8 D 7 140 511 1,093 1,952 2,915 4,135
9 E 1 132 494 1,079 1,935 2,940 4,080
10 E 7 135 516 1,118 2,007 2,990 4,222
11 - - 128 497 1,111 1,994 3,024 4,258
M ean - - 136 507 1,102 1,986 3,005 4,192
EM BRAPA - Empresa Brasileira Agropecuária. Tabela de composição química e valores energéticos de alimentos para suínos e aves. Embrapa-CNPSA: Concórdia, 1991; (19): 97.
M atterson LD, Potter LM , Stutz M W, Singsen EP. The metabolizable energy of feed ingredients for chickens. University of Connecticut Storrs. Agricultural Experiment Station, 1965. 11p.
NRC - National Research Council. Nutrient requirements of poultry. 9 ed. Washington: D.C., 1994. 71p.
Rostagno HS, Albino LTF, Donzele JL, Gomes PC, Ferreira AS, Oliveira RF, Lopes DC. Tabelas brasileiras para aves e suínos; Composição de alim en t o s e exig ên cias n u t ricio n ais. Viço sa:UFV – Im p ren sa Universitária. 141p. 2000.
Sarries GA, Alves M C, Oliveira JCC. SANEST – Sistema de análise estatística para DOS. Piracicaba: ESALQ/CIAGRI, 58p. 1992.