as Det ect ed by St able Carbon and Nit rogen
Isot ope Analyses of Eggs*
M ail Address
Ke yw ord s Aut hor(s)
Arrived: April/2008 Approved: August/2008
ABSTRACT
The aim of this study was to trace the inclusion of animal meals in layer diets by analyzing eggs and their fractions (yolk and albumen) using the technique of carbon and nitrogen isotopes. Two-hundred and eighty-eight (288) 73-week-old Shaver White layers, never fed animal ingredients, were randomly distributed in six treatments with six replicates each. The treatments were: control - corn and soybean meal based diet and five other experimental diets including bovine meat and bone meal (MBM); poultry offal meal (POM); feather meal (FM); feather meal and poultry offal meal (OFM), and poultry offal meal, feather meal, and meat and bone meal (MBOFM). The isotopic results were submitted to multivariate analysis of variance. Ellipses were determined through an error matrix (95% confidence) to identify differences between treatments and the control group. In the albumen and yolk of all experimental treatments were significantly different from the control diet (p < 0.05). In summary, the stable isotope technique is able to trace the animal meals included in layer feeds in the final product under these experimental conditions.
INTRODUCTION
The standard technique for the detection of animal protein in feeds is sedimentation microscopy, which is able to identify the presence of meat and bone meal concentrations as low as 0.1%, and it is based on the presence of bones in the feed (Wobeto et al., 2006).
According to Bloch Junior (2002), several methods have been proposed to identify the presence of animal byproducts in animal feeds, such as DNA hybridization, ELISA, and PCR. However, none of these methods is used to test the final product, i.e., meat, eggs, milk, etc., leaving room for fraud. Mass spectrometry, on the other hand, has been successfully used to test the authenticity and the quality of several products, such as orange juice (Bricout & Koziet, 1987; Koziet et al.,
1993), wine (Martin et al., 1988), honey (Brookes et al., 1991; White et al., 1998) and dairy products (Rossmann et al., 2000; Manca et al., 2001).
Moreover, that technique has been used to characterize and differentiate the dietary regime of Iberian pigs, allowing their classification according to diet type during finishing (González-Martin et al., 1999) and for the
certification of origin and quality of animal products (Hargin, 1996; Monin, 1998; González-Martin et al., 2001).
According to Ducatti (2004), literature presents a wide variety of applications of the isotopic dilution of a single chemical element, as carbon, for instance. However, studies on the applicability of isotopes of two different chemical elements, such as carbon versus nitrogen or deuterium versus oxygen, are rare in literature.
The isotopic ratio of 13C/12C (13C or carbon-13) associate to 15N/14N Denadai JCI
Ducatti CII
Sartori JRIII
Pezzato ACIII
Móri CI
Gottmann RIV
Mituo MAOIV
Bordinhon AMI
I I Ph.D. in Animal Science. II
UNESP Universidade Estadual Paulista -Júlio de Mesquita Filho - Instituto de Biociências - campus de Botucatu.
III
UNESP Universidade Estadual Paulista -Júlio de Mesquita Filho - Faculdade de Medicina Veterinária e Zootecnia - campus de Botucatu.
IV
Student of the Post-Graduation Program in Animal Science - UNESP - Universidade Estadual Paulista Júlio de Mesquita Filho -Faculdade de Medicina Veterinária e Zootecnia - campus de Botucatu.
JC Denadai
Centro de Isótopos Estáveis Instituto de Biociências - UNESP, s/n. Caixa Postal 510
18.618-000. Botucatu, SP, Brasil.
E-mail: [email protected]
Albumen, poultry, yolk, 13
C, 15
N.
(15N ou nitrogen-15) allowed the certification of the geographic origin and diet types in sheep (Piasentier
et al., 2003). The Center of Environmental Stable
Isotopes of UNESP, Botucatu campus, using a calculation methodology based on the equation system of two sources and two isotopes (Ducatti, 2004), has developed research studies aiming at detecting in the final product if animal byproducts were included in poultry diets.
Carrijo et al. (2006) traced in the breast muscle the
inclusion of meat and bone meal in broiler diets. Oliveira (2005) analyzed the breast muscle, keel, and tibia of broilers to identify which of these tissues would be better to trace poultry offal meal inclusion in broiler diets. Gottmann (2007) identified in broiler breast muscle the dietary inclusion of poultry offal meal in the presence of alternative ingredients (wheat midds and yeast).
Based on these studies, the technique was tested in other poultry species, such as layers and quails. Denadai et al. (2005) analyzed layer eggs produced in two different farms in the region of Bastos/SP: one used only vegetable diets, whereas the other included animal byproducts in the feeds. Those authors observed, using the double isotopic axis that (13C e 15N) eggs presented different isotopic patterns, and suggested that it was possible to detect the dietary inclusion of animal byproducts in layer eggs. Using quails, Móri et al. (2007)
detected animal byproducts used in the diets in the breast muscle, tibia and keel.
In order to improve the technique of stable 13C and 15N isotopes, the present study aimed at tracing the inclusion of animal meals (bovine meat and bone meal, poultry offal meal, and feather meal) in commercial layer diets by analyzing yolk and albumen in their eggs.
M ATERIAL AND M ETHODS
A number of 288 73-week-old Shaver White layers from UNESP, Botucatu campus, Veterinary Medicine and Animal Science School, Poultry Science sector, Edgárdia experimental farm, was used.
Birds were housed in 1.00m x 0.45m x 0.40m metal cages, equipped with independent trough feeders and drinkers placed in front of the cage. Water and feed were offered ad libitum. A lighting program of 16h light/ day was applied.
Birds were randomly distributed into six treatments with six replicates each. A replication was considered a cage housing eight birds. The experimental treatments consisted of a control diet, based on corn
and soybean meal (CT), and diets with the individual inclusion of bovine meat and bone meal (MBM), poultry offal meal (POM), or feather meal (FM) or combinations of poultry offal meal and feather meal (OFM) or bovine meat and bone meal, poultry offal meal and feather meal (MBOFM) to the control diet.
The POM, FM, OFM, and MBOFM diets were standardized for animal digestible protein content equivalent to 4.5% MBM. In addition, OFM and MBOFM mixtures received proportional inclusions of POM and FM, and MBM, POM, and FM, respectively. Animal meal digestible protein content was estimated according to the tables of Rostagno et al. (2005).
Protein, calcium, phosphorus, metabolizable energy, and amino acid contents of the feedstuffs used to manufacture the experimental diets were estimated according to Rostagno et al. (2005), and were also
chemically analyzed. POM presented 96.14% dry matter (DM); 65.54% crude protein (CP); 12.47% ether extract (EE); 14.49% mineral matter (MM); FM presented 93.26% DM, 88.18% CP, 7.92% EE, 2.25% MM; and MBM presented 93.75% DM, 45.75% CP, 8.43% EE, 48.17% MM.
The diets (Table 1) were formulated to supply birds' nutritional requirements as established by Rostagno et al. (2005) and were balanced to provide equal energy, protein, calcium, phosphorus, and methionine+cystine and lysine levels.
The yolk and the albumen were separated and placed in duly identified plastic bags, and stored at -20°C until processing.
Yolk and albumen samples were then thawed, dried in a forced-ventilation oven (Marconi - model MA 035) at 56°C for 24h (albumen) and 48h (yolk), and ground in a cryogenic mill (Spex - model 6750 freezer/mill) at -190°C. Approximately 2.0g of the sample were placed in a polycarbonate tube with a magnet bar, and immersed in liquid nitrogen in the mill. The impact between the sample and the magnet bar submitted to oscillating magnetic field (15 impacts/second) caused the sample to pulverize. The program used for sample milling consisted of pre-freezing the sample for one minute and then freezing and pulverization for three minutes. This allowed particles smaller than 60 µm to be obtained (Licatti, 1997; Rosa et al., 2002; Ducatti,
2004).
Birds were fed the experimental diets for 35 days. The experimental period was determined according to Denadai et al. (2005), who verified that total carbon
photosynthetic cycle plants using stable carbon isotope technique. On the 35th experimental period, 12 eggs per treatment (two per replicate) were collected for yolk and albumen analyses.
After milling, fat was extracted from the yolks, as fractions that have high lipid content are relatively poor in 13C as compared to low-lipid fractions (Tieszen et al., 1983). Samples were placed in duly identified filter
paper, immersed in ethylic ether (PA), and kept under temperature of 55-65ºC for 4 hours in a Soxhlet apparatus. Samples were then suspended for one hour in reconditioned ether for washing. Samples were removed from the apparatus, dried in a force-ventilation oven for one hour for ether evaporation, and milled again to homogenize them.
Samples were analyzed at the Center of Stable Isotopes of the Biosciences Institute of UNESP, Botucatu campus. For isotopic ratio determination, yolk and albumen samples were weighed in tin capsules (50-60 µg for carbon and 500- 600 µg for nitrogen), whereas feed masses of 60 to 70 µg and 1600 to 1700 µg were used for carbon and nitrogen, respectively. The capsules were introduced by means of an automatic sampler in the element analyzer (EA 1108
-CHN - Fisons Instruments, Rodano, Italy), where the samples were burnt to obtain CO2 and N2. The obtained gases were separated in gas chromatography column, and analyzed in isotopic ration mass spectrometer (Delta S - Finnigan MAT, Bremen, Germany).
Isotopic ratio values were expressed as delta per thousand (δ) relaticve to the international standards PeeDee Belemnite (PDB) for 13C and atmospheric air nitrogen for 15N (Ducatti, 2004), according to the following general equation (1):
δ(sample, standard) = [(Rsample - Rstandard) / Rstandard] x 1000 (1)
where:
R represent the ratio between the least and the most abundant isotope, specifically 13C/12C and 15N/14N. Non-dimensional.
The obtained isotopic results were submitted to multivariate analysis of variance (MANOVA) using GLM procedures of SAS statistical software (1996). Based on the generated by error matrices, the regions with 95% confidence to identify differences between experimental treatments (diets with animal meals) means and control group (completely vegetable diet) mean.
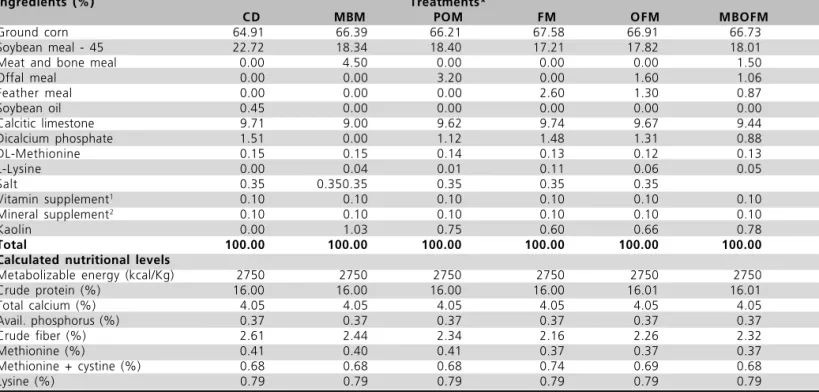
Table 1 - Percentage composition and calculated nutritional levels of the experimental diets.
Ingredients (%) Treatments*
CD MBM POM FM OFM MBOFM
Ground corn 64.91 66.39 66.21 67.58 66.91 66.73
Soybean meal - 45 22.72 18.34 18.40 17.21 17.82 18.01
Meat and bone meal 0.00 4.50 0.00 0.00 0.00 1.50
Offal meal 0.00 0.00 3.20 0.00 1.60 1.06
Feather meal 0.00 0.00 0.00 2.60 1.30 0.87
Soybean oil 0.45 0.00 0.00 0.00 0.00 0.00
Calcitic limestone 9.71 9.00 9.62 9.74 9.67 9.44
Dicalcium phosphate 1.51 0.00 1.12 1.48 1.31 0.88
DL-Methionine 0.15 0.15 0.14 0.13 0.12 0.13
L-Lysine 0.00 0.04 0.01 0.11 0.06 0.05
Salt 0.35 0.350.35 0.35 0.35 0.35
Vitamin supplement1
0.10 0.10 0.10 0.10 0.10 0.10
Mineral supplement2
0.10 0.10 0.10 0.10 0.10 0.10
Kaolin 0.00 1.03 0.75 0.60 0.66 0.78
Total 100.00 100.00 100.00 100.00 100.00 100.00
Calculated nutritional levels
Metabolizable energy (kcal/Kg) 2750 2750 2750 2750 2750 2750
Crude protein (%) 16.00 16.00 16.00 16.00 16.01 16.01
Total calcium (%) 4.05 4.05 4.05 4.05 4.05 4.05
Avail. phosphorus (%) 0.37 0.37 0.37 0.37 0.37 0.37
Crude fiber (%) 2.61 2.44 2.34 2.16 2.26 2.32
Methionine (%) 0.41 0.40 0.41 0.37 0.37 0.37
Methionine + cystine (%) 0.68 0.68 0.68 0.74 0.69 0.68
Lysine (%) 0.79 0.79 0.79 0.79 0.79 0.79
in corn, isotopically rich in 15N, which depends on soil nitrogen (Choi et al., 2002) and in animal meal, which
is also rich in 15N, reflecting the diet of the animal from which the meal derived and the enrichment at each increase in the trophic level of the animal organism (DeNiro & Epstein, 1981).
In the yolk and albumen samples, the δ13C and δ15N enrichment behaved similarly as to diet enrichment due to the dietary inclusion of animal meals (Table 3). Although each fraction of the same treatment may present a different isotopic signature, this is consistent with DeNiro & Epstein's (1976; 1978) assertion that the animal is what it isotopically eats, with variations of ± 2‰ for 13C and ± 3‰ for 15N. When statistically analyzed, these values generated regions with 95% confidence levels (Figures 1 and 2).
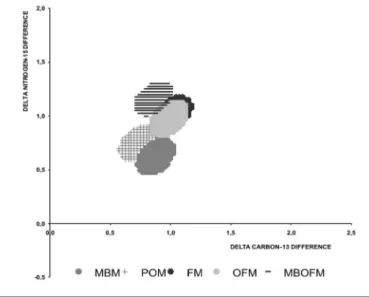
Figure 1 - Confidence region determined by the difference between δ13
C and δ15
N isotopic values of the yolk in each treatment as compared to the control treatment (n = 12).
Figure 2 - Confidence region determined by the difference between δ13
C and δ15
N isotopic values of the albumen in each treatment as compared to the control treatment (n = 12).
Dietary 13C enrichment probably occurred due to the isotopic enrichment of C4 plants as compared to C3 (Vogel, 1993). In addition, the isotopic value of the animal meal should be a reflex of the isotopic value of the diet of the animal from which the meal derived, varying approximately 2‰ for δ13C (DeNiro & Esptein, 1978).
As to 15N, the isotopic enrichment of these diets was due to the lower inclusion of soybean meal, a legume that has symbiosis with rizhobia, which isotopic value is similar to the standard (Handley & Raven, 1992; Werner & Schimidt, 2002), associated to an increase RESULTS AND DISCUSSION
The inclusion of animal meals in the diets (see feedstuff isotopic values in Table 2) promoted an enrichment of δ13C and δ15N values (Table 3). This probably occurred due to variations in the percentage composition of the diets. 13C and 15N enrichment when animal meals are included in poultry diets was also observed by Oliveira (2005), Carrijo et al. (2006),
Gottmann (2007), and Móri et al. (2007).
Table 2 - Mean δ13C and δ15N values and respective standard
deviations* of the feedstuffs used in the experimental diets.
Ingredients δ13
C (‰) δ15
N (‰)
Meat and bone meal -12.82 ± 0.13 7.43 ± 0.22 Poultry offal meal -16.28 ± 0.07 4.30 ± 0.03
Feather meal -16.98 ± 0.08 4.44 ± 0.02
Ground corn -13.19 ± 0.03 3.57 ± 0.23
Soybean meal - 45 -26.57 ± 0.35 0.43 ± 0.05
Soybean oil -31.54 ± 0.21
-*Standard deviation was calculated as a function of the number of replicates of the isotopic analysis carried out in each specific feedstuff (n = 2).
Table 3 - Mean δ13C and δ15N values and respective standard
deviations* of the diets (n = 2), albumen, and yolk (n = 12).
Treatments* Diet Albumen yolk
CD δ13
C(‰) -15.79 ± 0.08 -18.28 ±0.15 -18.38 ± 0.08
δ15
N(‰) 1.53 ± 0.03 3.47 ± 0.05 4.44 ± 0.12
MBM δ13
C(‰) -14.89 ± 0.21 -17.40 ± 0.09 -17.24 ± 0.18
δ15N(‰) 2.36 ± 0.11 4.09 ± 0.05 5.08 ± 0.09
POM δ13
C(‰) -15.51 ± 0.10 -17.55 ± 0.11 -17.36 ± 0.20
δ15
N(‰) 1.97 ± 0.01 4.21 ± 0.19 4.88 ± 0.20
FM δ13
C(‰) -15.03 ± 0.01 -17.26 ± 0.10 -17.23 ± 0.15
δ15
N(‰) 2.10 ± 0.01 4.49 ± 0.09 4.82 ± 0.11 OFM δ13C(‰) -14.96 ± 0.04 -17.29 ± 0.18 -17.22 ± 0.11
δ15
N(‰) 2.09 ± 0.09 4.44 ± 0.17 4.96 ± 0.19 MBOFM δ13
C(‰) -15.33 ± 0.17 -17.42 ± 0.16 -17.45 ± 0.11
δ15
In order to establish if any treatment is different from the control group, its confidence region cannot overlap any axis in the graph. When the ellipsis overlaps
one of the axes, the difference in δ13
C and δ15
N means between treatments is equal to zero, and therefore, treatments are not different.
The results show that the yolk (Figure 1) and the albumen (Figure 2) of the experimental treatments were statistically different from the control treatment (p < 0.05). The variations among the fractions are not
well understood, but Tieszen et al. (1983) wrote that
the main biochemical functions are isotopically different, and body isotopic differences may be a reflex of their different biochemical composition.
The levels of animal inclusion meal were 3.2, 2.6, 2.9, and 3.43% for POM, FM, OFM, and MBOFM, respectively. These inclusion levels varied between 2.5 and 3.5%, suggesting the possibility of detecting animal meal inclusion levels of at least 2.5% in poultry diets.
Albumen was the fraction that better detected animal meal dietary inclusion (Figure 2) de to the higher distant of the confidence ellipsis from the graph axes, allowing tracing these ingredients in commercial layer eggs. These results are consistent with those of Carrijo
et al. (2006) and Móriet al. (2007), who evaluated the
inclusion of animal meals in broiler and quail feeds, respectively, and detected these meals in the final product.
CONCLUSIONS
Under the conditions of this experiment, it was possible to conclude that:
Due to the inclusion of animal meals in the
experimental diets, δ13
C and δ15
N dietary values
increased. δ13C and δ15N enrichment of the yolk and
the albumen behaved similarly as to diet enrichment. Inclusion levels varied between 2.5 and 3.5%, suggesting that animal meal inclusion levels of at least 2.5% can be detected in poultry diets.
The technique of stable δ13C and δ15N isotopes
allows the detection of the inclusion of animal meals in commercial layer diets. However, the technique needs to further improved, and it will probably allow egg certification.
REFERENCES
Block Junior C. Monitoramento da qualidade de rações brasileiras para ruminantes por espectrometria de massa. Anais do Simpósio sobre manejo e nutrição de aves e suínos e tecnologia da produção
de rações; 2002; Campinas, São Paulo. Brasil. Campinas: Colégio Brasileiro de Nutrição Animal; 2002. p. 251-252.
Bricout J, Koziet J. Control of the authenticity of orange juice by isotopic analysis. Journal of Agricultural Food Chemistry 1987; 35: 758-760.
Brookes ST, Barrie A, Davies JE. A rapid 13C/12C test for determination
of corn-syrups in honey. Journal of the Association of Official Analytical Chemists 1991; 74:627-629.
Carrijo AS, Pezzato AC, Ducatti C, Sartori JR, Trinca L, Silva ET. Traceability of Bovine Meat and Bone Meal in Poultry by Stable Isotope Analysis. Revista Brasileira de Ciência Avícola 2006; 8:37-42.
Choi WJ, Lee SM, Ro HM, Kim KC, Yoo SH. Natural 15N abundances
of maize and soil amended with urea and composted pig manure. Plant and Soil 2002; 245:223-232.
Denadai JC, Ducatti C, Caldara FR, Oliveira RP, Silva ET. Certificação de ovos de poedeiras comerciais pela técnica dos isótopos estáveis. Anais do 3º Congresso De Produção e Consumo de Ovos; 2005 mar 16-17; Indaiatuba, São Paulo. Brasil. São Paulo (SP): APA; 2005.
DeNiro MJ, Epstein S. You are what you eat (plus a few ‰) the carbon isotope cycle in food chains. Geological Society of America 1976; 6:834. Abstract
DeNiro MJ, Epstein S. Influence of diet on the distribution of carbon isotopes in animals. Geochimica et Cosmichimica Acta 1978; 42: 495-506.
DeNiro MJ, Epstein S. Influence of diet on the distribution of nitrogen isotopes in animals. Geochimica et Cosmichimica Acta 1981; 42: 495-506.
Ducatti C. Isótopos estáveis ambientais [apostila]. Botucatu (SP): Instituto de Biociências, Universidade Estadual Paulista; 2004.
González-Martin I, González-Pérez C, Hernández-Méndez J, Marqués-Macias E, Sanz Poveda F. Use of isotope analysis to characterize meat from Iberian-breed swine. Meat Science 1999; 52:437-441.
González-Martin I, González-Pérez C, Hernández-Méndez J, Sánchez González C. Differentiation of dietary regimen of Iberian swine by means of isotopic analysis of carbon and sulphur in hepatic tissue. Meat Science 2001; 58:25-30.
Gottmann R. Influência da composição das rações na rastreabilidade de farinhas de origem animal pela técnica dos isótopos estáveis em frangos de corte [dissertação]. Botucatu (SP): Faculdade de Medicina Veterinária e Zootecnia, Universidade Estadual Paulista; 2007.
Handley LL, Raven JA. The use of natural abundance of nitrogen isotopes in plant physiology and ecology. Plant Cell and Environment 1992; 15:965-985.
Koziet J, Rossmann A, Martin GJ, Ashurst PR. Determination of carbon-13 content of sugars of fruit and vegetable juices. Analytica Chimica Acta 1993; 271:31-38.
Licatti F. Isótopos estáveis do carbon (13C/12C) em plantas do ciclo
bioquímico C3 e C4 [monografia]. Botucatu (SP): Instituto de Biociências; Universidade Estadual Paulista; 1997.
Manca G, Camin F, Coloru G, Del Caro A, Detentori D, Franco MA, Versini G. Characterisation of the geographical origin of Pecorino Sardo cheese by casein stable isotope (13C/12C and 15N/14N) ratios
and free amino acid ratios. Jounal of Agricultural and Food Chemistry 2001; 49:1404-1409.
Martin GJ, Guillou C, Martin ML, Cabanis MT, Tep X, Aerny J. Natural factors of isotope fractionation and the characterization of wines. Journal of Agricultural and Food Chemistry 1988; 36:316-322.
Monin G. Recent methods for predicting quality of whole meat. Meat Science 1998; 49:S231-S243.
Mori C, Garcia EA, Ducatti C, Denadai JC, Pelícia K, Gottmann R, Mituo MAO, Bordinhon AM. Traceability of animal byproducts in quail (Coturnix coturnix japonica) tissues using carbon (carbon-13/ carbon-12) and nitrogen (nitrogen-15/nitrogen-14) stable isotopes. Revista Brasileira de Ciência Avícola / Brazilian Journal of Poultry Science 2007; 9:263-269.
Oliveira RP. Rastreabilidade da poultry offal meal de aves na alimentação de frangos de corte pela técnica dos isótopos estáveis (13C e 15N) [tese]. Botucatu (SP): Faculdade de Medicina Veterinária e
Zootecnia, Universidade Estadual Paulista; 2005.
Piasentier E, Valusso R, Camin F, Versini G. Stable isotope ratio analysis for authentication of lamb meat. Meat Science 2003; 64: 239-247.
Rosa CR, Moraes M, Neto JAG, Nobrega JA, Nogueira AR. Effect of modifiers on thermal behavior of Se in acid digestates and slurry of vegetables by graphite furnace atomic absorption spectrometry. Food Chemistry 2002; 79:517-523.
Rossmann A, Haberhauer G, Holzl S, Horn P, Pichlmayer F, Voerkelius S. The potential of multielement stable isotope analysis for regional origin assgnment of butter. European Food Research & Technology 2000; 211:32-40.
Rostagno HS, Albino LFT, Donzele JL, Gomes PC, Ferreira AS, Oliveira RF, Lopes DC, Barreto SLT. Tabelas brasileiras para aves e suínos: composição de alimentos e exigências nutricionais. Viçosa (MG): UFV; 2005.
SAS Institute. SAS/STAT. User's guide. Version 6.11. 4th ed., v. 2. Cary: SAS Institute; 1996.
Tieszen LL, Boutton TW, Tesdahl KG, Slade NA. Fractionation and turnover of stable carbon isotopes in animal tissues: implications for δ13C analysis of diet. Oecologia 1983; 57:32-37.
Vogel JC. Variability of carbon isotope fractionation during photosynthesis. In: Ehleringer JR, Hall AE, Farquhar GD, editors. Stable isotopes and plant carbon-water relations. San Diego:
Academic Press; 1993. p. 29-46.
Werner RA, Schimidt HL. The in vivo nitrogen isotope discrimination among organic plant compounds. Phytochemistry 2002; 61:465-784.
White JW, Winters K, Martin P, Rossmann A. Stable carbon isotope ratio analysis of honey: validation of internal standard procedure for worldwide application. Journal of the Association of Official Analytical Chemists International 1998; 81:610-619.