Root dry matter mass and distribution of Florico
grass under different grazing strategies
Ana Carolina Carvalho de Barros(1), João Carlos de Carvalho Almeida(2), Sergio Trabali Camargo Filho(3), Carlos Augusto Brandão de Carvalho(2), Ludmila Lacerda Campana(4) and Leonardo Fiusa de Morais(5)
(1)Universidade Federal Rural do Rio de Janeiro (UFRRJ), Instituto de Zootecnia, BR 465, Km 7, CEP 23891-000 Seropédica, RJ,
Brazil. E-mail: [email protected] (2)UFRRJ, Instituto de Zootecnia, BR 465, Km 7, CEP 23891-000 Seropédica, RJ, Brazil. E-mail:
[email protected], [email protected] (3)Empresa de Pesquisa Agropecuária do Estado do Rio de Janeiro, Centro
Estadual de Pesquisa em Agricultura Orgânica, BR 465, Km 7, CEP 23891-000 Seropédica, RJ, Brazil. E-mail: [email protected]
(4)Escola Estadual Sebastião Cerqueira, Rua Paulo Vieira de Carvalho, no 60, Ilha Lazareto, CEP 36660-000 Além Paraíba, MG, Brazil.
E-mail: [email protected] (5)Universidade Federal do Ceará, Avenida Mister Hull, no 2.977, CEP 60455-760 Fortaleza, CE,
Brazil. E-mail: [email protected]
Abstract – The objective of this work was to evaluate the variations in root dry matter mass (RDM) and the percentage distribution (PD) of the root density of Florico grass (Cynodon nlemfuensis) in the 0–40-cm soil layer, when managed under different grazing strategies. Two defoliation frequencies (90 and 95% light interception, as the criterion for allowing animals in the paddock) and two defoliation severities (post-grazing heights of 20 or 30 cm) were assessed. Four seasonal evaluations of the root system were performed between the winter of 2012 and the autumn of 2013, using the monolith and trench excavation technique, collecting 1-dm3 samples from soil surface down to a depth of 40 cm, in four sequential extracts of 10 cm each. Lower RDM values (0.69 g dm-3) were obtained in winter, with the four grazing strategies, whereas higher values were observed in spring (1.64 g dm-3), for the 30-cm post-grazing residue, and in autumn (1.63 g dm-3) for the 20 cm post-grazing residue, regardless of the light interception value. Between 52 and 66% of the RDM density was observed in the 10-cm layer, for all four grazing strategies, in all seasons.
Index terms: Cynodon nlemfuensis, forage species, light interception, percentage distribution, post-grazing stubble height, root density.
Massa de matéria seca de raízes e distribuição radicular do
capim Florico sob diferentes estratégias de pastejo
Resumo – O objetivo deste trabalho foi avaliar a dinâmica da massa de matéria seca radicular (MSR) e da distribuição percentual (DP) da densidade radicular do capim Florico (Cynodon nlemfuensis), na camada de 0 a 40 cm de profundidade, sob diferentes estratégias de pastejo. Utilizaram-se duas frequências de desfolha (90 e 95% de interceptação luminosa, como critério para a entrada dos animais em pastejo) e duas severidades de desfolha (20 e 30 cm de resíduo pós-pastejo). Realizaram-se quatro avaliações sazonais no sistema radicular, entre o inverno de 2012 e o outono de 2013, tendo-se utilizado a técnica do monólito com escavação de trincheiras, e retirada de amostras de 1 dm3 da superfície do solo até 40 cm de profundidade, em quatro extratos sequenciais de 10 cm de profundidade cada um. Menores valores de MSR (0.69 g dm-3) foram obtidos no inverno, nas quatro estratégias de pastejo, e os maiores na primavera (1.64 g dm-3), para 30 cm de resíduo pós-pastejo, e no outono (1.63 g dm-3) para 20 cm de resíduo pós-pastejo, independentemente da interceptação luminosa adotada. Entre 52 e 66% da densidade de MSR foi observada na camada de 0–10 cm, nas quatro estratégias de pastejo, em todas as estações do ano.
Termos para indexação: Cynodon nlemfuensis, espécies forrageiras, interceptação luminosa, distribuição percentual, altura de resíduo pós-pastejo, densidade radicular.
Introduction
Pastures occupy approximately one-quarter of the Brazilian territory and are the cheapest food source for ruminants. In the search for highly productive forage species for ruminant feed, the grasses of the
genus Cynodon have been focused on because of their
versatility and flexibility in use (Carvalho et al., 2012).
2010). Florico grass is highly productive and it adapts to different climate and soil conditions; therefore, it is more resistant to changes in the employed management practices (Rodrigues Filho et al., 2000).
The genus Cynodon originated in East Africa. Cynodon nlemfuensis or star grass shows more developed stolons and fewer rhizomes than other Cynodon species. It is a rustic, persistent plant that is adapted to different climatic conditions (Pedreira, 2010); however, it has a higher fertility requirement than other grasses.
In general, studies of forage plants focus on aerial shoots but lack information on the root system
(Monteiro & Consolmagno Neto, 2008; Silveira &
Monteiro, 2011). However, the root system, which is the source of carbohydrates and proteins for the early stages of grass regrowth, interacts with the aerial shoot, which is responsible for the development of the plant (Ribeiro et al., 2011), particularly under grazing conditions. Therefore, after defoliation by grazing, physiologically distinct effects are observed. There is a transition period during which the organic reserves are used for quick restoration of tissues lost because of herbivory and a subsequent period in which physiological activity is adjusted as the stocks of reserves are gradually restored (Rodrigues et al., 2007; Ribeiro et al., 2011).
Defoliation is known to be required for the renewal of the aerial shoots of plants; therefore, the frequency and severity of grazing should encourage the maintenance of a strong and deep root system that can help reduce the plant regrowth time. Forages with a strong and deep root system support different grazing strategies; such a root system also increases the resistance of these grasses to stress caused by severe winters, dry
summers, and grazing itself (Cunha et al., 2010), and
increases their competitive nutrient uptake (Monteiro
& Consolmagno Neto, 2008; Kaiser et al., 2009). In this context, it is difficult to design pasture
management strategies that increase the intensity and/ or frequency of grazing without reducing the root dry matter mass reserve (Rodrigues et al., 2007; Sarmento
et al., 2008; Kaiser et al., 2009). The effective depth
of the root system of Florico grass under grazing was
found to be 35 cm by Cunha et al. (2010), whereas Camargo Filho (2007) showed that 85% of the roots
were found at a depth of 40 cm. However, the effect of grazing strategies on the density and percentage
distribution of the root system of the Florico grass is not observed in the effective layer, where there is a higher concentration of roots (soil surface down to 40-cm depth); the effect of grazing on the seasonality of this species also remains unclear.
The objective of this work was to evaluate the variations in root dry matter mass (RDM) and the percentage distribution (PD) of the root density of Florico grass in the 0–40-cm soil layer, when managed under different grazing strategies.
Materials and Methods
The experiment was conducted in the experimental
field of Centro Estadual de Pesquisa em Agricultura
Orgânica of Empresa de Pesquisa Agropecuária do Estado do Rio de Janeiro, in the municipality of Seropédica, in the state of Rio de Janeiro, Brazil (22°47'S, 43°40'W, at an altitude of 31 m). The climate of the region is tropical rainy, of the savannah subtype
Aw, according to Köppen’s classification, characterized
by the annual distribution of rainfall. There is a dry period during the colder months, which extends from April to September (fall and winter), and a rainy period during the warmer months from October to March (spring and summer). Data on the rainfall and average temperature, used to calculate the water balance (Table 1), were recorded by the meteorological station Ecologia Agrícola, located approximately 1,500 m from the site of the experiment; these data showed
that, in 2012, a water deficit was expected for the fall/
winter period and during most of spring.
The soil was classified as a Argissolo
Vermelho-Amarelo (Santos et al., 2013), i.e., an Ultisol, based on the chemical characterization of the 0–20-cm layer in 2011: pH H20 (1:2.5) 6.0, 59.3 mg dm-3 P (Mehlich-1),
0.6 cmolc dm-3 K, 2.5 cmolc dm-3 Ca, 0.7 cmolc dm-3 Mg,
2.8 cmolc dm-3 H+Al, sum of bases of 3.8 cmolc dm-3,
cation exchange capacity of 6.6 cmolc dm-3, bases
saturation of 58%, 2.3 g kg-1 soil organic matter, and
13.0 g kg-1 organic carbon.
The experiment was conducted in a 0.48-ha Florico grass pasture established in 2008, consisting of 16 paddocks (experimental units), with dimensions of 15×20 m (300 m2). Pasture management consisted
to the paddocks in a 2×2 factorial arrangement in a randomized complete block design, with four replicates per treatment. Defoliation frequency was controlled using thresholds of 90 and 95% light interception (LI) as a criterion for allowing animals to enter the paddocks, whereas defoliation severities corresponded to 20- or 30-cm post-grazing residue (PGR). The four different treatments were labeled 90–20, 90–30, 95–20, and 95–30. Grazing by non-breastfeeding cows and crossbred heifers (Holstein x Zebu cows) was allowed from January 2012 to June 2013, for an average period of 48 hours; four to seven animals were used per replicate depending on forage availability.
Fertility management of the grazing strategies using nutrients consisted of nitrogen fertilization equivalent
to 200 kg N and 160 kg ha-1 K
2O per year, in the form
of urea and potassium chloride, respectively. For each pasture strategy, the nutrients were generally applied two weeks after the last cycle of grazing for each grazing season (Table 2).
Table 1. Climatic data and water balance (WB) observed
during the grazing period from January 2012 to June 2013.
Month/Year Temperature (C°)(1)
Cumulative rainfall (mm)
WB(2)
(mm)
Maximum Minimum
January 2012 29.9 21.4 298.0 191.39
February 2012 33.9 22.0 42.6 -132.12
March 2012 31.6 20.7 0.0 -138.64
April 2012 29.3 20.6 64.6 -36.79
May 2012 26.7 16.9 55.8 -25.93
June 2012 26.2 17.1 103.0 27.87
July 2012 26.4 16.9 32.6 -45.93
August 2012 27.3 15.7 31.4 -63.66
September 2012 28.4 17.5 77.6 -25.87
October 2012 31.1 20.0 63.2 -69.40
November 2012 27.7 20.3 101.2 21.02
December 2012 34.4 23.3 138.6 -38.49
January 2013 29.9 21.8 363.2 259.14
February 2013 33.5 23.0 172.2 11.04
March 2013 30.1 20.7 185.8 73.67
April 2013 28.5 18.5 92.2 -7.18
May 2013 27.5 16.5 92.2 -2.24
June 2013 27.4 16.9 27.0 -64.68
(1)Monthly average. (2)Positive values indicate excess water, and negative
values indicate monthly water deficits. Source: National Institute of Meteorology, Agricultural Ecology Station in Seropédica, RJ (INMET, 2017).
Table 2. Period (days) of grazing cycles, fertilizer application dates, and root evaluation in four grazing strategies of Florico grass (Cynodon nlemfuensis).
Season Grazing cycle N and K
fertilization (date)
Root evaluation
(date) Start (date) End (date) Period
90% light interception (LI) - 20 cm post-grazing residue (PGR)
Summer 2012
Jan. 2 Jan. 30 28 -
-Jan. 30 Mar. 1 31 -
-Mar. 1 Apr. 2 32 Apr. 16
-Fall,2012 Apr. 2 May 7 35 -
-May 7 July 2 56 July 16
-Winter 2012 July 2 Aug. 14 43 - Aug. 21 (1) Aug. 14 Sept. 23 40 Oct. 7
-Spring 2012 Sept. 23 Oct. 29 36 -
-Oct. 29 Dec. 5 37 Dec. 19 Dec. 12
Summer 2013
Dec. 5 Jan. 10 36 -
-Jan. 10 Feb. 5 26 -
-Feb. 5 Mar. 1 24 Mar. 15 Mar. 8
Fall 2013 Mar. 1 Apr. 18 48 -
-Apr. 18 June 1 44 June 15 June 8 90% light interception (LI) - 30 cm post-grazing residue (PGR)
Summer 2012
Jan. 12 Feb. 4 23 -
-Feb. 4 Feb. 29 25 -
-Feb. 29 Mar. 26 26 Apr. 9
-Fall 2012 Mar. 26 Apr. 24 29 -
-Apr. 24 June 15 52 June 29
-Winter 2012
June 15 July 21 36 -
-July 21 Aug. 29 39 - Sept. 5* Aug. 29 Oct. 7 39 Oct. 21
-Spring 2012 Oct. 7 Nov. 17 41 -
-Nov. 17 Dec. 19 32 Jan. 2 Dec. 26
Summer 2013
Dec. 19 Jan. 10 22 -
-Jan. 10 Jan. 31 21 -
-Jan. 31 Feb. 19 19 -
-Feb. 19 Mar. 11 20 Mar. 25 Mar. 18
Fall 2013 Mar. 11 Apr. 19 39 -
-Apr. 19 June 2 44 June 16 June 9
Summer 2012
95% light interception (LI) - 20 cm post-grazing residue (PGR)
Dec. 30 Jan. 30 31 -
-Jan. 30 Mar. 5 35 Mar. 19
-Fall 2012
Mar. 5 Apr. 8 34 -
-Apr. 8 May 17 39 -
-May 17 July 17 61 July 31 -Winter 2012 July 17 Oct. 8 83 Oct. 22 Oct. 15 Spring 2012 Oct. 8 Nov. 28 51 Dec. 12 Dec. 5
Summer 2013
Nov. 28 Jan. 2 35 -
-Jan. 2 Feb. 10 39 -
-Feb. 10 Mar. 12 30 Mar. 28 Mar. 19
Fall 2013 Mar. 12 Apr. 28 47 -
-Apr. 28 June 18 51 July 2 June 25 95% light interception (LI) - 30 cm post-grazing residue (PGR)
Summer 2012 Jan. 28 Feb 28 31 -
-Feb. 28 Apr. 4 36 Apr. 18
-Fall 2012 Apr. 4 May 19 45 June 2
-Winter 2012 May 19 July 23 65 -
-July 23 Oct. 17 86 Oct. 31 Oct. 24
Spring 2012 Oct. 17 Dec. 5 49 Dec. 19 Dec. 12*
Dec. 5 Jan. 3 29 -
-Summer 2013 Jan. 3 Feb. 3 31 -
-Feb. 3 Mar. 3 28 Mar. 17 Mar. 10
Fall 2013 Mar. 3 Apr. 22 50 -
The monitoring of LI by the forage canopy was performed at 20 random points per paddock, once a week between 11:00 a.m. and 01:00 p.m. When the average LI of four replicates of the same treatment reached 85 and 90% in the 90 and 95% LI treatments, respectively, monitoring was subsequently done twice a week. Each point represented the mean of two readings above the forage canopy, through a single sensor and two measures close to the ground, using a bar of 80 sensors, placed in the north-south direction
in the first measurement and in the east-west direction
in the second measurement. All measurements were performed with the AccuPAR LP-80 Linear PAR/
LAI Ceptometer (Decagon Devices, Inc., Pullman,
WA, USA). Grazing animals were allowed to enter the pastures when the mean of four experimental units achieved the desired light interception for each treatment, i.e., 90 or 95% LI.
Forage mass was measured by cutting samples close to the ground. Immediately after harvesting the forage, samples of four 0.25-m2 rims per experimental
unit were divided into stem + pseudostem, leaf blade, and dead material. These components were weighed, and the leaf blades were passed through a scanner to determine LI. All the fractions were dried immediately after fractionation in a forced-air circulation oven at
55ºC until they reached a constant weight.
The height of the pasture was evaluated on the same dates as LI was monitored, between 09:00 a.m. and 11:00 a.m., at 40 random points per experimental unit, using a ruler graduated in millimeters and a sheet of acetate, according to the methodology described by
Carnevalli & Silva (1999).
Monitoring of PGR height began after 24 hours of grazing and was repeated every 4 hours until the mean of each paddock reached the recommended PGR height. The animals were removed from the paddock and, when necessary, rearranged across other replicates that had not yet reached the desired residue height, i.e., 20- or 30-cm PGR.
To estimate the RDM reserve and the PD of root density for each pasture strategy, two trenches were dug (0.5×0.4×0.6 m) for each replicate, 1 week after the grazing cycle, for each season of the year. For the pasture strategies 90–0.2, 90–0.3, 95–0.2, and 95–0.3, respectively, samples were taken in: winter, on August 21, September 5, October 15, and October 24, 2012; spring, on December 12, December 26, December 5,
and December 12, 2012; summer, on March 8, March 18, March 19, and March 10, 2013; and fall, on June 8, June 9, June 25, and June 26, 2013. Samples were taken at four depths: 0.0–0.1, 0.1–0.2, 0.2–0.3, and 0.3–0.4 m, using an iron monolith (0.1×0.2×0.05 m). The grazing cycle, rest period, and root evaluation dates are shown in Table 2.
After the collection of soil + root samples, the trenches were closed and samples were collected at another
location in the paddock. Collected samples were placed
in 10-L buckets, and the visible roots were collected manually and deposited on sieves with 4-, 2-, and 1-mm
mesh under a gentle stream of water. Next, flowing
water was added to the bucket and the whole mass (soil + roots) was agitated to suspend the remaining roots and root fragments. The suspension was then sieved until all visible roots were separated, according to the
method described by Camargo Filho (2007) with some modifications. After the samples were prepared, the
roots were weighed on an analytical scale and placed
in an oven at ±60°C with forced air circulation for 72
hours, until they reached a constant weight.
The variables were grouped by the time of year – winter, spring, summer, and fall – and subjected to two-way analysis of variance using the GraphPad Prism5 statistical package (GraphPad Software Inc., San
Diego, CA, USA). Plots were arranged divided by time,
with the grazing strategies as the plots and the seasons of the year as the subplots. To compare the means of the
main effects, i.e., LI and PGR, and identify significant
interactions, the Bonferroni test, at 5% probability, was used. For the PD (%) in depth, the regression analysis (exponentially with plateau) was performed, and equations were compared using the F-test.
Results and Discussion
accumulation of forage mass, and the LAI were analyzed.
The pre-grazing canopy height was affected by the LI in the spring, with greater heights observed at 95% LI in treatments with a PGR of 20 or 30 cm (Table 3). In winter, a greater canopy height was observed at 95% LI with a PGR of 30 cm; similarly, in summer, a greater canopy height was observed at 95% LI but with a PGR of 20 cm. In fall, different management strategies did not result in different canopy heights.
The absence of a positive association between canopy height and LI observed in this study, based on the results gathered in fall and supported by the results for winter and summer, may be related to the prostrate growth habit of this species. In cespitose grasses of the genera Panicum and Brachiaria, positive associations have been reported between canopy height and LI throughout
the year (Carnevalli et al., 2006; Barbosa et al., 2007;
Pedreira et al., 2007; Zanine et al., 2011).
Conversely, the obtained results showed that the
height of the canopy was affected by a PGR height of 20 cm in winter and 30 cm in summer at 90% LI (Table 3). This inversion of a greater PGR height in summer compared with winter can be associated with the duration of the grazing cycles of Florico grass at these times of the year.
In winter, the 90–20 strategy had a cycle of 43 days, preceded by a cycle of 56 days, whereas the 90–30 strategy had a cycle of 39 days, preceded by a cycle of 36 days (Table 2). This 20-day difference in the length of the previous grazing cycle in unfavorable growing seasons (Table 1) favored stem elongation, resulting in greater canopy heights for the 90–20 strategy.
In summer, the grazing cycles were 24 and 20 days, and previous cycles were 26 and 19 days, respectively,
for the 90–20 and 90–30 strategies (Table 2). This favorable growth time (Table 1) and higher PGR height resulted in a greater pre-grazing canopy height. The obtained results also showed that the grazing strategies resulted in rest periods for the Florico grass. Several authors have reported the rest period of this genus to be
approximately 27 to 30 days (Vilela et al., 2005; Costa
et al., 2013; Soriano et al., 2013), using other grazing
strategies such as fixed resting interval and canopy
height.
The pre-grazing forage mass varied according to the increase in the level of LI in summer; in spring, PGRs of 30 cm were recorded in the grazing strategies with 95% LI (Table 3), with a greater forage availability observed for the 95–30 strategy in spring and the 95–20 strategy in Summer.
Increases in the level of LI increased the leaf area index (LAI) in all seasons of the year except for winter when the height of the PGR negatively affected the LAI with higher levels of LI (Table 4). The positive
association between LAI and LI partially verified in
this study has also been reported in grasses of the genus Brachiaria (Braga et al., 2006).
The RDM was higher in spring in the grazing strategies with a lower severity of defoliation (30-cm PGR), 1.60 and 1.67 g dm-3, respectively, for 90 and 95%
LI. For the strategies with the more severe defoliation (20-cm PGR), the highest RDM densities were observed in summer (1.48 g dm-3) and fall (1.64 g dm-3) for 90%
LI and in fall (1.62 g dm-3) for 95% LI. In all grazing
strategies, lower values were observed in winter than in
the other seasons (Table 5). In Coast cross grass, Ribeiro
et al. (2011) reported higher RDM density in the fall than in summer and winter, leading these authors to hypothesize that the accumulation of RDM is a plant
Table 3. Effect of the pre-grazing conditions (PGR) on canopy height and on dry matter accumulation of Florico grass (Cynodon nlemfuensis) throughout the year, with four different grazing strategies(1).
Light interception (%)
Winter 2012 PGR (cm) Spring 2012 PGR (cm) Summer 2013 PGR (cm) Fall 2013 PGR (cm)
20 30 20 30 20 30 20 30
Canopy height (cm)
90 41.6Aa 36.9Bb 47.1Ab 41.2Ab 56.6Bb 62.0Aa 52.7Aa 50.8Aa
95 42.5Aa 45.2Aa 51.5Aa 44.5Aa 65.2Aa 63.9Aa 54.6Aa 54.5Aa
Forage dry matter accumulation (g m-2 per cycle)
90 180Ab 162Aa 172Aa 157Ab 162Ab 166Ab 135Aa 152Aa
95 223Aa 131Bb 179Ba 218Aa 193Aa 190Aa 134Aa 118Ab
(1)Means followed by equal letters, uppercase in the rows and lowercase in the columns, do not differ significantly in the same season by Bonferroni’s
physiological response, in which the root mass is increased to store more non-structural carbohydrates to be used at another time.
With more severe defoliation, an increase in the RDM density was observed over time, with maximum values found in fall; this suggests that this is a physiological response of the plant to accumulate organic reserves for survival during winter. The seasonal change in the RDM density was similar to the results presented by
Cunha et al. (2010), who reported an RDM density of
approximately 0.6 g dm-3 in star grass (C. nlemfuensis)
under fertilized grazing conditions with both 100 or
300 kg N ha-1 per year, and by Ribeiro et al. (2011),
who also reported higher RDM densities in fall.
In the management strategies with less severe defoliation (30-cm PGR), the recovery of the organic reserves in the roots occurred only in spring (Table 5). This indicates the importance of the root system
in the accumulation of organic reserves. In stalk grasses, however, rhizomes also play a key role in the accumulation of organic reserves (Rodrigues et al., 2007; Mueller et al., 2013; Plaza-Bonilla et al., 2014; Silva et al., 2015). RDM densities similar to the highest values observed in spring and fall in this study (1.69 g dm-3) have previously been reported in Urochloa
brizantha 'Marandu' during the rainy period (Santos et al., 2007), and in P. maximum 'Milênio' fertilized with 150 kg ha-1 N per year (Sarmento et al., 2008).
No relationships were observed between the
parameters of the aerial part of the plant (pre-grazing canopy height, the accumulation of forage mass, and LAI) and the root mass density.
No significant differences were found between the
RDM densities of the different grazing strategies in the winter of 2012, and the summer and fall of 2013 (Table 6), possibly because of the high variability of
the data, i.e., coefficient of variation (CV) ≥ 75%. These results confirm that the root system density
varies homogeneously according to water and nutrient
availability (Costa et al., 2002; Mueller et al., 2013;
Plaza-Bonilla et al., 2014).
According to Rodrigues et al. (2007) and Silva et al. (2015), during the rainy period, the sink-source mechanism results in the fast recovery of the aerial parts of the plant, after which the organic reserves are redirected to restore the root system reserves. In fact, in the spring of 2012, when the hydric balance was
positive in November (Table 1), the treatments with
less severe defoliation (90–30 and 95–30) accumulated higher RDM densities (1.60 and 1.67 g dm-3) than the
95–20 treatment (1.04 g dm-3) (Table 5); this may be
explained by the greater disruption caused by herbivory that occurred in the grazing strategies with more severe defoliation.
Table 4. Effect of the pre-grazing conditions on the canopy height index of Florico grass (Cynodon nlemfuensis) throughout the year, with four different grazing strategies(1).
Grazing strategy Winter
2012
Spring 2012
Summer 2013
Fall 2013
90 LI-20 PGR 2.68Cc 3.67Bb 4.46Ad 3.76Bc
90 LI-30 PGR 2.98BCbc 2.84Cc 4.60Ac 3.60Bd
95 LI-20 PGR 3.40Cb 4.56Ba 5.68Aa 4.79Ba
95 LI-30 PGR 3.79BCa 3.66Cb 5.59Ab 4.44Bb
(1)Means followed by equal letters, uppercase in the rows and lowercase in
the columns, do not differ significantly in the same season by Bonferroni’s test, at 5% probability. LI, light interception; and PGR, height of the post-grazing residue.
Table 5. Root dry matter mass densities (g dm−3) of Florico grass (Cynodon nlemfuensis) grown under four different grazing strategies(1).
Season Grazing strategy (LI–PGR)
90–20 90–30 95–20 95–30
Winter 2012 0.63Ab 0.76Ab 0.76Ab 0.60Ab
Spring 2012 1.25ABab 1.60Aa 1.04Bab 1.67Aa
Summer 2013 1.48Aa 1.10Aab 1.25Aab 1.26Aab
Fall 2013 1.64Aa 0.99Aab 1.62Aa 1.03Aab
(1)Means followed by equal letters, uppercase in the rows and lowercase in
the columns, do not differ significantly in the same season by Bonferroni’s test, at 5% probability. LI, light interception; and PGR, height of the pos-grazing residue.
Table 6. Root dry matter mass density (RDM) of Florico grass (Cynodon nlemfuensis) as a function of soil depth.
Season Equation R2
Winter 2012 RDM = 2.47e-12.94(depth) + 0.26 0.89
Spring 2012 RDM (90−0.3 and 95–0.3) = 6.69e
-11.98(depth) + 0.34 0.89
RDM (95−0.2) = 3.34e-9.19(depth) + 0.19 0.89
Summer and
Autumn 2013 RDM = 5.55e
-14.52(depth) + 0.42 0.86
In addition to the effect of grazing strategies on the RDM density, knowledge of the trend of the PD
of RDM along the profile of the superficial soil layer
allows infering about the ability of the plant to acquire
water and nutrients (Costa et al., 2002; Mueller et al.,
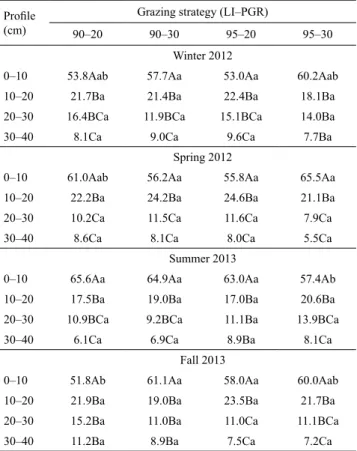
2013; Plaza-Bonilla et al., 2014). This concentration of roots near soil surface is explained by the branched architecture of the root system, common in forage grasses (Santos et al., 2007; Sarmento et al., 2008; Ribeiro et al., 2011). The highest concentrations of roots were observed in the 0–10-cm layer (51.8 to 65.6%) for all four grazing strategies in all seasons (Table 7).
The accumulation of RDM in the soil surface layer has also been reported previously by Ribeiro et al.
(2011) in pastures of Coast cross grass intercropped
with Arachis pintoi, with an RDM density of 62% observed at a depth of 0–15 cm; Sarmento et al. (2008) also obtained an RDM density of 62% at a depth of 0–10 cm, in Milênio grass pastures. After 7 years of planting U. brizantha, Santos et al. (2007) found that the RDM planting density decreased with depth, resulting in an RDM density of 67% at 10 cm and 11% at 40 cm.
Among the grazing strategies within a season,
a significant effect was observed only in the
0–10-cm layer with the 90–20 strategy, resulting in a concentration of a greater proportion of the roots in this layer in summer (65.6%) than in fall (51.8%), whereas with the 95–30 strategy, these RDM densities were 65.5% in spring and 57.4% in summer (Table 7). These results indicate that after a period of favorable growth with a positive water balance, there was a faster regeneration of the root system; this was followed by an increase in the disappearance or turnover of roots, which was likely to affect the oldest roots.
For the less severe grazing treatments (95% LI), in winter (Figure 1 A) and in spring (Figure 1 B), there was a higher concentration of roots near the surface for the 95–30 treatment than the 95–20 treatment. The similar RDM densities observed between the 95% LI grazing strategies in winter (0.76 versus 0.60 g dm-3)
and spring (1.60 versus 1.67 g dm-3) (Table 5),
indicating the maintenance of a greater proportion of roots in the soil surface layer. This result suggests that the root system has less need to go deeper to acquire water and nutrients when grazing is less severe.
In summer, there was a higher concentration of roots near the surface for the more severe grazing treatments (90–20) than the less severe ones (95–30)
(Figure 1 C). Although similar RDM densities (1.48
versus 1.26 g dm-3) were observed in summer with
these treatments, the lowest PD was obtained with less severe grazing (95–30); this is likely associated with the renewal of the root system, also known as “turnover”, during the favorable summer growth period and with
the accumulation of organic reserves. Notably, although
there were no differences between the RDM density with the 95–30 treatment between spring and summer (1.67 versus 1.26 g dm-3, respectively; Table 6), the PD
in the superficial layer was higher in spring than in
summer (65.5 versus 57.4%, respectively) as shown in Table 7.
Table 7. Percentage distribution of root dry matter mass (%) of Florico grass (Cynodon nlemfuensis) as a function of the
soil depth profile(1).
Profile (cm)
Grazing strategy (LI–PGR)
90–20 90–30 95–20 95–30
Winter 2012
0–10 53.8Aab 57.7Aa 53.0Aa 60.2Aab
10–20 21.7Ba 21.4Ba 22.4Ba 18.1Ba
20–30 16.4BCa 11.9BCa 15.1BCa 14.0Ba
30–40 8.1Ca 9.0Ca 9.6Ca 7.7Ba
Spring 2012
0–10 61.0Aab 56.2Aa 55.8Aa 65.5Aa
10–20 22.2Ba 24.2Ba 24.6Ba 21.1Ba
20–30 10.2Ca 11.5Ca 11.6Ca 7.9Ca
30–40 8.6Ca 8.1Ca 8.0Ca 5.5Ca
Summer 2013
0–10 65.6Aa 64.9Aa 63.0Aa 57.4Ab
10–20 17.5Ba 19.0Ba 17.0Ba 20.6Ba
20–30 10.9BCa 9.2BCa 11.1Ba 13.9BCa
30–40 6.1Ca 6.9Ca 8.9Ba 8.1Ca
Fall 2013
0–10 51.8Ab 61.1Aa 58.0Aa 60.0Aab
10–20 21.9Ba 19.0Ba 23.5Ba 21.7Ba
20–30 15.2Ba 11.0Ba 11.0Ca 11.1BCa
30–40 11.2Ba 8.9Ba 7.5Ca 7.2Ca
(1)Means followed by equal letters, uppercase in the rows and
Conclusions
1. The combination of light interception with
post-grazing residue is not an efficient parameter to
determine optimal Florico grass (Cynodon nlemfuensis) grazing strategy.
2. Lower densities of root dry matter mass occur in winter, rather than in the other seasons, regardless of the grazing strategy.
3. In spring, the grazing strategies affect both root dry matter mass density and root depth percentage distribution.
4. Regardless of the grazing strategy, between 52 and 66% of the root dry matter mass density is concentrated in the 0–10-cm soil layer, with 17–25% found in the 10–20-cm layer.
5. The parameters of the aerial part of the plant are not positively associated with the root dry matter mass density.
Acknowledgments
To Coordenação de Aperfeiçoamento de Pessoal de Nível Superior (Capes), for the scholarships granted to the first author; to Fundação Carlos Chagas Filho
de Amparo à Pesquisa do Estado do Rio de Janeiro
(Faperj), for providing financial support for the
project; and to Pesquisa Agropecuária do Estado do Rio de Janeiro (Pesagro-Rio), for providing staff and infrastructure for performing the experiment.
References
BARBOSA, R.A.; NASCIMENTO JÚNIOR, D. do; EUCLIDES, V.P.B.; SILVA, S.C.; ZIMMER, A.H.; TORRES JÚNIOR, R.A.A. Capim-tanzânia submetido a combinações entre intensidade e
frequência de pastejo. Pesquisa Agropecuária Brasileira, v.42, p.329-340, 2007. DOI: 10.1590/S0100-204X2007000300005.
BRAGA, G.J.; PEDREIRA, C.G.S.; HERLING, V.R.; LUZ, P.H. de C.; LIMA, C.G. de. Sward structure and herbage yield of rotationally stocked pastures of ‘Marandu’ palisadegrass
[Brachiaria brizantha (A. Rich.) Stapf] as affected by herbage allowance. Scientia Agricola, v.63, p.121-129, 2006. DOI: 10.1590/S0103-90162006000200003.
CAMARGO FILHO, S.T. Morfologia radicular de quatro
gramíneas forrageiras e sua relação com a aquisição de
nutrientes e produção de fitomassa. 2007. 99p. Tese (Doutorado)
– Universidade Federal Rural do Rio de Janeiro, Seropédica.
CARNEVALLI, R.A.; SILVA, S.C. Validação de técnicas
experimentais para avaliação de características agronômicas e ecológicas de pastagens de Cynodon dactylon cv. Coastcross-1.
Figure 1. Root percentage distribution of Florico grass (Cynodon nlemfuensis): A, winter 2012; B, spring 2012; and
C, summer 2013.
0.05
0.15
0.25
0.35
0 20 40 60 80 100
Depth (m)
Root distribution (%)
RPD (95-20)= 77.7*e-11.47(depth)+9.21
R = 0.97922
RPD(95-30)= 117.2*e-16.76(depth)+9.42
R = 0.96692
A
0.05
0.15
0.25
0.35
0 20 40 60 80 100
B
Depth (m)
RPD(95-30)=117.2*e-12.85(depth)+3.81
R = 0.98742
RPD (90-30 and 95-20)=83.45*e-9.84(depth)+5.03
R = 0.95612
0.05
0.15
0.25
0.35
0 20 40 60 80 100
C
Depth (m)
RPD(95-30)= 95.0*e-13.34(depth)+8.53
R = 0.96932
RPD(90-20)= 134.9*e-16.72(depth)+7.01
Scientia Agricola, v.56, p.489-499, 1999. DOI: 10.1590/S0103-90161999000200032.
CARNEVALLI, R.A.; SILVA, S.C.; BUENO, A.A.O.; UEBELE, M.C.; BUENO, F.O.; HODGSON, J.; SILVA, G.N.; MORAIS,
J.P.G. Herbage production and grazing losses in Panicum maximum cv. Mombaça under four grazing managements.
Tropical Grasslands, v.40, p.165-176, 2006.
CARVALHO, M.S.S.; PEDREIRA, C.G.S.; TONATO, F. Análise
de crescimento de capins do gênero Cynodon submetidos a frequências de colheita. Boletim da Indústria Animal, v.69, p.041-049, 2012.
COSTA, C.A.A.; ANDRADE, A.C.; MAGALHÃES, J.A.; MEHL, H.U.; RODRIGUES, B.H.N.; SILVA, E.M. da; BITENCOURT, A.B.; SANTOS, F.J.S.; LUCENA COSTA, N. Características
agronômicas dos capins Digitaria sp. e Cynodon dactylon cv. Tifton-85 sob diferentes alturas de resíduo. PubVet, v.7, art. 1509, 2013. DOI: 10.22256/pubvet.v7n5.1510.
COSTA, F. da; PEREYRA, R.O.; PACIORNIK, S.; ABREU,
J.B.R. de. Distribuição vertical das características morfológicas do sistema radicular de Brachiaria humidicola. Pasturas
Tropicales, v.24, p.14-20, 2002.
CUNHA, F.F. da; RAMOS, M.M.; ALENCAR, C.A.B. de; MARTINS, C.E.; CÓSER, A.C.; OLIVEIRA, R.A. de. Sistema
radicular de seis gramíneas irrigadas em diferentes adubações nitrogenadas e manejos. Acta Scientiarum. Agronomy, v.32, p.351-357, 2010. DOI: 10.4025/actasciagron.v32i2.1020.
INMET. Instituto Nacional de Meteorologia. Estações e Dados:
RJ - Seropédica - Ecologia Agrícola. Available at: ˂http://www. inmet.gov.br/portal/index.php?r=estacoes/estacoesAutomaticas˃.
Accessed on: Aug. 29 2017.
KAISER, D.R.; REINERT, D.J.; REICHERT, J.M.; COLLARES, G.L.; KUNZ, M. Intervalo hídrico ótimo no perfil explorado
pelas raízes de feijoeiro em um Latossolo sob diferentes níveis de compactação. Revista Brasileira de Ciência do Solo, v.33, p.845-855, 2009. DOI: 10.1590/S0100-06832009000400009.
MONTEIRO, F.A.; CONSOLMAGNO NETO, D. Sistema
radicular do capim-tanzânia adubado com potássio e magnésio.
Revista Brasileira de Zootecnia, v.37, p.810-818, 2008. DOI:
10.1590/S1516-35982008000500005.
MUELLER, K.E.; TILMAN, D.; FORNARA, D.A.; HOBBIE,
S.E. Root depth distribution and the diversity-productivity relationship in a long-term grassland experiment. Ecology, v.94, p.787-793, 2013. DOI: 10.1890/12-1399.1.
PEDREIRA, B.C. e; PEDREIRA, C.G.S.; SILVA, S.C. da.
Estrutura do dossel e acúmulo de forragem de Brachiaria brizantha cultivar Xaraés em resposta a estratégias de pastejo.
Pesquisa Agropecuária Brasileira, v.42, p.281-287, 2007. DOI:
10.1590/S0100-204X2007000200018.
PEDREIRA, C.G.S. Gênero Cynodon. In: FONSECA, D.M. da;
MARTUSCELLO, J.A. (Ed.). Plantas Forrageiras. Viçosa: Ed.
da UFV, 2010. p.78-130.
PLAZA-BONILLA, D.; ÁLVARO-FUENTES, J.; HANSEN, N.C.; LAMPURLANÉS, J.; CANTERO-MARTÍNEZ, C. Winter
cereal root growth and aboveground-belowground biomass ratios
as affected by site and tillage system in dryland Mediterranean conditions. Plant Soil, v.374, p.925-939, 2014. DOI: 10.1007/ s11104-013-1926-3.
RIBEIRO, O.L.; CECATO, U.; RODRIGUES, A.M.; FAVERI, J.C.; JOBIM, C.C.; LUGÃO, S.M.B. Biomassa radicular e reservas
orgânicas em coastcross consorciada ou não com Arachis pintoi, com e sem nitrogênio, sob pastejo. Revista Brasileira de Saúde e
Produção Animal, v.12, p.318-328, 2011.
RODRIGUES FILHO, J.A.; AZEVEDO, G.P.C. de; CAMARÃO, A.P.; COSTA, P.A. da. Produção de forragem e valor nutritivo do
capim-estrela (Cynodon nlemfuensis Vanderyst) em três idades de corte. Pasturas Tropicales, v.22, p.28-34, 2000.
RODRIGUES, R.C.; MOURÃO, G.B.; VALINOTE, A.C.; HERLING, V.R. Reservas orgânicas, relação parte aérea–raiz e
c–n e eliminação do meristema apical no capim-xaraés sob doses de nitrogênio e potássio. Ciência Animal Brasileira, v.8, p.505-514, 2007.
SANTOS, H.G. dos; JACOMINE, P.K.T.; ANJOS, L.H.C. dos; OLIVEIRA, V.A. de; LUMBRERAS, J.F.; COELHO, M.R.; ALMEIDA, J.A. de; CUNHA, T.J.F.; OLIVEIRA, J.B. de.
Sistema brasileiro de classificação de solos. 3.ed. rev. e ampl.
Brasília: Embrapa, 2013. 353p.
SANTOS, R.S.M. dos; OLIVEIRA, I.P. de; MORAIS, R.F. de; URQUIAGA, S.C.; BODDEY, R.M.; ALVES, B.J.R. Componentes da parte aérea e raízes de pastagens de Brachiaria
spp. em diferentes idades após a reforma, como indicadores de
produtividade em ambiente de Cerrado. Pesquisa Agropecuária
Tropical, v.37, p.119-124, 2007.
SARMENTO, P.; RODRIGUES, L.R. de A.; LUGÃO, S.M.B.; CRUZ, M.C.P. da; CAMPOS, F.P. de; FERREIRA, M.E.;
OLIVEIRA, R.F. de. Sistema radicular do Panicum maximum Jacq. cv. IPR-86 Milênio adubado com nitrogênio e submetido à lotação rotacionada. Revista Brasileira de Zootecnia, v.37, p.27-34, 2008.
SILVA, L.V. da; CÂNDIDO, M.J.D.; PESSOA, J.P.M.; CAVALCANTE, A.C.R.; CARNEIRO, M.S. de S.; SILVA, A. do N. Componentes da biomassa e características estruturais em
capim-aruana sob diferentes frequências e intensidades de desfolhação.
Pesquisa Agropecuária Brasileira, v.50, p.1192-1200, 2015.
DOI: 10.1590/S0100-204X2015001200009.
SILVEIRA, C.P.; MONTEIRO, F.A. Influência da adubação com
nitrogênio e cálcio nas características morfológicas e produtivas das raízes de capim-tanzânia cultivado em solução nutritiva.
Revista Brasileira de Zootecnia, v.40, p.47-52, 2011. DOI:
10.1590/S1516-35982011000100007.
SORIANO, V. de S.; KOZLOSKI, G.V.; QUADROS, F.L.F. de; PIRES, C.C.; GRIEBLER, L. Produção animal e vegetal em pastagem de Cynodon manejada sob diferentes ofertas de
forragem por ovinos de dois grupos genéticos. Ciência Rural, v.43, p.139-144, 2013. DOI: 10.1590/S0103-84782012005000149.
ZANINE, A. de M.; NASCIMENTO JÚNIOR, D. do; SANTOS, M.E.R.; PENA, K. da S.; SILVA, S.C. da; SBRISSIA, A.F. Características estruturais e acúmulo de forragem em
capim-tanzânia sob pastejo rotativo. Revista Brasileira de
Zootecnia, v.40, p.2364-2373, 2011. DOI:
10.1590/S1516-35982011001100012.