TANZANIA GRASS STRUCTURE GRAZED BY GOATS MANAGED WITH
DIFFERENT RESIDUAL LEAF AREA INDEX UNDER INTERMITTENT
STOCKING
ESTRUTURA DO CAPIM TANZÂNIA MANEJADO EM DIFERENTES ÍNDICES DE
ÁREA FOLIAR RESIDUAL PASTEJADO POR CAPRINOS SOB LOTAÇÃO
INTERMITENTE
Nailson Lima Santos LEMOS
1; Ana Cláudia RUGGIERI
2; Victor COSTA E SILVA
3;
Andressa Fernanda CAMPOS
3; Euclides Braga MALHEIROS
2;
Izabelle Auxiliadora Molina de Almeida TEIXEIRA
21. Pós-doutorando em Zootecnia – Universidade Federal do Ceará - UFC, Fortaleza, CE, Brasil. [email protected]; 2. Professor, Douto, Departamento de Zootecnia – Universidade Estadual Paulista - UNESP, Jaboticabal, SP, Brasil; 3. Doutorando em
Zootecnia – UNESP, Jaboticabal, SP, Brasil.
ABSTRACT: The objective of this study was to evaluate the structure of Tanzania grassland grazed by goats managed with different residue leaf area index (RLAI) under intermittent stocking. The experiment was carried out from February to August, 2008. The treatments consisted of three different targets RLAI (0.8, 1.6 and 2.4) and 95% light interception (LI) criterion determined the rest period. Forage samples were collected at average height sampling points and weighed. Subsequently, a smaller sample was removed to separate the morphological components (leaf, stem and dead material) and to determine the structural and productive features. The canopy architecture was evaluated by the method of inclined point quadrat. The pre-grazing height in the paddocks were significantly different among treatments. RLAI influenced dry matter contents of green forage, leaf, stem and total, with the exception of dry matter of dead material, where the lowest values were observed for 0.8 RLAI. Thus, RLAI modifies canopy structure and is sensitive to canopy height changes throughout the year. Pasture regrowth is not compromised by residual leaf area indexes between 0.8 and 2.4, when climatic factors are not limiting.
KEYWORDS:Canopy analyzer. Forage mass. Inclined point quadrat. Light interception. Stubble. INTRODUCTION
Pasture inadequate management results from neglecting a fundamental condition necessary to balance the grassland ecosystems, which is the fine adjustment between supply and demand for good quality forage. If this balance is not achieved, plant productive capacity is compromised and the whole system becomes inefficient. So, it is important that pasture management takes into account grazing frequency and stubble in order to attain the conditions necessary to growth and development of forage system under either continuous or rotational stocking.
Research on the use of light interception to set grazing frequency date back to the 50´s, a study conducted by Brougham. Korte et al. (1982) showed that 95% light interception (LI) could be used as a criterion for pre-grazing that during the vegetative phase; this criterion is valid year round without compromising forage growth rate. However, they concluded that controlling reproductive development is more important than LI management as criteria for early grazing.
Currently, research focuses on intensity of defoliation that may present different responses during the year depending on the environment. Thus, the stubble of one period reflects on the next and may generate positive or negative response on the forage, animal performance or both, simultaneously. Stubble height and forage mass have been used often to define when to stop or adjust grazing, and animal load as well; however, these variables are lightly influenced by climate conditions. According to Korte et al. (1982) similar forage heights and masses may have different leaf area depending on the survival rate and the proportion of leaves.
The classical model proposed by Chapman e Lemaire (1993), widely discussed by Da Silva e Nascimento Junior (2007) showed that for tropical plants, the interaction between the morphogenetic and structural characteristics of the pasture results in a LAI that is crucial to promote changes of canopy structure in subsequent periods. Therefore, the purpose of this study was to evaluate the changes of canopy structure over time under different residual LAI (RLAI), and to generate a potential RLAI that can be maintained in the plant community without compromising forage performance.
MATERIAL AND METHODS
The experimental area was utilized with 18 paddocks of 243 m2 Panicum maximum Jacq. cv. Tanzania grassland in the College of Agriculture and Veterinary Sciences (FCAV), São Paulo State University (UNESP), Jaboticabal, Sao Paulo, Brazil. The treatments consisted of three targets of RLAI, 0.8, 1.6 and 2.4, arranged in randomized block design with six repetitions. The RLAI was the criterion for period of animal occupation and 95% light interception the criterion to determine grazing frequency according to intermittent stocking management.
The soil is classified as dystrophic Red Latosol, clay texture moderate, kaolinite hypoferric and gently undulating (EMBRAPA, 2006). The climate is classified as Aw, described as tropical, with well defined dry winters from June to September and rainy summers, with rainfall from December to March.
The experimental period lasted from February to March, 2008 (first grazing cycle); from March to April, 2008 (second grazing cycle) and from May to August, 2008 (third grazing cycle). During August, 2007 soil samples were collected at depths from 0 to 20 cm, in order to detect possible deficiencies and make the necessary corrections.
The soil of the experimental site had a pH of 5.6, considered suitable for grass. The phosphorus (P) and potassium (K) levels were, respectively, 28.0 mg/dm3 and 2.7 mmolc/dm3. The paddocks were fertilized with 150 kg/ha of N (urea), split into three doses of 50 Kg/ha each, during January, March and April. There was no need for fertilization with phosphorus (P) and potassium (K), since soil chemical composition met the mineral requirements of the grass.
Both LAI and LI of the grassland were measured with the aid of a Decagon AccuPAR canopy analyzer, model LP-80 (USA). Twenty random readings were conducted per paddocks, between 9 and 12 o´clock, according to the equipment manual. RLAI was estimated for the paddocks that were being grazed daily, until the sward reached the desired residue LAI. LI was determined in the paddocks at recovery period weekly, and then daily when LI reached about 90%. Sward RLAI was controlled by adjusting the stocking rate in each paddock following the put-and-take stocking method, according to Mott (1960). Number of animals was adjusted daily following routine RLAI measurement, aiming to reach the recommended residue level after approximately three days. This adjustment was reached by the equation below: daily LAI = (critical LAI – residual LAI treatment) /stocking days – that is, the difference between critical LAI (95% LI) and recommended (0.8; 1.6; or 2.4 RLAI) divided by stocking days, resulted in an estimated LAI that should be consumed per day. When the measured value was lower than the daily LAI given by the mathematical equation, animal stocking was reduced by taking from the paddock regulator animals; likewise, when the value was higher, animal stock was increased by putting regulator animals. Eight crossbred Boer x Saanen goats, average age 6 months, were used as test animals per treatment, and a variable number of regulator animals. Daily grazing lasted 11 hours (7 a.m. to 6 p.m.) and the goats were housed during the night.
average canopy height forage samples were collected at soil level with the aid of pruning shears and ring (0,25 m2). After weighing, a 400 g subsample was taken and separated into the following morphological components: stem, stem+sheath and dead material. The number of tillers was counted for each sample to determine tiller density (tiller/m2). Subsequently, plant morphological components were placed in paper bags and taken to a dryer air circulation (55 ºC) during 72 hours and weighed soon afterwards to determine dry matter of each component. Component dry matter data were used to determine the following ratios leaf:stem, green mass:dead material; as well as dry matter of green forage, leaf, stem and dead material, and finally, total dry matter in kg DM/ha.
The experimental data were analyzed using the SAS 9.0 statistical program. The variables were analyzed as a split-plot design by the MIXED
procedure, which looked at the best structure of the covariance matrix. Treatment means were compared by Tukey test at 5%.
RESULTS AND DISCUSSION
RLAI values of 0.8, 1.6 and 2.4 were reached after average 37days/67days; 37days/42days and 37days/42days rest periods, respectively, over three grazing cycles.
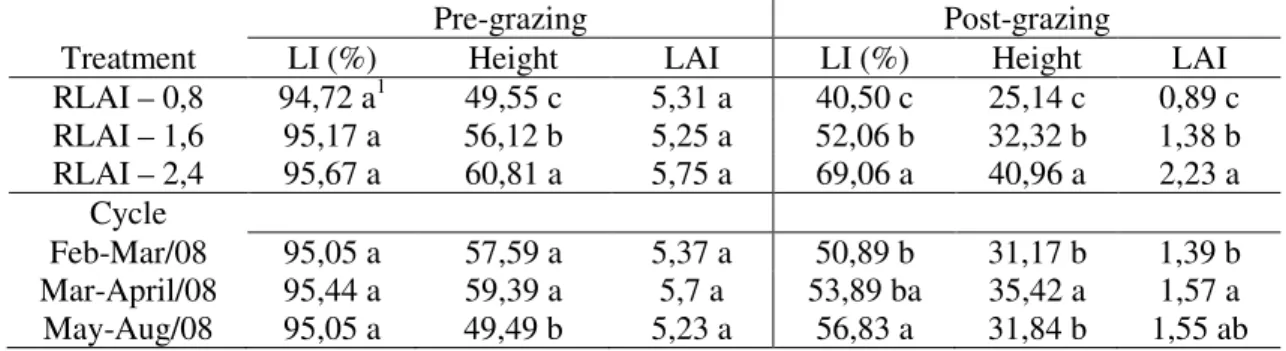
Pre-grazing light interception values (LI) shown in Table 1 indicated that the 95% LI target to put the animals in the paddock was reached, and average critical LAI values were 5.4 for different RLAI. According to Parsons et al., (1988), critical LAI is reached when 95% of the incident radiation is intercepted. Humphereys (1991) reported that, for pastures in general, LAI values lie typically between 3 and 5.
Table 1. Light interception (LI), average height (Height) and leaf area index (LAI), pre and post-grazing of Tanzania grass submitted to different RLAI*, along the grazing cycles.
Pre-grazing Post-grazing
Treatment LI (%) Height LAI LI (%) Height LAI
RLAI – 0,8 94,72 a1 49,55 c 5,31 a 40,50 c 25,14 c 0,89 c
RLAI – 1,6 95,17 a 56,12 b 5,25 a 52,06 b 32,32 b 1,38 b
RLAI – 2,4 95,67 a 60,81 a 5,75 a 69,06 a 40,96 a 2,23 a
Cycle
Feb-Mar/08 95,05 a 57,59 a 5,37 a 50,89 b 31,17 b 1,39 b
Mar-April/08 95,44 a 59,39 a 5,7 a 53,89 ba 35,42 a 1,57 a
May-Aug/08 95,05 a 49,49 b 5,23 a 56,83 a 31,84 b 1,55 ab
1 Means followed by the same letter do not differ by Tukey (P>0,05).
* Structure of Covariance matrix: AR (1) - autoregressive.
In the pre-grazing, the residue of less intensive grazing resulted in higher plants. This fact indicates that shorter residue allows the grass to grow more prostrate, modify foliage arrangement and increase the efficiency of light interception. Although, different RLAI resulted in plants with changing heights, it did not change LI and LAI. Likewise, this plasticity was observed over the grazing cycles, which had lower pre-grazing heights in the last cycle (May-Aug/08), a period of increased solar radiation.
According to Lemaire & Agnusdei (2000), swards can be considered a highly adjustable system, where any structural change determines responses of plant morphogenesis and, in turn, modifies canopy structure. These authors stated that this phenomenon known as phenotypic or morphological plasticity, is very important for plant adaption process to defoliation. Pearce et al. (1967) stated that vertical leaves may intercept less light
treatments, and as a consequence, differences in residual LI were also found.
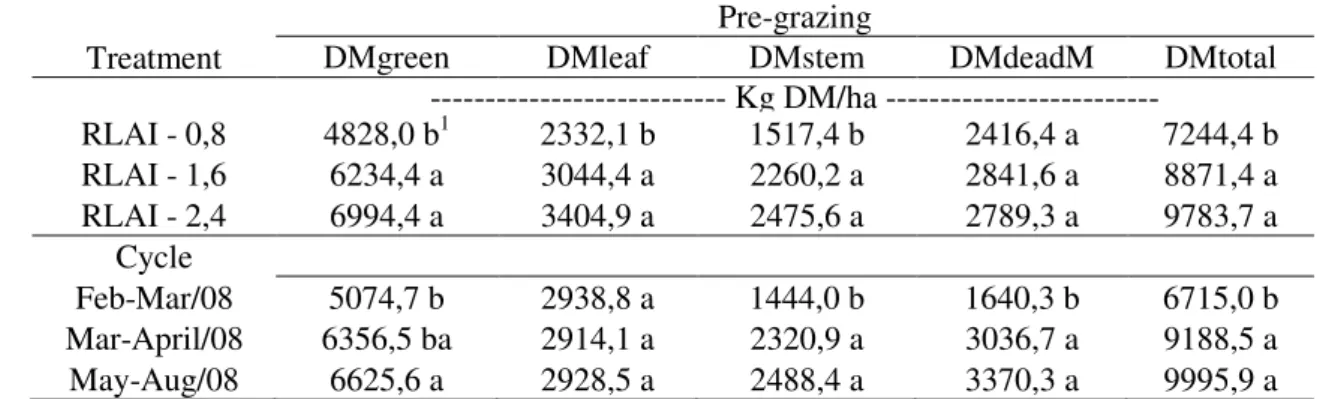
Despite the fact that same pre-grazing criterion was adopted for sward management (95% LI), DMleaf and DMstem contents were affected by the lowest RLAI (0.8). The highest intensity grazing resulted in less elongated stem and consequently, less stem dry matter. Thus, the smaller stem resulted in smaller green leaves because the ligule was more
quickly exposed compared to the other treatments, which probably reduced leaf dry mass (Table 2). According to Lemaire & Chapman (1996), leaf final length is a plastic trait responsive to defoliation. Pena et al. (2009) reported lower values of leaf final length for 25 cm height in response to decreased length of leaf sheath, when submitted to more severe defoliation as demonstrated by Duru and Ducrocq (2000), while the opposite is also true.
Table 2. Dry matter contents of green forage (DMgreen), leaf (DMleaf), stem (DMstem), dead material dry matter (DMdeadM) and total (DMtotal), in the pre-grazing, submitted to different RLAI *, along the grazing cycles.
Pre-grazing
Treatment DMgreen DMleaf DMstem DMdeadM DMtotal
--- Kg DM/ha ---
RLAI - 0,8 4828,0 b1 2332,1 b 1517,4 b 2416,4 a 7244,4 b
RLAI - 1,6 6234,4 a 3044,4 a 2260,2 a 2841,6 a 8871,4 a
RLAI - 2,4 6994,4 a 3404,9 a 2475,6 a 2789,3 a 9783,7 a
Cycle
Feb-Mar/08 5074,7 b 2938,8 a 1444,0 b 1640,3 b 6715,0 b
Mar-April/08 6356,5 ba 2914,1 a 2320,9 a 3036,7 a 9188,5 a
May-Aug/08 6625,6 a 2928,5 a 2488,4 a 3370,3 a 9995,9 a
1 Means followed by the same letter do not differ by Tukey (P>0,05); * Structure of Covariance matrix: AR (1) - autoregressive.
In the post-grazing, DMdeadM were not significantly different, but dry matter of DMgreen and DMtotal changed with changing RLAI (P<0.05). The RLAI 0.8 yielded the smallest forage
mass. This result may be attributed to the experimental treatments, since different RLAI results in different post-grazing stubble (Table 3).
Table 3. Dry matter of green forage (DMgreen), dead material (DMdeadM) and total (DMtotal) in the post-grazing, of Tanzania grassland submitted to different RLAI* along the grazing cycles.
Post-grazing
Treatment DMgreen DMdeadM DMtotal
--- Kg DM/ha ---
RLAI - 0,8 2974,5 c1 2482,4 a 5456,9 b
RLAI - 1,6 4018,5 b 2937,1 a 6955,5 ab
RLAI - 2,4 5531,4 a 2992,3 a 8693,5 a
Cycle
Feb-Mar/08 3417,3 b 1899,4 b 5316,8 b
Mar-April/08 4807,8 a 3337,0 a 8314,6 a
May-Aug/08 4299,2 a 3175,3 a 7474,5 a
1 Means followed by the same letter do not differ by Tukey (P>0,05); * Structure of Covariance matrix: AR (1) - autoregressive.
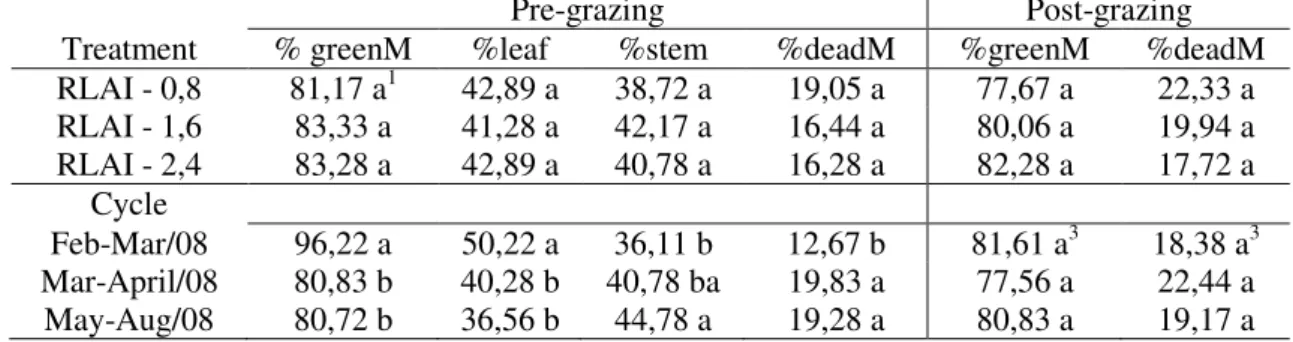
The pre-grazing ratios of green mass, leaf and stem in the forage, as well as dead material were not significantly (P>0.05) affected by changing RLAI (Table 4); but they did change over time. In the post-grazing, the green mass ratio (P>0.05) and the percentage of dead material (P=0,063) did not change with either changing RLAI or grazing cycles.
The Tanzania grass of this experiment displayed different values for dry matter of green
Table 4. Percentage of green mass (%greenM), leaf (%leaf), stem (%stem) and dead material (%deadM) in the pre-grazing, and green mass (%greenM) and dead material (%deadM) in the post-grazing of a Tanzania grassland submitted to different RLAI*, along grazing cycles.
Pre-grazing Post-grazing
Treatment % greenM %leaf %stem %deadM %greenM %deadM
RLAI - 0,8 81,17 a1 42,89 a 38,72 a 19,05 a 77,67 a 22,33 a RLAI - 1,6 83,33 a 41,28 a 42,17 a 16,44 a 80,06 a 19,94 a RLAI - 2,4 83,28 a 42,89 a 40,78 a 16,28 a 82,28 a 17,72 a
Cycle
Feb-Mar/08 96,22 a 50,22 a 36,11 b 12,67 b 81,61 a3 18,38 a3 Mar-April/08 80,83 b 40,28 b 40,78 ba 19,83 a 77,56 a 22,44 a
May-Aug/08 80,72 b 36,56 b 44,78 a 19,28 a 80,83 a 19,17 a
1 Means followed by the same letter do not differ by Tukey (P>0,05); * Structure of Covariance matrix: AR (1) - autoregressive.
Table 5. Dry matter per tiller (DM/tiller), tiller density (tiller/m2), leaf:stem (L/S) and green mass:dead material (greenM/deadM) ratios in pre-grazing, and green mass:dead material (greenM/deadM) ratio in post-grazing, of Tanzania grassland submitted to different RLAI*, along grazing cycles
Pre-grazing Post-grazing
Treatment DM/tiller 1 tiller/m2 L/S greenM/deadM greenM/deadM
RLAI - 0,8 0,16 b2 1048,29 a 1,77 a 2,92 a 1,37 b
RLAI - 1,6 0,20 ba 1277,65 a 1,55 a 3,03 a 1,63 b
RLAI - 2,4 0,22 a 1179,06 a 1,62 a 2,85 a 2,10 a
Cycle
Feb-Mar/08 0,22 a 649,2 b 2,34 a 4,10 a 1,94 a
Mar-April/08 0,18 ab 1344,8 a 1,36 b 2,49 b 1,68 ab
May-Aug/08 0,17 b 1511 a 1,23 b 2,21 b 1,49 b
1 Dry matter values are expressed as g DM/tiller; 2 Means followed by the same letter do not differ by Tukey (P>0,05); * Structure of Covariance matrix: AR (1) - autoregressive.
The first grazing cycles resulted in lower DM/tiller (P<0.05), showing that tiller weight decreases when tiller density increases. In the last two grazing cycles (Mar-April/08 and May-Aug/08) the ratios leaf/stem and green mass/dead material were similar (P>0.05), but lower than the first grazing cycle. In the post-grazing, the green mass/dead material ratios were similar (P>0.05) for 0.8 and 1.6 RLAI and lower for 2.4 RLAI (P<0.05) (Table 5).
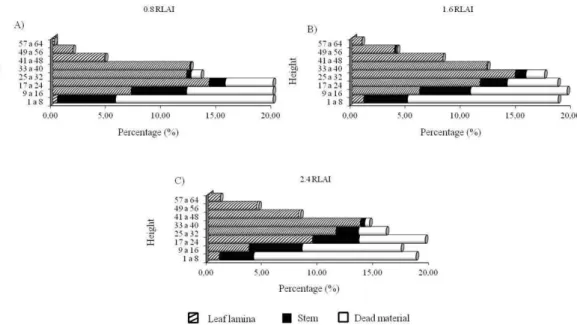
Figure 1 shows that the pitch was quite dense and displayed high percentage of stem and dead material in the first 24, 32 and 40 cm for the RLAI of 0.8, 1.6 and 2.4, respectively. However, average post-grazing heights of 25, 32 and 41 cm (Table 1) for the RLAI of 0.8, 1.6 and 2.4, respectively; show that increasing grazing intensity to adjust the RLAI for the different treatments forced the goats to graze in the paddocks until they reached the strata with greater stem participation, thus effectively controlling this component. Difante et al. (2009) observed higher proportions of stem and dead material in the layer between 25 and 50 cm tall and higher proportions of leaf in the strata above 50 cm.
The efficient control of stem elongation, resulting from the habit exhibited by the goats of selecting the youngest leaves of the canopy, the large majority non-expanded leaves, induced to strong tillering by capturing the meristem, which breaks the apical dominance and consequently, stimulates sprouting of new tillers. This fact resulted in high tiller density, along with low DM/tiller during the grazing cycles (Table 5). According to Zarrough and Nelson (1980), the two components of plant weight, tiller number and weight, vary inversely.
Figure 1. Canopy structure of Tanzania grassland with different Residual Leaf Area Index (RLAI); A) 0.8 RLAI; B) 1.6 RLAI and C) 2.4 RLAI.
In this study, DMleaf did not change over time; however, the complete restoration of leaf area to capture 95% LI was possible by increasing the rest period, which resulted in pasture qualitative losses due to increasing dry matter of both, stem and dead material (P<0.05) (Table 2).
The effect of the grazing cycle is clearly evident in the proportion of morphological components. Successive grazing cycles decreased the proportion of leaves and increased stem and dead material contribution in the canopy architecture (Table 4), which changed the resulting forage mass during the grazing cycles (Table 2). Nevertheless, these results show that these components are distributed in different layers in the canopy and the most efficient canopy architecture management should have higher percentage of stem and dead material in layers below 32 cm and leaves in the upper layers (Figure 1).
Difante et al. (2010) found no differences for the ratios between leaves and dead material for the heights between 25 and 50 cm, however, the authors observed that the stem proportion was
higher for pastures managed with post-grazing residue of 50 cm. Thus, the authors stated that higher post-grazing stubble promote less control of canopy architecture and may affect accumulation and the nutritive value of the forage produced in the medium and long term. On the other hand, shorter stubble promotes greater tissue renewal, which is associated with more efficient forage production (MARCELINO et al., 2006).
CONCLUSION
The RLAI modifies canopy structure and is sensitive to sward changes throughout the year. The regrowth of the sward is not compromised when RLAI ranges from 0.8 to 2.4, and climatic factors are not limiting. From the results presented, it can be concluded that 1.6 RLAI combined with 32 cm height is recommended for grazing goats during the rainy season, due to high leaf dry matter, good canopy structure and good stocking rate per unit area.
a estrutura da planta e é sensível a mudanças na altura do dossel ao longo do ano. Índices de área foliar residual entre 0,8 e 2,4 não comprometem a rebrota do pasto, quando os fatores climáticos não são limitantes.
PALAVRAS-CHAVE: Analisador de dossel. Interceptação luminosa. Massa de forragem. Ponto inclinado. Resíduo.
REFERENCES
BARBOSA, R. A.; NASCIMENTO JR, D.; EUCLIDES, V. P. B; DA SILVA, S. C.; ZIMMER, A. H.; TORRES JR, R. A. de A. Capim-tanzânia submetido a combinações entre intensidade e frequencia de pastejo. Pesquisa Agropecuária Brasileira, Brasília, v. 42, n. 3, p. 329-340. 2007.
BROUGHAM, R. W. A study in rate of pasture growth. Australian Journal of Agriculture Research, v. 6, p. 804-12. 1955.
BROUGHAM, R. W. Effect, of intensity of defoliation on regrowth of pasture. Australian Journal of Agriculture Research, v. 7, p. 377-87. 1956.
CHAPMAN, D. F.and LEMAIRE, G. Morphogenetic and structural determinants of plant regrowth after defoliation. In: BAKER, M. J. (Ed.). Grasslands for our world. Sir Publishing, Wellington, p. 55-64. 1993.
CUNHA, B. A. L.; NASCIMENTO JR, D.; SILVEIRA, M. C. T. da; MONTAGNER, D. B.; EUCLIDES, V. P. B.; DA SILVA, S. C.; SBRISSIA, A. F.; RODRIGUES, C. S.; SOUSA, B. M. L.; PENA, K. S.; VILELA, H. H.; SILVA, W. L. Effects of two post-grazing heights on morphogenic and structural characteristics of guinea grass under rotational grazing. Tropical Grasslands, v. 44, p. 253–259. 2010.
DA SILVA, S. C.; NASCIMENTO JR, D. Avanços na pesquisa com plantas forrageiras tropicais em pastagens: características morfofisiológicas e manejo do pastejo. Revista Brasileira de Zootecnia, v. 36, suplemento especial, p. 121-138. 2007.
DA SILVA, S. C.; BUENO, A. A. de O.; CARNEVALLI, R. A.; UEBELE, M. C.; BUENO, F. O.;
HODGSON, J.; MATTHEW, C.; ARNOLD, G. C. ; MORAIS, J. P. G. de. Sward structural characteristics and herbage accumulation of Panicum maximum cv. Mombaça subjected to rotational stocking managements. Scientia Agricola, Piracicaba, v. 66, n. 1, p. 8-19. 2009.
DIFANTE, G. S; NASCIMENTO JR., D.; EUCLIDES, V. P. B. DA SILVA, S. C.; BARBOSA, R. A.; GONÇALVES, W. V. Sward structure and nutritive value of tanzânia guineagrass subjected to rotational stocking managements. Revista Brasileira de Zootecnia (on line), v. 38, n. 1, p. 9-19. 2009.
DIFANTE, G. S; EUCLIDES, V. P. B.; NASCIMENTO JR., D.; DA SILVA, S. C.; BARBOSA, R. A.; TORRES JR, R. A. de A. Desempenho e conversão alimentar e novilhos de corte em capim-tanzânia
submetidos a duas intensidades de pastejo sob lotação rotativa. Revista Brasileira de Zootecnia (on line), v. 39, n. 1, p. 33-41. 2010.
DURU, M.; DUCROCQ, H. Growth and senescence of the successive grass leaves a tiller ontogenic development and effect of temperature. Annals of Botany, London, v. 85, p. 635-643. 2000.
EMBRAPA. Empresa Brasileira de Pesquisa Agropecuária. Sistema Brasileiro de Classificação de Solos. Seminário Nacional de Levantamento e Conservação deSolos. Brasília: EMBRAPA, 2006. 2a ed. 306p. 2006.
HUMPHEREYS, L. R. Tropical pasture utilization. Cambridge University Press, 1991. 206 p. 1991.
KORTE, C. J.; WATKIN, B. R.; HARRIS, W. Use of residual leaf area index and light interception as criteria for spring grazing management of a ryegrass-dominant pasture. New Zealand Journal of Agricultural Research, Wellington, v. 25, p. 309- 319. 1982.
LACA, E. A. and LEMAIRE, G. Measuring sward structure. In: MANNETJE, L.; JONES, R. M. (Eds). Field and laboratory methods for grassland animalproduction research. Wallingford: CABI International, 2000. p. 103-122. 2000.
LANA SOUSA, B. M. de; NASCIMENTO JR, D.; RODRIGUES, C. S.; MONTEIRO, H. C. de F.; DA SILVA, S. C.; FONSECA, D. M. da; SBRISSIA, A. F. Morphogenetic and structural characteristics of xaraes palisadegrass submitted to cutting heights. Revista Brasileira de Zootecnia, Viçosa, v.40, n.1, p.53-59. 2011.
LEMAIRE, G. and CHAPMAN, D. Tissue flows in grazed plant communities. In: HODGSON, J.; ILLIUS, A.W. (Eds.) The ecology and management of grazing systems. Wallingford: Cab International, 1996. p. 3-36. 1996.
LEMAIRE, G. and AGNUSDEI, M. Leaf tissue turnover and efficiency of herbage utilization. In: Simpósio Internacional “Grassland Ecophysiology and Grazing Ecology”, CAB International. p. 265-287. 2000.
MARCELINO, K. R. A.; NASCIMENTO JR, D.; DA SILVA, S. C.; EUCLIDES, V. P. B.; FONSECA, D. M. da. Características morfogênicas e estruturais e produção de forragem do capim-marandu submetido a
intensidades e frequências de desfolhação. Revista Brasileira de Zootecnia, Viçosa, v. 35, n. 6, p. 2243-2252. 2006.
MELLO, A. C. L. and PEDREIRA, C. G. S. Respostas morfológicas do capim-Tanzânia (Panicum maximum
Jacq. cv. Tanzânia-1) irrigado à intensidade de desfolha sob lotação rotacionada. Revista Brasileira de Zootecnia, Viçosa, v. 33, n. 2, p. 282-289. 2004.
MOTT, G. O. Grazing pressure and the measurement of pasture production. In: International Grassland Congress,8. Proceedings… British Grassland Association, p.606-611. 1960.
PARSONS, A. J.; JOHNSON, I. R.; HARVEY, A. Use of a model to optimize the interaction between frequency and severity of intermittent defoliation to provide a fundamental comparison of the continuous and intermittent defoliation of grass. Grass and Forage Science, Oxford, v. 43, p. 49-59. 1988.
PEARCE, R. B.; BROWN, R. H.; BLASER, R. E. Photosynthesis in plant communities as influenced by leaf angle. Crop Science, Madison, v. 7, p. 321-324. 1967.
PENA, K. da S.; NASCIMENTO JR, D.; DA SILVA, S. C.; EUCLIDES, V. P. B.; ZANINE, A. de M. Características morfogênicas, estruturais e acúmulo de forragem do capim tanzânia submetido a duas alturas e três intervalos de corte. Revista Brasileira de Zootecnia (on line), v. 38, n. 11, p. 2127-2136. 2009.
WARREN WILSON, J. Influence of spatial arrangement of foliage area on light interception and pasture growth. In: International Grassland Congress, 8., Reading, 1960. Proceedings. Oxford: Alden Press, 1961. p. 275-279. 1961.
WATSON, D. J. Comparative physiological studies on the growth of field crops: variation in net assimilation rate and leaf area between species and varieties and within and between years. Annals of Botany, Lond (N.S) v. 11,p. 41 – 76. 1947.