http://www.uem.br/acta ISSN printed: 1806-2636 ISSN on-line: 1807-8672
Doi: 10.4025/actascianimsci.v35i3.18749
Nutrient intake, productive performance and body measurements
of dairy heifers fed with different sources of protein
Diego Azevedo Mota1*, Telma Teresinha Berchielli2, Roberta Carrilho Canesin3, Bruna Laurindo Rosa3, Andressa Ferreira Ribeiro3 and Heitor Violin Brandt2
1
Departamento de Zootecnia, Universidade Federal do Oeste do Pará, Rua Vera Paz, s/n, 68035-110, Salé, Santarém, Pará, Brazil.
2
Departamento de Zootecnia, Universidade Estadual Paulista, Jaboticabal, São Paulo, Brazil. 3
Programa de Pós-graduação em Zootecnia, Universidade Estadual Paulista, Jaboticabal, São Paulo, Brazil. *Author for correspondence. E-mail: [email protected]
ABSTRACT. This study evaluated the effect of different protein sources (soybean meal, cottonseed meal, peanut meal and sunflower meal) on dry matter and nutrient intake, productive performance and body measurements of dairy heifers, Holstein x Zebu, recreated in confinement. The experiment consisted in a randomized complete block design made up by 6 replications and 4 treatments. The mean values of ingestion of ether extract (EEI, kg day-1) were statistically different (p < 0.05). The neutral detergent fiber intake (NDFI, %BW) also presented differences (p < 0.05), with higher values in the diet containing sunflower meal (1.01% BW) in relation to the diet with soybean meal (0.84% BW). The average daily weight gain using the diet with soybean meal was superior (0.95 kg day-1) to the diet with sunflower meal (0.82 kg day-1), and considering the final body weight, the diet with soybean meal was superior to the other treatments (p < 0.05). The heart girth presented greater association with body weight (0.93). The soybean meal promoted the best productive performance of crossbred Holstein x Zebu heifers fed diets based on sugarcane. However, cottonseed meal, peanut meal and sunflower meal can be possible alternatives to soybean meal.
Keywords: body measurement, daily gain, protein concentrate, sugarcane.
Consumo de nutrientes, desempenho produtivo e medidas corporais de novilhas leiteiras
alimentadas com diferentes fontes proteicas
RESUMO. Objetivou-seavaliar o efeito de diferentes fontes proteicas (farelo de soja, farelo de algodão, farelo de amendoim e farelo de girassol) sobre o consumo de matéria seca e nutrientes, desempenho produtivo e medidas corporais de novilhas leiteiras, mestiças Holandês x Zebu, recriadas em confinamento. O delineamento experimental foi em blocos completos casualizados, constituído por seis repetições e quatro tratamentos. Os valores médios de ingestão de extrato etéreo (IEE, kg dia-1) apresentaram diferença estatística (p < 0,05). A ingestão de fibra em detergente neutro em % do peso corporal foi superior (p < 0,05) na dieta com farelo de girassol (1,01 %PC) em relação à dieta com farelo de soja (0,84 %PC). O ganho médio de peso corporal promovido pela dieta com o farelo de soja foi superior (0,95 kg dia-1) à dieta com farelo de girassol (0,82 kg dia-1), e no peso corporal final a dieta com o farelo de soja foi superior aos demais (p < 0,05). A medida biométrica perímetro torácico apresentou maior grau de associação com o peso corporal (0,93). O farelo de soja proporciona melhor desempenho produtivo a novilhas mestiças Holandesa x Zebu, alimentadas com dietas à base de cana-de-açúcar. Contudo, o farelo de algodão, farelo de amendoim e farelo de girassol pode ser possíveis substitutos do farelo de soja.
Palavras-chave: medidas corporais, ganho diário, concentrados proteicos, cana-de-açúcar.
Introduction
Replacement heifers are the basis of any dairy exploitation system, and in Brazil they have an important participation in the production cost. Herd breeding is possible when older cows are replaced by better fed, healthy and genetically superior animals; however, dairy replacement heifers require adequate amounts of protein in the diet which enable healthy growth (HOFFMAN et al., 2001).
forage (MOTA et al., 2010). Soybean meal is the protein concentrate commonly used in dairy farming for being a feedstuff of proven high nutritional quality. Nevertheless, there is a growing interest from producers in information about alternative feeds, which can partially or totally replace the traditional ones, bringing reduction in the cost with feeding, as a consequence (QUEIROZ et al., 2012).
Another important point to be checked during the growth of heifers is the body development. Linear measurements as height and heart girth constitute the physical parameters of the animal (ROCHA et al., 2003) that help in decision making, regarding the management of this category.
Based on the above, the objective of this study was to evaluate the nutrient intake, productive performance and body measurements of feedlot dairy heifers fed diets based on sugarcane and different protein sources (soybean meal, peanut meal, cottonseed meal and sunflower meal).
Material and methods
The experiment was conducted in the feedlot (digestibility sector) of São Paulo State University, Campus Jaboticabal. Twenty-four crossbred Holstein x Zebu dairy heifers of initial body weight (BW) of 211.12 kg ± 25.65 kg and 16 months of age
were housed in individual 10 m2 stalls partially
covered, with concrete floor and provided with common drinkers for every two stalls and individual troughs, so as to allow individual animal feeding.
Heifers were grouped by weight (blocks) and subsequently distributed in the treatments at random, according to the feed supply. The experiment was composed of 28 days for adaptation to the facilities, management and experimental diets (the diets supplied during the adaptation period were the same as the experimental diets) and 84 days (three periods of 28 days) for data collection.
The diets were prepared according to the recommendations estimated by the Cornell Net Carbohydrate and Protein System (FOX et al., 1992) with the aid of diet formulation program
RLM®/Esalq-USP (2009). The estimation of weight
gain was done considering an average feed intake of 2.36% of body weight (BW), mean value of 0.80 kg day-1.
The sugarcane utilized as exclusive roughage was the variety SP80-2015, harvested manually every two days and shredded daily as a supply for the animals. The concentrates were composed of ground corn grains, mineral supplement, urea and different protein sources (soybean, cottonseed,
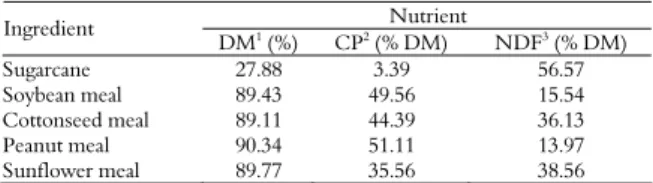
peanut and sunflower meals). The chemical composition of the protein sources and sugarcane are presented in Table 1.
Table 1. Chemical composition of the ingredients.
Nutrient Ingredient
DM1
(%) CP2
(% DM) NDF3
(% DM)
Sugarcane 27.88 3.39 56.57
Soybean meal 89.43 49.56 15.54
Cottonseed meal 89.11 44.39 36.13
Peanut meal 90.34 51.11 13.97
Sunflower meal 89.77 35.56 38.56
1 Dry matter; 2
Crude protein; 3
Neutral detergent fiber.
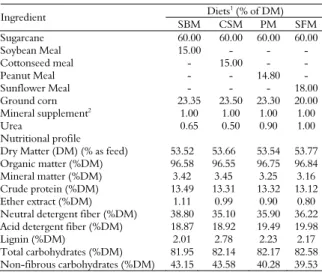
All experimental diets had the same level of protein and were supplied at a roughage:concentrate ratio of 60:40, on a dry matter basis. Experimental treatments were: SBM - diet containing 60% sugarcane and 40% concentrate based on soybean meal; CSM - diet containing 60% sugarcane and 40% concentrate based on cottonseed meal; PM - diet containing 60% sugarcane and 40% concentrate based on peanut meal; SFM - diet containing 60% sugarcane and 40% concentrate based on sunflower meal. The percentage of ingredients and chemical composition of the diets are presented in Table 2.
In the morning feeding (7:00am), animals received all the roughage and 50% of the total concentrate, whereas in the afternoon feeding (3:30PM), the remaining concentrate was provided and mixed to the feed present in the trough to stimulate consumption. Consumption was monitored to allow leftovers of 10% of the total supplied and for so, the amount of feed supplied was weighed daily and the leftovers from each animal were weighed at every three days to determine the nutrient intake.
At the end of each experimental period, a composite sample of feed supplied and leftovers per animal was formed and stored at -15ºC. After thawing, samples of feed and leftovers were dried in forced air oven at 55ºC and ground in a knife mill with 1 mm screen sieve (AOAC, 1990). Samples were subjected to the analyses of dry matter (DM), organic matter (OM), ether extract (EE), mineral matter (MM) and nitrogen (N) according to the AOAC (1990), described by Silva and Queiroz (2002), and for conversion into crude protein, the correction factor 6.25 was used.
Table 2. Chemical composition of the experimental diets.
Diets1 (% of DM)
Ingredient
SBM CSM PM SFM
Sugarcane 60.00 60.00 60.00 60.00
Soybean Meal 15.00 - - -
Cottonseed meal - 15.00 - -
Peanut Meal - - 14.80 -
Sunflower Meal - - - 18.00
Ground corn 23.35 23.50 23.30 20.00
Mineral supplement2
1.00 1.00 1.00 1.00
Urea 0.65 0.50 0.90 1.00
Nutritional profile
Dry Matter (DM) (% as feed) 53.52 53.66 53.54 53.77 Organic matter (%DM) 96.58 96.55 96.75 96.84 Mineral matter (%DM) 3.42 3.45 3.25 3.16 Crude protein (%DM) 13.49 13.31 13.32 13.12 Ether extract (%DM) 1.11 0.99 0.90 0.80 Neutral detergent fiber (%DM) 38.80 35.10 35.90 36.22 Acid detergent fiber (%DM) 18.87 18.92 19.49 19.98
Lignin (%DM) 2.01 2.78 2.23 2.17
Total carbohydrates (%DM) 81.95 82.14 82.17 82.58 Non-fibrous carbohydrates (%DM) 43.15 43.58 40.28 39.53 1SBM - diet containing 60% sugarcane and 40% concentrate based on soybean meal;
CSM - diet containing 60% sugarcane and 40% concentrate based on cottonseed meal; PM - diet containing 60% sugarcane and 40% concentrate based on peanut meal; SFM - diet containing 60% sugarcane and 40% concentrate based on sunflower meal. 2Composition of the product (Calcium: 146 g; Phosphorus: 40 g; Magnesium: 20 g;
Sulfur: 40 g; Sodium: 56 g; Copper: 350 g; Manganese: 900 mg; Zinc: 1300 mg; Iodine: 24 mg; Cobalt: 10 mg; Selenium: 10 mg; Fluorine (max.): 400 mg; Monensin: 670 mg).
The OM content was calculated by the difference between DM and MM, whereas the concentrations of total carbohydrates (TCHO) and non-fibrous carbohydrates (NFC) were obtained according to the methodology described by Sniffen et al. (1992).
At the end of the adaptation period and every 28 days, after fasting (solids) for 15 hours, animals were subjected to individual weighing for the determination of the average daily weight gain
(average daily gain in kg day-1) and of the body
measures height at the rump (HR), height at the withers (HW) and heart girth (HG). The coefficients of feed conversion (kg of weight gain
kg-1 of DM ingested), feed efficiency (kg of DM
ingested kg-1 of weight gain) and protein efficiency
(kg of weight gain / kg of CP ingested) were calculated through the data about the consumption of dry matter and crude protein associated with the values of average daily gain. The mean initial and final weights were obtained by the arithmetic mean weight (kg) of the animals in the first and last days within the period of data collection.
Measures were obtained with the aid of a standard measuring tape and animal measuring stick, according to recommendations of Cyrillo et al. (2001). Evaluations were carried out through equations for prediction of the body weight, proposed by Heinrichs et al. (1992), based on variables heart girth and height at the withers, respectively denominated H1 (BW = 102.71 – 2.876HG + 0.02655HG²) and H2 (BW = 632.13 –
16.837HW + 0.11989HW²), and two other equations proposed by Reis et al. (2008), based on variables heart girth and height at the rump, denominated R1 (BW = 1717 – 35.167HG + 0.23897HG² - 0.0004626HG³) and R2 (BW = 7581 – 4.151HG – 180.201HR + 0.024932HG² + 1.456103HR² - 0.00383079HR³).
The data on productive performance, body measures and nutrient intake were subjected to analysis of variance, by utilizing the command PROC GLM of the software SAS (2003), adopting the significance level of 5%. Weight and initial measures were used as co-variables for the analyses of the productive performance and body measures variables, respectively. Pearson’s correlation coefficients and body measures were calculated through command CORR, with 1% probability. Associations were considered weak up to the value of 0.40; medium associations from 0.41 to 0.70; and strong associations, above this value. The responses in weights estimated by equations H1, H2, R1 and R2 were compared to the weight observed by the Dunnett test using the software SAS (2003), with significance level of 5%, not considering the treatments, given the lack of differences in body measurements.
Results and discussion
The intake of dry matter (DMI), crude protein (CPI), mineral matter (MMI), organic matter (OMI) and neutral detergent fiber (FDNI), in kg
day-1, had not differ (p > 0.05) between the animals
that received the diets containing different sources of the evaluated protein (Table 3). However, the
mean values of ether extract intake (EEI, kg day-1)
presented statistical differences, in which the animals fed the diet with soybean meal (0.09 kg
day-1) were superior to the other treatments; and in
those which received the diet with cottonseed meal
(0.07 kg day-1), the EEI was superior to the diet with
sunflower meal (0.05 kg day-1) and was not different
(p > 0.05) from the diet with peanut meal. The variation in EEI was coherent with the concentration of this nutrient in the diets, which presented contents of 1.11; 0.99; 0.90 and 0.80 %DM in the diets containing soybean meal, cottonseed meal, peanut meal and sunflower meal, respectively.
The average of DMI in kg day-1 and %BW were
weight. The values were close to the preconized by the NRC (2001), which is 2.55% for dry matter intake in relation to body weight percentage of dairy heifers.
The results obtained in this study were higher than found by Queiroz et al. (2012) that obtained means of 4.8 kg dry matter per day and 2.1% for BW for diet composed of 70% forage and 30% concentrate, on a dry matter basis, which contained 13 % crude protein, using sugar cane as forage for feeding dairy heifers, Holstein x Gir, with averaging 250 ± 50 kg of body weight and 19 months of age.
Likewise, EEI and NDFI, described in percentage of body weight (%BW), also presented differences (p < 0.05). Since the inclusion of sugarcane was equal in all the diets (60% in the DM), the differences observed in NDFI and EEI (%BW) were caused by the difference in the concentrations of neutral detergent fiber (NDF) and ether extract (EE) in the concentrates studied due to the protein sources (Table 2).
The average daily gain (ADG) presented significant difference between the different protein sources studied (p < 0.05) (Table 4). The ADG of animals fed diet with soybean meal was not different
from the animals fed cottonseed and peanut meals, but was superior to those receiving the diet with sunflower meal (p < 0.05). The animals fed diet containing soybean meal have gained more weight than animals fed the other diets, and this result is a direct consequence of the dry matter intake of this diet. However, it should be noted that statistically there was no difference in the average daily gain between animals that consumed the diets that contained soybean meal, cottonseed meal and peanut meal.
The ADG values obtained in the diets were above the average gain estimated by the NRC
(2001), which was of 0.80 kg day-1 with an average
intake of 2.36% BW, provided by the diet
formulation program RLM®/Esalq-USP (2009).
This can be explained by the initial average body weight condition of the experimental animals, which was 211.12 kg ± 25.65 kg at 16 months of age on average, in the adaptation period. This age is within the interval (15 to 18 months) in which these animals should already present the suitable weight for mating, which is from 270 to 290 kg, for Girolando heifers.
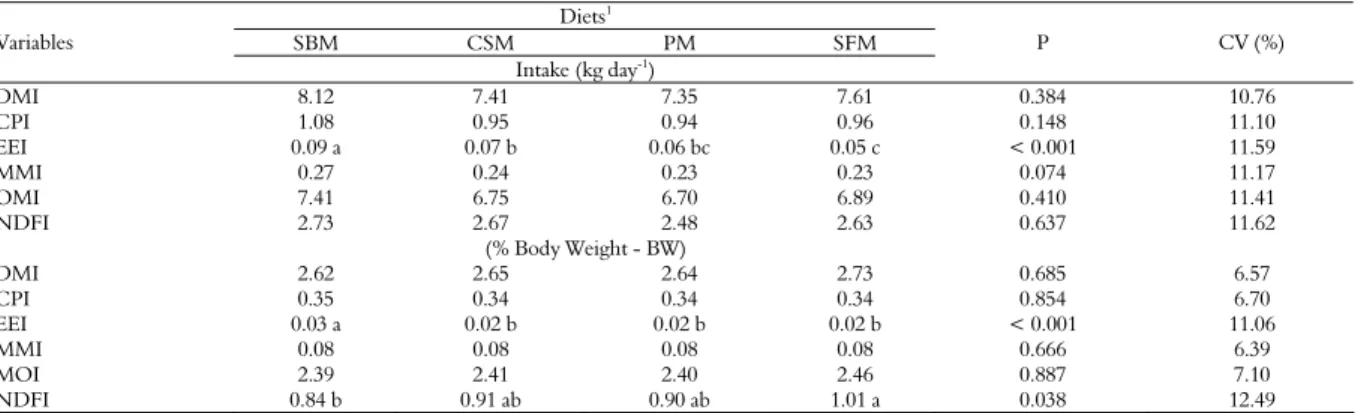
Table 3. Intake of dry matter (DMI), crude protein (CPI), ether extract (EEI), mineral matter (MMI), organic matter (OMI) and neutral detergent fiber (NDFI), in kg day-1
and percentage of body weight (% of BW) of crossbred Holstein x Zebu heifers fed diets based on sugarcane associated with different protein sources.
Diets1
SBM CSM PM SFM
Variables
Intake (kg day-1)
P CV (%)
DMI 8.12 7.41 7.35 7.61 0.384 10.76
CPI 1.08 0.95 0.94 0.96 0.148 11.10
EEI 0.09 a 0.07 b 0.06 bc 0.05 c < 0.001 11.59
MMI 0.27 0.24 0.23 0.23 0.074 11.17
OMI 7.41 6.75 6.70 6.89 0.410 11.41
NDFI 2.73 2.67 2.48 2.63 0.637 11.62
(% Body Weight - BW)
DMI 2.62 2.65 2.64 2.73 0.685 6.57
CPI 0.35 0.34 0.34 0.34 0.854 6.70
EEI 0.03 a 0.02 b 0.02 b 0.02 b < 0.001 11.06
MMI 0.08 0.08 0.08 0.08 0.666 6.39
MOI 2.39 2.41 2.40 2.46 0.887 7.10
NDFI 0.84 b 0.91 ab 0.90 ab 1.01 a 0.038 12.49
Mean values followed by the same letter in the row are not significantly different by Tukey’s test (α = 5%). P = probabilities; CV = coefficient of variation. 1SBM - diet containing 60% sugarcane and 40% concentrate based on soybean meal; CSM - diet containing 60% sugarcane and 40% concentrate based on cottonseed meal; PM - diet containing 60% sugarcane and 40% concentrate based on peanut meal; SFM - diet containing 60% sugarcane and 40% concentrate based on sunflower meal.
Table 4. Initial and final weight, average daily gain, feed efficiency, feed conversion and protein efficiency ratio of crossbred Holstein/Zebu heifers fed diets based on sugarcane and different protein sources, growing in feedlot.
Diets1
Parameters
SBM CSM PM SFM P CV (%)
IW2 229.83 227.17 224.50 224.50 0.326 17.76
FW3 289.00 a 280.00 b 279.77 b 277.33 b 0.018 8.35
ADG4
0.95 a 0.87 ab 0.86 ab 0.82 b 0.039 15.46
FE5 0.13 0.12 0.11 0.11 0.068 10.41
FC6
7.63 8.57 9.06 9.39 0.062 12.46
PER7 0.98 0.93 0.86 0.87 0.104 9.92
Mean values followed by the same letter in the row are not significantly different by Tukey’s test (α = 5%). P = probabilities; CV = coefficient of variation. 1SBM - diet containing 60% sugarcane and 40% concentrate based on soybean meal; CSM - diet containing 60% sugarcane and 40% concentrate based on cottonseed meal; PM - diet containing 60% sugarcane and 40% concentrate based on peanut meal; SFM - diet containing 60% sugarcane and 40% concentrate based on sunflower meal. 2Initial weight in kilograms. 3Final weight in kilograms. 4Average daily gain in kg day-1. 5kg of weight gain kg-1 of DM ingested. 6kg of DM ingested kg-1 of weight gain. 7kg of weight gain kg-1
Thus, probably the experimental animals were under malnutrition conditions, and this nutritional state causes accented growth or high gains in weight when they have access to adequate feeding, characterizing what is known as compensatory gain. During this stage, the animals increase the energy utilization efficiency and reduce the maintenance requirements and alterations in the body composition, compared with animals fed unrestrictedly (FONTES et al., 2007). The extension of the period of compensatory gain will depend on the degree and duration of the restriction period and on the diet in the re-feeding period. In this sense, the adaptation period was not enough to make up for the malnutrition condition, in which the animals were found. Typically, the expected period of compensatory growth is from 60 to 90 days (NRC, 2001).
Analyzing data from the literature concerning the association between the weight gain in the pre-pubertal and production stages, Zanton and Heinrichs (2005) verified that the gain of 0.8 kg
day-1 obtained the best result for milk production at
first lactation. The authors claimed that gains above this level concentrate more quantity of fat tissue in the mammary gland, reducing the milk production at the first lactation and also at the subsequent ones. Nevertheless, it must be considered that in other studies, no negative effect from feeding was observed in the pre-pubertal period and during milk production (VAN AMBURGH et al., 1998; SEJRSEN et al. 2000; FORD; PARK, 2001). In this way, the weight gain obtained in this study (0.875 kg
day-1) may not cause problems in future lactations of
these heifers.
The protein sources had no influence (p > 0.05) on the feed efficiency (FE), feed conversion (FC) or protein efficiency ratio (PER) of the animals (Table
4). The average PER of 0.91 kg of weight gain kg-1 of
CP ingested obtained in all the protein sources was superior to those observed by Miranda et al. (1999),
of 0.80 kg of weight gain kg-1 of CP ingested, in diets
containing sugarcane and concentrates, at a roughage:concentrate ratio of 80:20 and cottonseed meal or urea as protein source. The difference in the mean values of PER observed are related to the roughage:concentrate ratio (60:40) utilized in each experiment.
Considering the P values for the variables FE
and FC, we can verify values of around 0.06, which demonstrates a trend of the results obtained with the animals fed diets containing soybean meal to be superior to those obtained with animals fed other protein sources.
The results of FC, FE and PER, associated with the results of ADG, demonstrated that the protein sources can be used in the formulation of concentrates associated with diets that utilize sugarcane as roughage, since they allow adequate productive performance for growing dairy heifers. Besides that, the results of weight gain and final weight indicated that the soybean meal presented the best result compared with the other protein sources. However, the other sources can be considered possible substitutes of soybean meal.
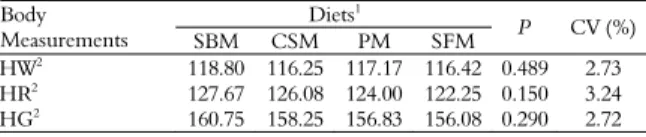
The mean height at the withers (HW), height at the rump (HR) and heart girth (HG) were 117.16 cm, 125.00 cm and 157.98 cm, respectively (Table 5). Body weight must be assessed along with linear measures (HW and HR) and measures of muscle growth (HG) so that reliable results are obtained for animal size, the feeding strategy adopted and physiological maturity (ROCHA et al., 2003). Furthermore, production systems that involve the weaning and growth phases need to take into account the adult size of females when the final goal is the maximization of the economic return of the activity.
Table 5. Height at the withers (HW), height at the rump (HR) and heart girth (HG) of crossbred Holstein/Zebu heifers fed diets based on sugarcane and different protein sources, growing in feedlot.
Diets1
Body
Measurements SBM CSM PM SFM P CV (%) HW2
118.80 116.25 117.17 116.42 0.489 2.73 HR2 127.67 126.08 124.00 122.25 0.150 3.24
HG2 160.75 158.25 156.83 156.08 0.290 2.72 Mean values followed by the same letter in the row are not significantly different by Tukey’s test (α = 5%). 1SBM - diet containing 60% sugarcane and 40% concentrate based on soybean meal; CSM - diet containing 60% sugarcane and 40% concentrate based on cottonseed meal; PM - diet containing 60% sugarcane and 40% concentrate based on peanut meal; SFM - diet containing 60% sugarcane and 40% concentrate based on sunflower meal. 2in cm.
The descriptive statistics and Pearson’s correlations between the body measurements and body weight of the animals evaluated are listed in Table 6. The mean values of observed weights and weights estimated by regression equations and from different authors are presented in Table 7.
Table 6. Descriptive statistics and Pearson’s correlations of body weight (BW) and body measurements of crossbred Holstein x Zebu heifers, fed diets based on sugarcane and different protein sources, growing in feedlot.
Correlations Variables Mean Standard
Deviation BW (kg) HG (cm) HW (cm) HR (cm) BW, kg 247.32 40.85 1.00 0.93* 0.77* 0.73*
HG, cm 149.69 8.95 1.00 0.67* 0.68*
HW, cm 115.11 4.73 1.00 0.88*
HR, cm 122.40 5.72 1.00
Table 7. Observed weight (OW) and weights estimated by the equations of Heinrichs et al. (1992) and Reis et al. (2008).
Estimated Weights1
Variable OW EWR1 EWR2 EWH1 EWH2 P CV
Body Weight (kg) 246.82 258.35 255.44 269.23* 285.25* > 0.001 14.49 *Different from control by Dunnett’s test at 5% probability; P = probabilities; CV = Coefficient of variation. 1EWR1; EWR2; EWH1 and EWH2 were obtained by equations R1 (BW = 1717 – 35.167HG + 0.23897HG² - 0.0004626HG³) and R2 (BW = 7581 – 4.151HG – 180.201HR + 0.024932HG² + 1.456103HR² - 0.00383079HR³); H1 (BW = 102.71 – 2.876HG + 0.02655HG²); H2 (BW = 632.13 16.837RW + 0.11989RW²), respectively.
HG was the body measurement with the highest degree of association (0.93) with body weight (p < 0.01). These results corroborate recent studies that have demonstrated that the greater the HG of the animal, the heavier it is, and this measurement can be employed as an indicator of body weight (MENEZES et al., 2008; REIS et al., 2008).
The measures HW and HR also presented high correlations, 0.77 and 0.73 respectively, with body weight (p < 0.01). Thus, we can infer that these height measurements have a direct association with the growth of animals, and consequently, with body weight.
The variables HW and HR also presented high correlation (0.88) (p < 0.01), and this pointed out that there is no need to perform these two measurements to evaluate the body weight of heifers.
The weight value observed was 246.82 kg and the weight values estimated by equations EWR1; EWR2; EWH1 and EWH2 were 258.35; 255.44; 269.23 and 285.25 kg, respectively. Statistical differences between the estimated weights and the observed weight were observed only for equations EWH1 and EWH2 (p < 0.05); probably attributed to the utilization of Holstein heifers rather than crossbred animals at the elaboration of the equations proposed by Heinrichs et al. (1992).
The weights estimated by equations EWR1 and EWR2, proposed by Reis et al. (2008), had no statistical difference from the weight observed; this because the authors elaborated the equations based on a representative sample of 469 crossbred heifers, especially Holstein/Gyr. Meanwhile, according to Rocha et al. (2003), in crossbred animals there is no standardization of weight and size, unlike what occurs with purebreds, which have a standard for size and height of the breed.
Moreover, in equation EWR2 there are two variables at the estimation of BW (HG and HR). Therefore, values closer to the observed weight were verified, because when height measurements are used to estimate the body weight, one considers the
size of the animal. These results corroborate Menezes et al. (2008), who indicated the height at the rump as the most convenient method for describing the skeletal size of bovine, since this measurement is more precise than height at the withers, because of the animal position, which must be appropriate.
Our results evidenced that the correlations of measurements and body development of heifers with different blood degrees are different and that the equations proposed for the prediction of body weight must be differentiated.
Conclusion
Soybean, cottonseed and peanut meals are superior to sunflower meal in the productive performance of crossbred Holstein x Zebu heifers fed diets based on sugarcane and different protein sources. The intake of ether extract and neutral detergent fiber differs among different protein sources due to the concentration of these nutrients in the studied concentrates.
The heart girth is the measure with the greatest degree of association with the live weight of the animals, and equations to predict the body weight based on the heart girth are more accurate in relation to equations based on other linear measurements.
References
AOAC-Association of Official Analytical Chemists.
Official methods of analysis. 15th ed. Arlington: Kenneth Helrich, 1990.
CYRILLO, J. N. S. G.; RAZOOK, A. G.; FIGUEIREDO, L. A.; BONILHA NETO, L. M.; MERCADANTE, M. E. Z.; TONHATI, H. Estimativas de tendências e parâmetros genéticos do peso padronizado aos 378 dias de idade, medidas corporais e perímetro escrotal de machos Nelore de Sertãozinho, SP. Revista Brasileira de Zootecnia, v. 30, n. 1, p. 56-65, 2001.
FONTES, C. A. A.; GUIMARÃES, R. F. M.; ALMEIDA, M. I. V.; CAMPOS, O. F.; ALMEIDA, F. Q.; SANT’ANA, N. F. Avaliação do ganho compensatório em novilhos mestiços Holandês-Gir: consumo e desempenho. Revista Brasileira de Zootecnia, v. 36, n. 3, p. 698-708, 2007.
FORD, J. A.; PARK, C. S. Nutritionally directed compensatory growth enhances heifer development and lactation potential. Journal of Dairy Science, v. 84, n. 7, p. 1669-1678, 2001.
HEINRICHS, A. J.; ROGERS, G. W.; COOPER, J. B. Predicting body weight and wither height in Holstein heifers using body measurements. Journal of Dairy Science, v. 75, n. 12, p. 3576-3581, 1992.
HOFFMAN, P. C.; ESSER, N. M.; BAUMAN, L. M.; DENZINE, S. L.; ENGSTROM, M.; CHESTER-JONES, H. Short Communication: effect of dietary protein on growth and nitrogen balance of holstein heifers. Journal of Dairy Science, v. 84, n. 4, p. 843-847, 2001.
LANNA, D. P. D.; BARIONI, L. G.; TEDESCHI, L. O.
RLM 3.1: ração de lucro máximo. Versão 3.1. Piracicaba: Escola Superior de Agricultura Luiz de Queiroz, 2009. (CD-ROM).
MENEZES, L. F. G.; RESTLE, J.; KUSS, F.; BRONDANI, I. L.; ALVES FILHO, D. C.; CATELLAM, J.; OSMARI, M. P. Medidas corporais de novilhos das gerações avançadas do cruzamento rotativo entre as raças Charolês e Nelore, terminados em confinamento.
Ciência Rural, v. 38, n. 3, p. 771-777, 2008.
MIRANDA, L. F.; QUEIROZ, A. C.; VALADARES FILHO, S. C.; CECON, P. R.; PEREIRA, E. S.; PAULINO, M. F.; CAMPOS, J. M. S.; MIRANDA, J. R. Desempenho e desenvolvimento ponderal de novilhas leiteiras alimentadas com dietas à base de cana-de-açúcar.
Revista Brasileira de Zootecnia, v. 28, n. 3, p. 605-613, 1999.
MOTA, D. A.; OLIVEIRA, M. D. S.; DOMINGUES, F. N.; MANZI, G. M.; FERREIRA, D. S.; SANTOS, J. Hidrólise da cana-de-açúcar com cal virgem ou cal hidratada. Revista Brasileira de Zootecnia, v. 39, n. 6, p. 1186-11903, 2010.
NRC-National Research Council. Nutrient
requirements of dairy cattle. 7th ed. Washington, D.C.: National Academic Press, 2001.
QUEIROZ, M. F. S.; BERCHIELLI, T. T.; SIGNORETTI, R. D.; RIBEIRO, A. F.; MORAIS, J. A. S. Metabolism and ruminal parameters of Holstein × Gir heifers fed sugarcane and increasing levels of crude protein. Revista Brasileira de Zootecnia, v. 41, n. 9, p. 2101-2109, 2012.
REIS, G. L.; ALBUQUERQUE, F. H. M. A. R.; VALENTE, B. D.; MARTINS, G. A.; TEODORO, R. L.; FERREIRA, M. B. D.; MONTEIRO, J. B. N.; SILVA, M. A.; MADALENA, F. E. Predição do peso vivo a partir de medidas corporais em animais mestiços Holandês/Gir,.
Ciência Rural, v. 38, n. 3, p. 778-783, 2008.
ROCHA, E. D.; ANDRADE, V. J.; EUCLIDES FILHO, K.; NOGUEIRA, E.; FIGUEIREDO, G. R. Tamanho de vacas Nelores adultas e seus efeitos no sistema de produção de gado de corte. Arquivo Brasileiro de Medicina Veterinária e Zootecnia, v. 55, n. 4, p. 474-479, 2003.
SAS Institute. Statistical analysis system user’s guide.
Version 8.04. Cary: SAS, 2003.
SENGER, C.; KOZLOSKI, G. V.; SANCHEZ, L. M. B.; MESQUITA, F. R.; ALVES, T. P.; CASTAGNINO, D. S. Evaluation of autoclave procedures for fiber analysis in forage and concentrate feedstuffs. Animal Feed Science and Technology, v. 146, n. 1-2, p. 169-174, 2008. SEJRSEN, K.; PURUP, S.; VESTERGAARD, M. High body weight gain and reduced bovine mammary growth: Physiological basis and implications for milk yield potential. Domestic Animal Endocrinology, v. 19, n. 2, p. 93-104, 2000.
SILVA, D. J.; QUEIROZ, A. C. Análises de alimentos: métodos químicos e biológicos. 3. ed. Viçosa: UFV, 2002. SNIFFEN, C. J.; O'CONNOR, J. D.; VAN SOEST, P. J.; FOX, D. G.; RUSSELL, J. B. A net carbohydrate and protein system for evaluating cattle diets: II. Carbohydrate and protein availability. Journal of Animal Science, v. 70, n. 12, p. 3562-3577, 1992.
VAN AMBURGH, M. E.; GALTON, D. M.; BAUMAN, D. E.; EVERETT, R. W.; FOX, D. G.; CHASE, L. E.; ERB, H. N. Effects of three prepubertal body growth rates on performance of Holstein heifers during first lactation. Journal of Dairy Science, v. 81, n. 2, p. 527-538, 1998.
VAN SOEST, P. J.; ROBERTSON, J. B.; LEWIS, B. A. Methods for dietary fiber, neutral detergent fiber, and nonstarch polysaccharides in relation to animal nutrition.
Journal of Dairy Science, v. 74, n. 10, p. 3583-3597, 1991.
ZANTON, G. I.; HEINRICHS, A. J. Meta-analysis to assess effect of prepubertal average daily gain of Holstein heifers on first-lactation production. Journal of Dairy Science, v. 88, n. 11, p. 3860-3867, 2005.
Received on October 3, 2012. Accepted on December 14, 2012.