Original Article ISSN 1678-4375 (Online)
Impact of replacing fish meal by a mixture of different plant
protein sources on the growth performance in Nile Tilapia
(
Oreochromis niloticus
L.) diets
A. Al-Thobaiti
a, K. Al-Ghanim
a, Z. Ahmed
a, E. M. Suliman
aand S. Mahboob
a,b*
aDepartment of Zoology, College of Science, King Saud University, P.O. Box 2455, Riyadh 11455, Saudi Arabia bDepartment of Zoology, Government College University, Allama Iqbal Road, Faisalabad, 38000, Pakistan
*e-mail: [email protected]
Received: November 20, 2016 – Accepted: April 18, 2017 – Distributed: October 31, 2018
(With 3 figures)
Abstract
The present study aimed to assess the appropriate level of replacement of fish meal (FM) with alternative plant sources
in the feed fed to Oreochromis niloticus to evaluate the growth performance. Three isoproteinious (40% crude protein)
diets were prepared from different ingredients viz., fish meal, corn gluten meal, wheat gluten meal, and bagasse kenna
meal. O. niloticus showed a maximum increase in weight as 9.70, 11.09, 8.53 and 8.32 g during the 2nd, 2nd, 3rd and 2nd
fortnight with feeding treatment A, B, C and D, respectively. The growth performance of the fish in terms of weight gain, specific growth rate, feed conversion ratio and protein efficiency ratio were found to be significantly (P < 0.05) higher in the fish fed with 20% replacement of fishmeal in diet B. The worst growth performance was observed in fish fed with commercial diet, designated as diet D. It was concluded that the fish meal can be replaced up to 20 percent with other plant protein sources without any negative impact on fish health. The replacement of fish meal with local plant sources (corn gluten meal, wheat gluten meal, soybean meal and bagasse kenna mix) will not only be beneficial to achieve better growth performance in O. niloticus, it will be a value addition as well.
Keywords: feed, plant sources, growth, length-weight, economic evaluation.
Impacto da substituição de farinha de peixe por uma mistura de diferentes
fontes de proteínas vegetais sobre o desempenho de crescimento nas dietas de
Tilápia do Nilo (
Oreochromis niloticus L.)
Resumo
O presente estudo teve como objetivo avaliar o nível adequado de substituição de farinha de peixe (FM) com fontes
alternativas de plantas na alimentação alimentada a Oreochromis niloticus para avaliar o desempenho do crescimento.
Três dietas isoproteiniosas (proteína de 40% de proteína bruta) foram preparadas a partir de diferentes ingredientes,
como farinha de peixe, farinha de glúten de milho, farinha de glúten de trigo e farinha de bagaço de bagaço. O. niloticus
apresentou um aumento máximo de peso como 9,70, 11,09, 8,53 e 8,32 g durante a 2ª, 2ª, 3ª e 2ª quinzena com o
tratamento de alimentação A, B, C e D, respectivamente. O desempenho de crescimento do peixe em termos de ganho de
peso, taxa de crescimento específico, razão de conversão alimentar e relação de eficiência protéica foi significativamente maior (P <0,05) nos peixes alimentados com 20% de reposição de farinha de peixe na dieta B. O pior O desempenho
do crescimento foi observado em peixes alimentados com dieta comercial, designados como dieta D. Concluiu-se que
a farinha de peixe pode ser substituída até 20 por cento com outras fontes de proteína vegetal sem qualquer impacto
negativo na saúde dos peixes. A substituição da farinha de peixe por fontes locais de plantas (farelo de milho, farinha
de glúten de trigo, farelo de soja e mistura de bagaço de bagaço) não só será benéfica para obter melhor desempenho
de crescimento em O. niloticus, também será uma adição de valor.
Palavras-chave:feed, fontes de plantas, crescimento, comprimento do peso, avaliação econômica.
1. Introduction
The intensification of tilapia in Saudi Arabia has made it necessary for the fish culturists to develop balanced and cost effective diet for use in the aquaculture industry. Traditionally, fish meal is the major constituents of feed
formulations available in the Kingdom. Fish meal is the
fisheries scientists to replace it with other alternative sources. A limited supply of fish meal from all available resources is unable to meet an increasing demand of fish feed industry and growers (Tacon and Metian, 2009; Kaushik and Troell, 2010; Radhakrishnan et al., 2016). Therefore, protein from plant sources seems to be the most
appropriate alternative for fish meal (FM) for preparation of tilapia diet. Alternatives to FM can include fishery
by-products, terrestrial animal by-products and plant protein sources. Fish production is expected to increase further to meet the demand of an increasing population in
the world; this will require production of more fish feed.
The reliance on addition of the plant-protein constituents
in fish feeds has increased because of its low cost and
presence of balanced amino acids (Gatlin et al., 2007; Naylor et al., 2009; Mahboob, 2014).
Different plant sources such as oil seed meals, maize, bagasse mix are available in the country, which are produced
as byproducts from various industries. These sources
are easily available at low or no cost. Various scientists have evaluated an efficiency and use of these sources as a partial or complete replacement of FM in fish diets
(El-Saidy and Gaber, 2002; Soltan et al., 2008; Ibrahem and Ibrahim, 2014; Mahboob, 2014). Individually, these plant meals are observed to have essential amino acids, but missing one or more essential amino acids (NRC, 1993).
In intensive fish culture, nothing is more important than
sound nutrition and balanced feed. Nile tilapia is naturally adapted to eating plant ingredients (Keenleyside, 1991).
Different scientists have reported the replacement of FM in
tilapia diets such as cassava leaf meal (Ng and Wee, 1989), rapeseed (Davies et al., 1990), barley and alfalfa (Belal, 1999), soybeans (Nyirenda et al., 2000; Koumi et al., 2009), ipil ipil leaf (Zamal et al., 2008). Keeping in mind the
aforementioned facts, the present study was conducted to assess the appropriate level of the replacement of fish meal with other alternative plant sources in diets fed to
Oreochromis niloticus to evaluate growth performance in
local laboratory conditions.
2. Material and Methods
2.1. Culture facility, experimental fish and growth trial
The experiment was performed in controlled conditions where 10 glass aquaria (100 L capacity) containing 70 L water were used. Tilapia fingerlings were obtained from a fish farm managed by the King Abdul Aziz City of Science and Technology (KACST), Riyadh, Saudi
Arabia. A total of 20 live male specimens of Oreochromis niloticus (mean Weight ± SE = 45.00±1.25 g, mean
total length ±SE 13.28±1.42 cm) were stocked in each aquaria in three replicates. Feeding trials were performed for 16 weeks. Water was renewed four times a week. Water temperature and dissolved oxygen were maintained at 22 °C and 7.5 mg L−1, respectively. Temperature and dissolved oxygen were monitored daily, while pH, total
alkalinity, total hardness and total nitrogen and ammonia
were measured on weekly basis following Boyd (1981). 2.2. Feed
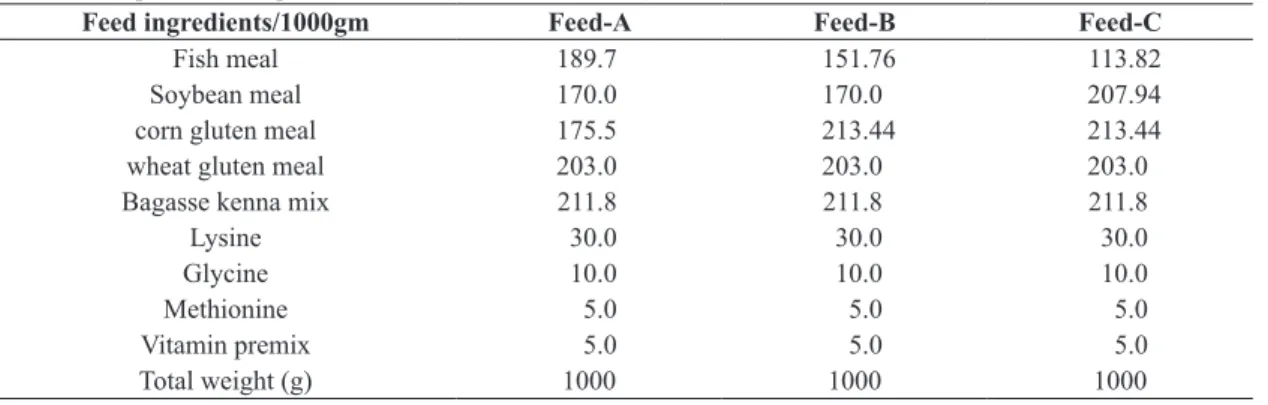
Three iso-protein (40% crude protein) feeds were prepared from different ingredients viz., fish meal, corn gluten meal, wheat gluten meal and bagasse kenna meal
(Table 1). The same feeds were already reported in another part of this experiment (Al-Ghanim et al., 2016). The control
fish were fed with a commercial tilapia feed (40% crude protein) which was purchased from Arasco, Saudi Arabia. Fingerlings were pooled in a big tank and starved for 24 h before the beginning of the feeding trials. Fish were fed at 3% body weight daily to apparent satiation twice a day at 8:00 and 15:00 for four months. Uneaten diets were
removed / siphoned out of the tanks at approximately 1 h
after feeding and then dried and re-weighted.
2.3. Growth studies
Ten fish individuals were randomly sampled fortnightly
(i.e. on every 15th day) from each aquarium using a
hand-net. The morphometric characteristics of sampled fish
individuals, viz., wet body weight; standard length and
total length were measured to the nearest 0.01gram and 0.01 mm, respectively, and used to monitor the growth
performance and thereafter released back into their
Table 1. Composition of experimental feed (Crude Protein 40%).
Feed ingredients/1000gm Feed-A Feed-B Feed-C
Fish meal 189.7 151.76 113.82
Soybean meal 170.0 170.0 207.94
corn gluten meal 175.5 213.44 213.44
wheat gluten meal 203.0 203.0 203.0
Bagasse kenna mix 211.8 211.8 211.8
Lysine 30.0 30.0 30.0
Glycine 10.0 10.0 10.0
Methionine 5.0 5.0 5.0
Vitamin premix 5.0 5.0 5.0
Total weight (g) 1000 1000 1000
respective aquaria. The growth parameters worked out
by various standard equations.
2.4. Estimation of growth and production parameters
Growth and nutrient efficiency were calculated following Guo et al. (2012) by the Equations 1-4 as mentioned below:
(
)
BWf BWiPercent Weight gain WG 100 B
( Wi
) −
= × (1)
where: BWi = Initial body weight and BWf = Final body weight.
(
)
Feed intake g( )
( )
,Weight gain g
Feed conversion ratio FCR g = (2)
( ) ( ) Biomass g
,%
Total feed inta g
( )
ke
Feed conversion efficiency FCE = (3)
(
)
Biomass g( )
( )
Protein intake g
Protein efficiency ratio PER = (4)
2.5. Specific growth rate (SGR)
Specific growth rate (SGR) was estimated according
to Dhawan and Kaur (2002); that is:
( ) ( )
( )
In Final wet body weight – In Initial wet body weight 100 Time duration days
SGR= × (5)
2.6. Condition factor and length-weight relationship
2.6.1. Condition factor
The value of the condition factor (K) was determined
by the formula:
( )
3 5W 10 Condition factor K
L ×
= (6)
where: W = Wet fish body weight (g); L = Fish total length (mm).
Number 105 is the factor bringing the ponderal index
or condition factor (K) to near unity (Carlander, 1970).
2.7. Length-weight relationship
Length-Weight relationship was calculated from length-weight data for comparison of the condition of fish to assess the effect of different diets on the fish. It was calculated as per cube law of Le Cren (1951) as follows:
W= CL3; W= Weight of fish; C = Condition factor;
L = Length of fish.
This formula was also expressed in logarithmic form as:
Log W log a n log L= + (7)
2.8. Data analysis
The results were expressed as Mean ± SD by using a Microsoft Excel sheet on Windows 2010. The differences among treatments were analyzed using a One-way Analysis of Variance (ANOVA) followed by a Duncan Multiple
Range Test for multiple comparisons of the means.
The statistical significance was set at P < 0.05, as compared to the control group by using SPSS for Windows version 16.0 (SPSS, Michigan Avenue, Chicago, IL, USA).
3. Results
In this study water temperature values and dissolved oxygen
concentrations ranged from 21.04±0.76 to 22.25±1.12 °C
and 5.38±0.19 to 5.52±0.23 mg L−1, respectively. The pH
values and ammonia concentration ranged from 7.22±0.47 to
7.75±0.22 and 0.35±0.17 to 0.58±0.14 mg L−1, respectively.
Total alkalinity, total hardness and total nitrogen ranged from 350.88±18.29 to 359.75±18.69; 42.70 to 42.80 and
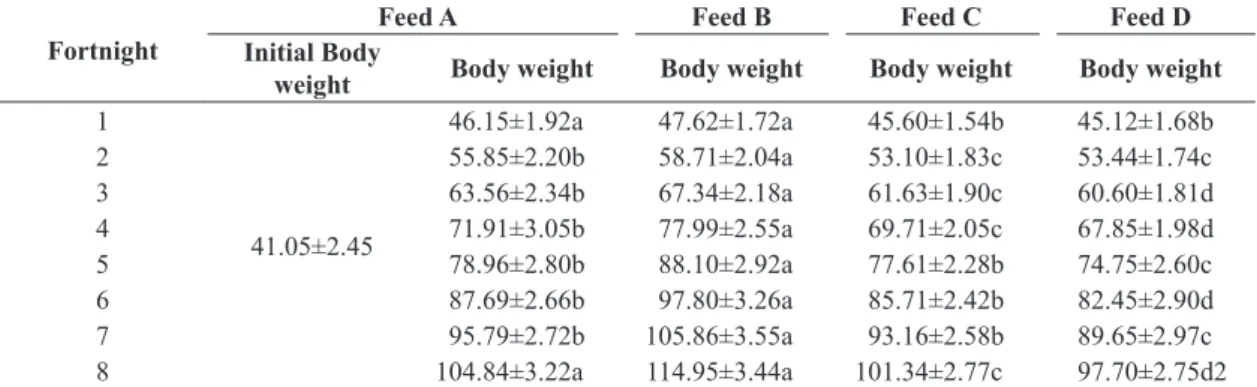
21.10± 2.12 to 22.45±1.59 mg L−1, respectively. An initial average body weight of Oreochromis niloticus was recorded as 41.05±2.45g at the beginning
of the experiment (Table 1). The final average body
weights of O. niloticus fed on feeds A, B, C and D were
104.84±3.22, 114.95±3.94, 101.34±2.77, and 97.70±2.75 g, respectively (Table 2). The increase in weight of fish was
worked out by the (Equation 1) and was noticed from the
start of the experiment till the end of the 8th fortnight under
the influence of four feeding treatments. The maximum increase in weight for O. niloticus were recorded as
Table 2. Fortnightly increase in body weight (g) of Oreochromis niloticus as influenced by different feeding regimens.
Fortnight Initial Body Feed A Feed B Feed C Feed D weight Body weight Body weight Body weight Body weight
1
41.05±2.45
46.15±1.92a 47.62±1.72a 45.60±1.54b 45.12±1.68b
2 55.85±2.20b 58.71±2.04a 53.10±1.83c 53.44±1.74c
3 63.56±2.34b 67.34±2.18a 61.63±1.90c 60.60±1.81d
4 71.91±3.05b 77.99±2.55a 69.71±2.05c 67.85±1.98d
5 78.96±2.80b 88.10±2.92a 77.61±2.28b 74.75±2.60c
6 87.69±2.66b 97.80±3.26a 85.71±2.42b 82.45±2.90d
7 95.79±2.72b 105.86±3.55a 93.16±2.58b 89.65±2.97c
8 104.84±3.22a 114.95±3.44a 101.34±2.77c 97.70±2.75d2
9.70, 11.09, 8.53 and 8.32 g in the second fortnight for
feeding treatment A, B, C and D, respectively (Figure 1). A minimum increase in weight of fish was observed in the first fortnight with all the feeding treatments (Table 2, Figure 1).
There were significant differences in growth among fish fed with the different feeds (ANOVA, F(df) = 3, p = 0.00); with Oreochromis niloticus performing best with feed B, followed by feed A, C and D (Figure 1). However,
the performance of the fish was significantly highest/ best with feed B in which 20% replacement of FM was made compared to feed A, C and D (control) (P < 0.05). The comparison of means indicates that the fish supplied with feed C (replacement of 40% FM) showed non-significant difference with commercial feed (D) (P < 0.05). The best
growth was achieved with Feed B, followed by feed A,
Feed C and Feed D (Table 2). A One-Way Analysis of
Variance (ANOVA) indicated that there were significant differences in weight increment in the fish among the four
feeding treatments (Table 2).
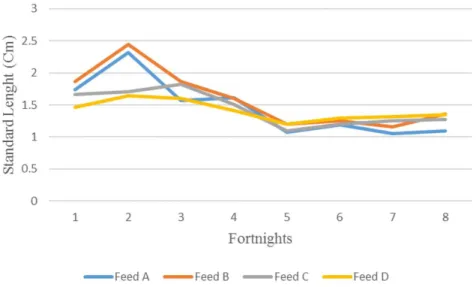
The final average standard lengths of O. niloticus
as influenced by feed A, B, C and D were recorded as
21.39 ± 1.44, 22.48 ± 1.81, 21.25 ± 1.80, 20.72 ± 1.35 cm, respectively (Table 3). The increase in length of the fish
was noticed from the start of experiment till the end of
8th fortnight. O. niloticus showed a maximum increase in
standard length as 2.32, 2.44, 1.82 and 1.64 cm in 2nd, 2nd,
3rd and 2nd fortnight with feeding treatment A, B, C and D,
respectively (Figure 2). A minimum increase in standard
Figure 1. Fortnightly increase in weight (g) of O. niloticus as influenced four different feed formulations.
Table 3. Fortnightly increase in standard and total length (cm) of Oreochromis niloticus as influenced by different feeding regimens.
Fortnight Feed A Feed B Feed C Feed D
Standard length Initiallength Fortnightlylength FortnightlyLength Fortnightlylength Fortnightlylength
1 9.74±0.48 11.48±0.95a 11.60±0.88a 11.40±0.90a 11.20±0.82a
2 13.80±1.02b 14.04±1.10b 13.11±1.21c 12.84±0.98c
3 15.37±1.08a 15.91±1.26a 14.93±1.17b 14.44±1.14b
4 16.98±1.10a 17.51±1.41a 16.43±1.35b 15.85±1.44b
5 18.05±1.21a 18.71±1.60a 17.53±1.41bb 17.05±1.52
6 19.24±1.33a 19.96±1.70a 18.73±1.51b 18.35±1.60b
7 20.29±1.18b 21.12±1.76a 19.98±1.60b 19.67±1.70c
8 21.39±1.44b 22.48±1.81a 21.25±1.80b 20.72±1.82c
Total length
1 12.53±1.15 14.33±1.55a 14.42±1.41a 14.23±1.52a 14.05±1.60a
2 16.03±1.62a 16.82±1.35a 15.94±1.60b 15.75±1.70b
3 18.04±1.71a 18.95±1.58a 17.82±1.70b 17.33±1.82b
4 19.70±1.80a 20.04±1.69a 19.28±1.74b 18.98±1.86b
5 21.29±1.69a 21.98±1.72a 21.08±1.56b 20.53±1.42b
6 23.49±1.90a 24.14±1.89a 22.86±1.88b 22.16±1.90b
7 25.04±195a 25.94±1.97a 21.49±1.90b 21.03±1.95b
8 26.87±2.01b 27.89±1.85a 23.19±1.92c 22.68±1.97d
length of fish was recoded as 1.05, 1.16, 1.10 and 1.20 cm with feeding treatment A, B, C and D during the 7th, 7th,
5th and 5th fortnight, respectively (Table 3, Figure 2).
Figure 2 indicates that the O. niloticus performed better
with feed B, closely followed by feed A, C and D (ANOVA, F(df) = 3, p = 0.05). The best growth in terms of an increase in standard length was observed with Feed B, followed by Feed A, Feed C and Feed D (Table 3).
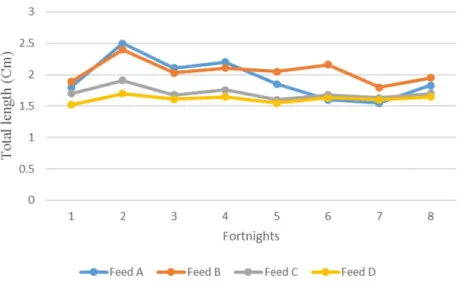
An initial average total length of Oreochromis niloticus
was recorded as 12.53±1.15 cm at the time of the start of
the experiment (Table 3). The final average total length of O. niloticus was recorded as 26.87±2.01, 27.89±1.85, 23.19±1.92, 22.68±1.97 cm, respectively against the feed A, B, C and D (Table 3). O. niloticus showed a maximum increase in total length as 2.40, 2.50, 1.91 and 1.70 cm in 2nd fortnight with feeding treatment A, B, C and D,
respectively (Figure 3). The minimum increase in total length
was recorded as 1.55, 1.80, 1.60 and 1.55 cm with feeding
treatment A, B, C and D during 7th, 7th, 7th and 1st fortnight,
respectively (Table 2, Figure 3). The best growth in terms
of final total length was observed with Feed B, followed by Feed A, Feed C and Feed D (ANOVA, F(df) = 3, p = 0.00).
Nutritional indices such as food conversion ratio (FCR), food conversion efficiency (FCE), protein efficiency ratio (PER) and specific growth rate (SGR) were also worked (Equations 2-5) out after the treatment of experimental
diets (Tables 4-8). Fish fed on diet C and D showed
similar growth pattern than those fed on the other diets, especially for the FCR which ranged from 2.22 to 3.68. The FCR values ranged from 2.06-3.35 in fish fed with
diet A, 1.95-2.98, 2.16-3.60 for O. niloticus fed with diets B and C respectively (Table 3). FCE ranged from 2.43-2.70,
2.41-2.74, 2.33-2.58 and 2.40-2.63 in fish fed with diets
A, B, C and D, respectively (Table 4). PER was found to range
from 0.95-2.45 for fish fed on diet A, while it ranged from
1.01-2.60 for diet B, and 0.65-1.98 and 0.80-1.80 for diets
C and D, respectively (Table 5). However, the differences
in FCE among fish fed on the diets A and B and C and D were non-significant (P ≥ 0.05, Table 4). The best feed
conversion ratio, feed efficiency ratio and protein efficiency ratio were observed during the 2nd fortnight in fish fed with
diet B closely followed by diets A, C and D (Table 3-5).
In terms of the feed conversion ratio (FCR) and protein efficiency ratio (PER), fish fed with diet B gave the best performance followed by fish fed with diet A, B and D. Specific growth rate (SGR) followed the similar trend in this
experiment (Table 6). SGR was manifested as 0.50-1.03, 0.55-1.20, 0.53-0.97 and 0.57-0.89 in O. niloticus fed with diet A, B, C and D, respectively (Table 6). The highest
SGR for diets A, B, C and D, respectively, were found to be
1.03, 1.20, 0.97 and 0.89, recorded during the 1st fortnight.
On the other hand, the lowest SGR value was recorded
during the 8th fortnight (Table 6). Diet C and D were not
significantly different from each other (P >0.05, Table 6).
Fish fed with diet B (i.e., 20% replacement of FM) had lower FCR than fish fed with other diets. The fish fed with diet B had significantly P higher final weights, SGR and PER compared to other diets (P ≥ 0.05).
Length-weight relationship is of great importance in fisheries. This relationship has often been studied biologically. Length is considered as an independent variable while weight as a dependent one. Length-weight relationship and condition factor were worked out by using Equations 6 and 7. The regression equations for length-weight relationships
of O. niloticus are presented in Table 8. The high values of “r” for regression equations for feed A, B, C and D indicated reasonable precision of these equations for this
fish. The differences remained statistically significant (p≤0.05) at fortnight levels, indicating that fish deviated
from the general trend of its length-weight relationship with age and season (Table 8).
Figure 3. Fortnightly increase in total length (cm) of O. niloticus as influenced four different feed formulations.
Table 4. Fortnightly Food conversion ratio (FCR) and food conversion efficiency (FCE) in O. niloticus as influenced by four experimental diets.
Fortnight Feed A Feed B Feed C Feed D
Feed Conversion ratio (FCR)
1 2.06±0.22c 1.96±0.18d 2.16±0.33b 2.22±0.20a
2 2.28±0.28c 2.03±0.23d 2.36±0.36b 2.56±0.24a
3 2.49±0.24b 2.14±0.31d 2.44±0.26c 2.69±0.30a
4 2.60±0.30b 2.21±0.36d 2.55±0.19c 2.89±0.34a
5 2.72±0.33b 2.32±0.37d 2.64±0.28c 3.12±0.42a
6 2.85±0.34b 2.40±0.42d 2.77±0.39c 3.32±0.42a
7 3.08±0.37c 2.60±0.28d 3.16±0.42b 3.54±0.41a
8 3.35±0.42c 2.98±0.42d 3.60±0.37b 3.68±0.47a
Average 2.68 2.33 2.71 3.002
Feed conversion efficiency (FCE)
1 2.50±0.32ca 2.60±0.33a 2.48±0.33c 2.55±0.28b
2 2.70±0.35a 2.74±0.34a 2.58±0.35b 2.63±0.35c
3 2.60±00.7a 2.66±0.29a 2.55±0.42b 2.54±0.37b
4 2.50±0.28b 2.58±0.40a 2.51±0.37b 2.49±0.38b
5 2.48±0.26b 2.50±0.42a 2.47±0.38b 2.46±0.37b
6 2.47±0.28a 2.45±0.37a 2.40±0.35b 2.44±0.40a
7 2.44±0.40a 2.42±0.36a 2.36±0.39b 2.42±0.39a
8 2.430.44a 2.41±0.40a 2.33±0.37c 2.40±0.38b
Means with different letters for each fish in a column are highly significantly different (P<0.05).
Table 5. Fortnightly Protein efficiency ratio (PER) in O. niloticus as influenced by four experimental diets.
Fortnight Feed A Feed B Feed C Feed D
1 0.95±0.01b 1.01±0.04a 0.65±0.02d 0.80±0.04c
2 0.99±0.02b 1.10±0.03a 0.74±0.04c 0.96±0.06b
3 1.31±0.04a 1.25±0.06b 0.82±0.03d 1.02±0.08c
4 1.48±0.08b 1.60±0.08a 0.91±0.05d 1.10±0.05c
5 1.56±0.07b 1.73±0.10a 1.10±0.07c 1.16±0.07c
6 1.62±0.11b 1.88±0.11a 1.33±0.10c 1.27±0.09c
7 1.99±0.09b 2.15±0.12a 1.60±0.13c 1.52±0.14d
8 2.45±0.12b 2.60±0.15a 1.98±0.15c 1.80±0.17d
Table 6. Fortnightly Specific growth rate (SGR) in O. niloticus as influenced by four experimental diets.
Fortnight Feed A Feed B Feed C Feed D
1 0.98±0.01b 1.05±0.05a 0.80±0.06c 0.82±0.04c
2 1.03±0.03b 1.20±0.07a 0.97±0.04c 0.89±0.02d
3 0.89±0.02b 1.09±0.09a 0.92±0.07b 0.84±0.02c
4 0.83±0.04c 0.93±0.06a 0.87±0.05b 0.80±0.04c
5 0.74±0.01b 0.86±.0.07a 0.78±0.03b 0.71±0.05c
6 0.67±0.03c 0.77±0.04a 0.70±0.02b 0.63±0.06d
7 0.54±0.01d 0.64±0.02b 0.61±0.04b 0.60±0.02c
8 0.50±0.01b 0.55±0.01a 0.53±0.02a 0.57±0.03a
Means with different letters for each fish in a row are highly significantly different (P<0.05).
Table 7. Length-weight relationship for O. niloticus as influenced by four experimental diets.
Feeding Group Regression equation r
Feed A log W= -3.92+2.628 log T.L(0.242) 0.964
Feed B log W= -4.28+3.123 log T. L(0.168) 0.984
Feed C log W= -4.02+2.564 log T. L(0.212) 0.945
Feed D log W= -3.82+2.590 log T. L(2.78) 0.942
Values within brackets are standard errors.
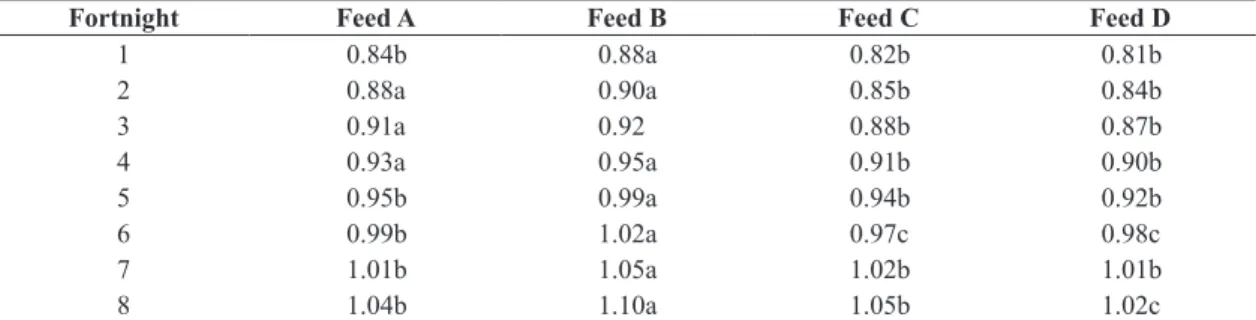
Table 8. Fortnightly comparison of means for Condition Factor (Kn) in O. niloticus as influenced by four experimental diets.
Fortnight Feed A Feed B Feed C Feed D
1 0.84b 0.88a 0.82b 0.81b
2 0.88a 0.90a 0.85b 0.84b
3 0.91a 0.92 0.88b 0.87b
4 0.93a 0.95a 0.91b 0.90b
5 0.95b 0.99a 0.94b 0.92b
6 0.99b 1.02a 0.97c 0.98c
7 1.01b 1.05a 1.02b 1.01b
8 1.04b 1.10a 1.05b 1.02c
Means with different letters for each fish in a row are highly significantly different (P<0.05).
4. Discussion
Fishes are poikilothermic organisms. The food
requirement of fish is related to their activity and good environmental conditions, particularly water temperature,
pH, alkalinity, hardness, total nitrogen, and ammonia (Mahboob, 2014). In tilapia culture reliance is gradually
increasing on the use of different alternative sources of
protein in the feed formulation in order to reduce feed
production costs. Various scientist recommended different cost effective protein sources for the prepration of feed to achieve optimum growth of fish (Tacon and Metian, 2009; Kaushik and Troell, 2010; Radhakrishnan et al., 2016). In this study, O. niloticus was fed with a custom-made feed
with a replacement of 10%, 20% and 40% of fish meal with alternative plant sources of protein. Commercial fish
farming depends upon a balanced feed prepared from quality feed ingredients (Zamal et al., 2008; Koumi et al., 2009;
Vechklang et al., 2011). This study used feed constituents, from indigenous sources, which were selected based on their nutritional quality and cost effectiveness. Fish meal was replaced with corn gluten meal, wheat gluten meal and bagasse kenna meal maize gluten in order to produce fish at low cost. Various studies suggest that herbivores
require comparatively less amounts of proteins compared to carnivores (e.g. Vechklang et al., 2011). O. niloticus
performed better when fed with diet B in which 20% of the FM was replaced with protein from corn gluten meal, wheat gluten meal, bagasse kenna meal and maize gluten.
O. niloticus, like many other fish species, have their own dietary protein requirements for optimal growth
(Twibell and Brown, 1998; Bahnasawy, 2009). The quality
of the feed may also have an impact on the growth of this fish (Jatta, 2013). Fish growth is normally high when good
such as plant protein, are used (Furuya et al., 2004).
Our results show that fishmeal substitution with plant protein sources of up to 20% significantly improved the growth of the fish. Our findings were in line with the
results of Zhou and Yue (2010) and Mahboob (2014) who
reported that fish meal could be successfully substituted with other ingredients in feeds prepared for O. niloticus. Contrary to our results, Furuya et al. (2004) found that
fishmeal could be totally replaced with plant protein sources without any adverse effect on the growth of tilapia. However, a 50 to 100% replacement of FM with plant protein (soya protein) can decrease the growth rate of O. niloticus (Koumi et al., 2009). Davies et al. (1990), reported up to
15% replacement of fish meal with rapeseed meal. A best SGR was recorded in tilapia fed with custom-made diet B. Different workers have indicated that low FCR value means better feed utilization efficiency of artificial feeds
(Zamal et al., 2008). Few workers argued that probably
high energy feeds produce the lowest FCR and highest
nutrient retention (Coyle et al., 2004; Zamal et al., 2008).
Likewise, PER may be used as an indicator of protein
retention of the conversion ratio. FCR and PER both are related to dietary protein intake and its conversion into
fish weight gain (Koumi et al., 2009). In this experiment,
there were noticed significant effects on FCR, FEC, PER
and SGR among the three experimental diets and the
commercial diet which were fed to O. niloticus. Baggase
kenna mix, wheat gluten meal and corn gluten are very
cheap in the local markets of Saudi Arabia. A similar
finding was also reported in the total replacement of FM by Chlorella vulgaris which significantly improved the growth and energy utilization of M. rosenbergii (Radhakrishnan et al., 2016). FCR increased with an increase
in fish weight (also see Al-Hafedh, 1999; Siddiqui et al., 1988).
The feed conversion ratio and condition factor showed a reverse trend, which indicates that the given feed was well utilized by O. niloticus. Analysis of variance was performed on condition factor of fish and means were compared which exhibited non-significant differences among the four diets.
The high values of “r” for regression equations for feed A, B, C and D indicated reasonable precision of these
equations for this fish. In this experiment, O. niloticus
exhibited positive allometric growth under the influence of feeding regimens. These findings are comparable with the previous studies reported by different researchers
(Ibrahim et al., 2008; Imam et al., 2010; Mahboob, 2014). The condition factors for O. niloticus was worked out less than 1 except 7th and the 8th fortnight. The Kn values ranged
between 0.81-1.10 as influenced by the feed A, B, C and D. The K values reported in brackish water for T. zillii by Ibrahim et al. (2008) were 1.94 while Mossad (1990) records ranged from 2.63 to 3.4. The high K values reported
by these workers were not in line with the results of this study and may be attributed to a difference in ecological
conditions. The Kn value obtained for O. niloticus in this
study was greater than one or around one which suggests that the fish was in good condition.
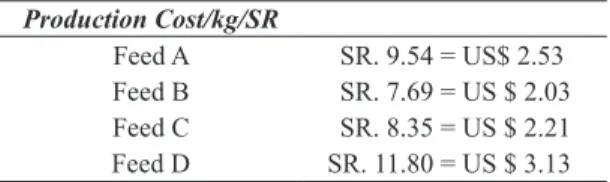
4.1. Economical evaluation
Table 2 and 3 exhibited that the replacement
effect of FM with bagasse kenna mix, corn and wheat gluten meal of up to 40% in tilapia diets did not have a significant effect on the growth performance and feed utilization and reduced the feed costs/kg diet. The costs of feed / kg for custom-made feed A, B, C were worked
out as 3.56, 3.30 and 3.08 Saudi Riyals and commercial
diet D marketed by Arasco was 6.93 Saudi Riyals (SR)
(see Table 8). The cost of production to gain in weight of
one kg of tilapia was determined to be 9.54, 7.69, 8.35 and 11.80 SR/kg (US $ 2.53, 2.03, 2.21 and 3.13, respectively).
An economic evaluation exhibited that diet B gave the
lowest production cost at SR 7.69/kg (US $ 2.03) followed
by diet C, A and diet D (see Table 9).
5. Conclusion
In this study, the best growth and feed utilization performances were achieved by O. niloticus fed on a feed
prepared by replacing 20% of fish meal diet with plant sources (maize gluten meal, wheat gluen mean and bagasse kenna meal), while the lowest performances were recorded with a group of fish fed with commercial feed (i.e. diet D). It has been concluded that a fish meal can be replaced up to 20% without any negative impact on fish growth rate. The replacement of fish meal with local plant sources (low protein fish meal plus corn gluten meal, wheat gluten meal, soybean meal and bagasse kenna mix) will not be only beneficial to achieve better growth performance in
O. niloticus but also cut down production costs, thereby increasing the net profit.
Acknowledgements
The authors would like to express their sincere appreciation to the Deanship of Scientific Research at King Saud University for its funding of this research through Prolific
Research Group No. 1436-011.
References
AL-GHANIM, A.K., AHMED, A.T., HUMOUD, H.F.A., AHMED, Z. and MAHBOOB, S., 2016. Effects of replacement of fishmeal with other alternative plant sources in the feed on proximate composition of muscle, liver and ovary in tilapia (Oreochromis
Table 9. Production cost (SR/ US $) for one kg weight gain of O. niloticus as influenced by four experimental diets.
Production Cost/kg/SR
Feed A SR. 9.54 = US$ 2.53
Feed B SR. 7.69 = US $ 2.03
Feed C SR. 8.35 = US $ 2.21
nioloticus). Brazilian Archives of Biology and Technology. http:// dx.doi.org/10.1590/1678-4324-2016160376.
AL-HAFEDH, Y., 1999. Effects of dietary protein on growth and body composition of Nile tilapia, Oreochromis niloticus L. Aquaculture Research, vol. 30, no. 5, pp. 385-393. http://dx.doi. org/10.1046/j.1365-2109.1999.00343.x.
BAHNASAWY, M., 2009. Effect of dietary protein levels on growth performance and body composition of mono-sex Nile Tilapia, Oreochromis niloticus L. reared in fertilized tanks. Pakistan Journal of Nutrition, vol. 8, pp. 674-678. http://dx.doi. org/10.3923/pjn.2009.674.678.
BELAL, I.E.H., 1999. Replacing dietary corn with barley seeds in Nile tilapia Oreochromis niloticus (L.) feed. Aquaculture Research, vol. 30, no. 4, pp. 265-269. http://dx.doi.org/10.1046/j.1365-2109.1999.00323.x.
BOYD, E.C., 1981. Water quality in warm water fish ponds. 2. ed. Opelika: Craft Master Printers.
CARLANDER, D., 1970. Handbook of freshwater fishery biology. Iowa: The Iowa State University Press, vol. 1.
COYLE, S.D., MENGEL, G.J., TIDWELL, J.H. and WEBSTER, C.D., 2004. Evaluation of growth, feed utilization, and economics of hybrid tilapia, Oreochromis niloticus x Oreochromis aureus, fed diets containing different protein sources in combination with distillers dried grains with soluble. Aquaculture Research, vol. 25, no. 4, pp. 365-370. http://dx.doi.org/10.1111/j.1365-2109.2004.01023.x.
DAVIES, S., MC CONNELL, S. and BATESON, R.I., 1990. Potential of rapeseed meal as an alternave protein source in complete diets for tilapia (Oreochromis mossambicus Prters). Aquaculture, vol. 87, no. 2, pp. 145-154. http://dx.doi.org/10.1016/0044-8486(90)90271-N.
DHAWAN, A. and KAUR, S., 2002. Pig dung as pond manure: effect on water quality, pond productivity and growth of carps in polyculture system. The ICLARM Quarterly, vol. 25, no. 1, pp. 11-14.
EL-SAIDY, D.M.S. and GABER, M.M.A., 2002. Complete replacement of fish meal by soybean meal with dietary l-lysine supplement for Nile tilapia Oreochromis niloticus, fingerlings. World Aquaculture Society, vol. 33, no. 3, pp. 297-306. http:// dx.doi.org/10.1111/j.1749-7345.2002.tb00506.x.
FURUYA, W., BOTARO, D., NEVES, P.R., SILVA, C.R. and HAYASHI, C., 2004. Lysine requirement of Nile tilapia, (Oreochromis niloticus), for grow-out phase. Ciência Rural, vol. 34, no. 5, pp. 1571-1577. http://dx.doi.org/10.1590/S0103-84782004000500038.
GATLIN, D.M., BARROWS, F.T., BROWN, P., DABROWSKI, K., GAYLORD, T.G., HARDY, R.W., HERMAN, E., HU, G., KROGDAHL, Å., NELSON, R., OVERTURF, K., RUST, M., SEALEY, W., SKONBERG, D., J SOUZA, E., STONE, D., WILSON, R. and WURTELE, E., 2007. Expanding the utilization of sustainable plant products in aqua feeds: a review. Aquaculture Research, vol. 3, no. 6, pp. 551-579. http://dx.doi. org/10.1111/j.1365-2109.2007.01704.x.
GUO, Z., ZHU, X., LIU, J., HAN, D., YANG, Y., LAN, Z. and XIE, S., 2012. Effects of dietary protein level on growth performance, nitrogen and energy budget of juvenile hybrid sturgeon, Acipenser baerii ♀×A. gueldenstaedtii ♂. Aquaculture, vol. 338-341, pp. 89-95. http://dx.doi.org/10.1016/j.aquaculture.2012.01.008.
IBRAHEM, M.D. and IBRAHIM, M.A., 2014. The potential effects of Spirulina platensis (Arthrospira platensis) on tissue protection of Nile tilapia (Oreochromis niloticus) through estimation of P53 level. Journal of Advanced Research, vol. 5, no. 1, pp. 133-136. PMid:25685480. http://dx.doi.org/10.1016/j.jare.2013.03.009. IBRAHIM, S. M., SHALLOOF, K. A. Sh. and SALAMA, H. M., 2008. Effect of environmental conditions of Abu-Zabal lake on some biological, histological and quality aspects of fish, Cairo. Global Veterinaria, vol. 2, pp. 257-270.
IMAM, T.S., BALA, U., BALARABE, M.L. and OVEYI, T.I., 2010. Length-weight relationship and condition factor of four fish species from Wasai Reservoir in Kano, Nigeria. African Studies, vol. 6, pp. 125-130.
JATTA, S., 2013. The effects of substituting fishmeal with rapeseed meal at three protein levels on growth and body composition of Nile tilapia fingerlings (Oreochromis niloticus). Tokyo: Fisheries Training Program, United Nations University. 33 p.
KAUSHIK, S. and TROELL, M., 2010. Taking the in fish-out ratio a step further. Aquaculture Europe, vol. 35, pp. 15-17. KEENLEYSIDE, M.H.A., 1991. Cichlid fishes: behaviour, ecology and evolution. New York: Chapman & Hall. 378 p.
KOUMI, A.R., ATSE, B.C. and KOUAME, L.P., 2009. Utilization of soya protein as an alternative protein source in Oreochromis niloticus diet: Growth performance, feed utilization, proximate composition and organoleptic characteristics. African Journal of Biotechnology, vol. 8, no. 1, pp. 91-097.
LE CREN, E.D., 1951. The length- weight relationship and seasonal cycle in gonad weight and condition in the perch (Perca fluviatilis).Journal of Animal Ecology, vol. 20, no. 2, pp. 201-219. http://dx.doi.org/10.2307/1540.
MAHBOOB, S., 2014. Replacing fish meal with a blend of alternative plant proteins and its effect on the growth performance of Catla catla and Hypophthalmichthys molitrix. Pakistan Journal of Zoology, vol. 46, pp. 747-752.
MOSSAD, M.N.M., 1990. Biological studies on five fish species from Lake Qarun, Egypt Length–weight relationship and condition factor. Journal of Zoological Society, vol. 21, pp. 331-344. NATIONAL RESEARCH COUNCIL – NRC, 1993. Nutrient requirement of fishes. Washington: National Academy of Sciences. NAYLOR, R.L., HARDY, R.W., BUREAU, D.P., CHIU, A., ELLIOT, M., FARRELL, A.P., FORSTER, I., GATLIN, D.M., GOLDBURG, R., HUA, K. and NICHOLS, P.D., 2009. Feeding aquaculture in an era of finite resources. Proceedings of the National Academy of Sciences of the United States of America, vol. 106, no. 36, pp. 15103-15110. PMid:19805247. http://dx.doi. org/10.1073/pnas.0905235106.
NG, W.K. and WEE, K.L., 1989. The nutritive value of cassava leaf meal in pelleted feed for Nile tilapia. Aquaculture, vol. 83, no. 1-2, pp. 45-58. http://dx.doi.org/10.1016/0044-8486(89)90059-8. NYIRENDA, J., MWABUMBA, M., KAUNDA, E. and SALES, J., 2000. Effect of substituting animal protein sources with soybean meal in diets of Oreochromis karongae (Trewavas, 1941). Naga. The ICLARM Quarterly, vol. 23, no. 4, pp. 13-15.
prawn, Macrobrachium rosenbergii.Aquaculture Research, vol. 3, pp. 35-44.
SIDDIQUI, A., HOWLADER, M.S. and ADAM, A.A., 1988. Effects of dietary protein levels on growth, diet conversion protein utilization in fry and young Nile tilapia, Oreochromis niloticus.Aquaculture (Amsterdam, Netherlands), vol. 70, no. 1-2, pp. 63-70. http://dx.doi.org/10.1016/0044-8486(88)90007-5. SOLTAN, M., HANAFY, M.A. and WAFA, M.I., 2008. Effect of replacing fish meal by a mixture of different plant protein sources in Nile Tilapia (Oreochromis niloticus L.) diets. Global Veterinaria, vol. 2, pp. 157-164.
TACON, A.G.J. and METIAN, M., 2009. Fishing for feed or fishing for food: increasing global competition for small pelagic forage fish. Ambio, vol. 38, no. 6, pp. 294-302. PMid:19860152. http://dx.doi.org/10.1579/08-A-574.1.
TWIBELL, R. and BROWN, P.B., 1998. Optimal dietary protein concentration for hybrid tilapia Oreochromis niloticus X O-aureus
fed all-plant diets. Journal of the World Aquaculture Society, vol. 29, no. 1, pp. 9-16. http://dx.doi.org/10.1111/j.1749-7345.1998. tb00294.x.
VECHKLANG, K., BOONANUNTANASARN, S., PONCHUNCHOOVONG, S., PIRARAT, N. and WANAPU, C.., 2011. The potential for rice wine residual as an alternative protein source in a practical diet for Nile Tilapia (Oreochromis niloticus) at the juvenile stage. Aquaculture Nutrition, vol. 17, no. 6, pp. 685-694. http://dx.doi.org/10.1111/j.1365-2095.2011.00870.x.
ZAMAL, H., BARUA, P., UDDIN, B. and ISLAM, K.S., 2008. Application of ipil-ipil leaf meal as feed Ingredient for monosex tilapia fry (Oreochromis niloticus) in terms of growth and economics Aquaculture. The Asia Magazine, no. 5, pp. 31-33.