Printed version ISSN 0001-3765 / Online version ISSN 1678-2690 http://dx.doi.org/10.1590/0001-3765201620150608
www.scielo.br/aabc
Recognition memory and DNA damage in undernourished young rats
PATRÍCIA MOLZ1,2,3
, JOEL H. ELLWANGER4,5
, FERNANDA F. ZENKNER4,5
, DEIVIS DE CAMPOS4,6
, DANIEL PRÁ1,2,4
, MARISA T.L. PUTZKE4
and SILVIA I.R. FRANKE1,2
1
Programa de Pós-Graduação em Promoção da Saúde, Universidade de Santa Cruz do Sul/UNISC, Av. Independência, 2293, Sala 4206, Universitário, 96815-900 Santa Cruz do Sul, RS, Brasil
2
Laboratório de Nutrição Experimental, Universidade de Santa Cruz do Sul/UNISC, Av. Independência, 2293, Sala 3031, Universitário, 96815-900 Santa Cruz do Sul, RS, Brasil 3
Programa de Pós-Graduação em Medicina e Ciências da Saúde, Pontifícia Universidade Católica do Rio Grande do Sul/PUCRS, Av. Ipiranga, 6681, Partenon, 90619-900 Porto Alegre, RS, Brasil
4
Departamento de Biologia e Farmácia, Universidade de Santa Cruz do Sul/UNISC, Av. Independência, 2293, Sala 3529, Universitário, 96815-900 Santa Cruz do Sul, RS, Brasil 5
Programa de Pós-Graduação em Genética e Biologia Molecular, Universidade Federal do Rio Grande do Sul/UFRGS, Av. Bento Gonçalves, 9500, Prédio 43323M, 91501-970 Porto Alegre, RS, Brasil 6
Departamento de Ciências Básicas da Saúde, Universidade Federal de Ciências da Saúde de Porto Alegre/UFCSPA, Rua Sarmento Leite, 245, 90050-170 Porto Alegre, RS, Brasil
Manuscript received on August 26, 2015; accepted for publication on March 1, 2016
ABSTRACT
This study evaluated the recognition memory and the levels of DNA damage (blood and hippocampus) in undernourished young Wistar rats. The experiment was conducted along 14-week with rodents divided in control group (CG, n=8) and undernourished group (UG, n=12) which was submitted to caloric restriction. Nutritional status for undernutrition was defined by Body Mass Index (BMI) ≤0.45g/cm2
and by weighting the organs/tissue (liver, spleen, intestine, peritoneal fat, kidney and encephalon). The Novel Object Recognition Test assessed recognition memory and the Comet Assay evaluated the levels of DNA damage. Student t test, 2-way ANOVA and Pearson’s correlation analysis were used and the significance level was of p<0.05. The UG showed lower BMI and organ/tissue weights than CG (p<0.001). In short-term memory, the recognition rate was higher in the UG (p<0.05), only after 4 weeks. In the long-term memory, again recognition rate was higher in the UG than the CG, after 4 weeks (p<0.001) and 14 weeks (p<0.01). The UG showed decreased levels of DNA damage in the blood (p<0.01) and increased levels in the hippocampus (p<0.01). We concluded in this study that the undernutrition by caloric restriction did not cause impairment in recognition memory, however induced DNA damage in the hippocampus.
Key words: DNA damage, memory, nutritional status, undernutrition, Wistar rats.
Correspondence to: Silvia Isabel Rech Franke E-mail: [email protected]
INTRODUCTION
In the human population, undernutrition affects all nations and its occurrence is extremely high in African and Asian countries (Müller and Krawinkel
2005). The Food and Agriculture Organization of
the United Nations (FAO 2014) has declared that
868 million people in the world experience hunger,
which results in undernutrition. This condition is
also known as undernourishment (Shetty 2006) and
is characterized by a decrease in the metabolic rate due to a lack of nutrients that are important to life (Molz et al. 2014), resulting from reduced nutrient intake (Schilp et al. 2011).
Nutritional deficiency may affect several es -sential metabolic processes and can interfere with genome stability (Mendoza-Núñez et al. 2005). There is evidence indicating that the reduction in the basal metabolic rate, which would be caused by the decreased rate of cellular oxygen consump-tion (Masoro 2000), mitigates DNA damage aris-ing from oxidative stress (Celik et al. 2012). In animals, a significant increase in DNA damage has been reported to be associated with the under-nourished state (Cortés et al. 2001). However, the mechanisms involved in the relationship between undernutrition, CR and cell damage are not fully understood, particularly in cells of the central ner-vous system, such as hippocampal cells.
There is also evidence that undernutrition produces behavioral changes. Modifications of functionality in nervous system cells due to nutrient deficiency promote changes in the processes involved in learning and memory (Valadares et al. 2010). However, this fact is not fully proven because there are studies that indicate improvement in spatial memory in undernourished rodents (Smart et al. 1976).
Moreover, there is a lack of studies evaluating the relationship between undernutrition, recognition
memory and DNA damage. Therefore, in this study we evaluated the recognition memory and the level of DNA damage (blood and hippocampus) in undernourished Wistar rats.
MATERIALS AND METHODS
ETHICAL ASPECTS AND ANIMALS
The procedures adopted in this study followed the guidelines for the care and use of animals according to the Brazilian regulations for animal studies (Law No. 11794/1999) and were approved by the Animal Ethics Committee of the University of Santa Cruz do Sul (Protocol 05/2011).
We used 20 male Wistar rats (21 days of age), weighting 54.2±10.00 g from the Central Laboratory of Animals of Federal University of Santa Maria (RS, Brazil). The rats were kept in individual cages, under a twelve-hour light/dark cycle, at 22±3ºC and 60% of humidity.
ExPERIMENTAL DESIGN AND DIET
The rats were acclimatized for 9 days, receiving water ad libitum and normoprotein-caloric Pres-ence Nestlé® chow (nutritional composition
pre-sented in Table I) in sufficient quantity to keep the
animals in the eutrophic state. After, the animals were randomly assigned into 2 treatment groups and kept for 14 weeks, as 1 - control group (n = 8): no experimental intervention (receiving 0.40
TABLE I
Nutritional composition of Presence Nestlé® chow.
Macronutrients and fibers
Carbohydrates (g) Proteins (g) Lipids (g) Fibers (g)
7.40 23.00 4.00 5.00
Vitamins
B12 (µg) A (UI) D (UI) K (mg)
4.00 25.50 154.00 6.40
Minerals
Ca (mg) Fe (mg) Zn (mg) Cu (µg) Se (µg)
12.50 18.00 11.00 3.00 0.02
g of chow/gram of bodyweight per day and water ad libitum) and 2 - undernourished group (n = 12): CR (0.06-0.08 g of chow/gram of bodyweight per
day, equal to 15-20% of the chow received by the
control group) and water ad libitum. The undernu-trition state was induced by food deprivation (re-ceiving 75-80% less chow than the control group) based on the study by Madi and Campos (1975). At
the end of the experiment the rats were sacrificed by decapitation, using a guillotine specific for ro -dents.
MEASUREMENTS OF CHOW AND WATER INTAKE
Chow daily intake was measured by the difference
between the initial amount of chow supplied and the amount at the end of the period, every 24 hour. The leftovers were not reused. Analytical scales (Marte®, Brazil, with a minimum precision of 0.02 g and maximum load of 500.00 g) were used to
weight the chow. Water was offered ad libitum to all the experimental groups and its consumption was assessed biweekly using a 100.00 mL beaker (Satelit®, Brazil).
BODY MASS INDEx (BMI) FOR RATS AND WEIGHTING OF
ORGANS/TISSUE
The BMI-specific for rats was obtained and interpreted according to Novelli et al. (2007):
undernutrition state was classified when the BMI
was lower than 0.45 g/cm2 and to eutrophic state was considerate BMI between 0.45 and 0.68 g/ cm2. We used the BMI because anthropometrics is
a simpler and efficient method to assess nutritional
status in either animals (Novelli et al. 2007, Molz et al. 2014) or humans (WHO 1995, De Onis and Habicht 1996, Hedley et al. 2004).
Analytical scales (Toledo®, Brazil, with a minimum precision of 25.00 g and maximum load of 35.00 kg) was used to weight the animals and an anthropometric tape (Carci®, Brazil) was used
to measure the body length (nose-anus length).
After sacrifice, the following organs/tissues were
dissected and weighted: liver, spleen, intestine, peritoneal fat, kidney and encephalon. An analytical scale (Marte®, Brazil) was used to weight the organs/tissues.
RECOGNITION MEMORY ASSESSMENT
Recognition memory was assessed using the Object Recognition Test conducted according to Bevins and Besheer (2006) and De Lima et al. (2007). Animals were trained in novel object recognition on two occasions: time 1 (after 4 weeks of undernourishment) and time 2 (at the end of the experiment, after 14 weeks of undernourishment) to compare the recognition memory between the control and the undernourished groups. On the
first occasion (habituation session), the rats were
given one a 5-min training trial in which they were exposed to two identical objects (A1 and A2) in
the training arena (an open field (45 × 40 × 60 cm)
made of Medium-Density Fiberboard). Before the training period, the rats underwent a trial test of the short-term memory (90 min after the habituation session), during which the rats were allowed to
explore the open field for 5 min in the presence of
two objects: the familiar object A (familiar) and a novel object B (unfamiliar). These were placed in the same locations as during the training session. The next day, 24 hours of after the training session, the animals were allowed to explore two objects for 5 min: object B (familiar) and a third novel object, object C (unfamiliar). For the purposes of the test, all objects had similar textures, colors, and sizes, but distinctive shapes. The test premise is that the rats should spend more time exploring the new (unfamiliar) object than the familiar object. Object exploration was measured using two stopwatches to record the time spent exploring the objects during the experimental sessions and exploration
was defined as: sniffing or touching the object with
the nose. A “recognition index” was calculated
as expressed by equation TB/(TA+TB), being:
COLLECTION AND PREPARATION OF SAMPLES: BLOOD
AND HIPPOCAMPUS CELLS
Blood samples for the Comet Assay were collected in the morning and on four occasions: time 0 (at the beginning of the treatment), time 1 (after 4 weeks of treatment), time 2 (after 9 weeks of treatment) and time 3 (at the end of treatment, after 14 weeks). The peripheral blood samples were collected from animals’ tails, except at the end of treatment (blood collected from jugular vein). To prepare the Comet
Assay slides, in each collection, 15.00 μL of blood were mixed with 4.00 μL of heparin.
For cell suspensions of hippocampus samples, the encephalon was removed immediately after
sacrifice and sectioned at the junction between the bulb and spinal cord. Subsequently, the encephalon
was transferred to a Petri dish on ice to extract the hippocampus. The hippocampus was identified with the coordinates described by Paxinos and Watson (2005), using a rat brain slicer matrix to
differentiate the areas of the encephalon (Bonther®,
Brazil). The slices obtained were dissected with the aid of a 14 Gauge needle to remove the hippocampal tissue and stored in microtubes
containing phosphate buffered saline (PBS) with
10% dimethyl sulfoxide (DMSO), where the tissue
was dissociated and 60.00 μL were intended for
the Comet Assay. In order to prevent DNA damage induced by ultraviolet radiation, all procedures were performed under dim yellow light.
THE COMET ASSAY
The Comet Assay of blood and hippocampus cells was performed according to Tice et al. (2000) and Franke et al. (2006). Slides pre-coated with agarose were used. Five microliters of blood were
added to 95.00 μL of low melting point agarose (LMP) (0.75%) or 20.00 μL of hippocampal cell suspension was added to 80.00 μL of LMP.
The mixture composed of agarose and cells was dropped onto the slides and then coverslips
were placed over the agarose/cells. After the
mixture solidified, the coverslips were removed and
the slides were immersed in a freshly lysis solution containing high salt and detergent concentrations during 1-2 days under refrigeration, order to lyse the cells, removing the nuclear membrane and the cytoplasmic contents. Composition of the lysis solution: 2.50 M NaCl, 100.00 mM EDTA, 10.00 mM Tris, pH 10.20, with freshly added 1%
Triton X-100 and 10% DMSO. Subsequently, the microscope slides were placed in a pH buffer
alkaline solution for DNA unwinding and to express the alkali-labile sites as single strand breaks. Composition of the alkaline solution: 300.00 mM NaOH, 1.00 mM EDTA, pH > 13. Then the slides were immediately submitted to electrophoresis to induce the migration of DNA fragments. After,
the slides were washed with neutralization buffer (0.40M Tris, pH 7.5), fixed and silver-stained.
For each rat/tissue, 2 slides were prepared and 100 cells were randomly selected and analyzed (50 per slide, 2 slides per rat) under an optical microscope
(200X magnification). The DNA migration damage
was classified into five classes, from class 0 (no DNA migration) to class 4 (maximal DNA migration) taking into consideration the tail size and intensity. The damage index (DI) was obtained from the sum of the individual nucleoids analyzed, ranging from 0 (no DNA damage: 100 x 0 cells) to 400 (maximum DNA damage: 100 x 4 cells).
The damage frequency (DF), in percentage terms
(%), was calculated by the ratio of the number of damaged cells among the 100 cells observed during the analysis. Nucleoids with non-detectable nuclei (head and tail clearly separated) were not evaluated (Da Silva et al. 2000).
STATISTICAL ANALYSIS
and homoscedasticity. 2-way ANOVA followed by Sidak´s multiple comparison test was used. The Student ttest and Pearson’s correlation analysis
was also used. The significance level was set at
p<0.05.
RESULTS
In the study, the overall mortality was 15% (3 ani-mals). The undernourished group had 25% mortal-ity and no deaths occurred in control group. The undernourished animals and control group gained, respectively, 152.11±5.57 and 397.31±19.97 g of bodyweight during the treatment (14 weeks),
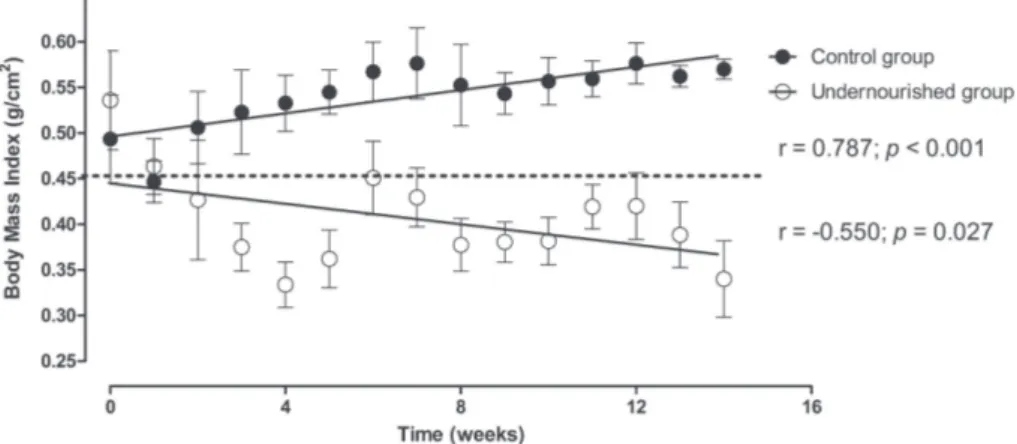
indicating that the undernourished gained only 38% of bodyweight in relation to the controls (p<0.001). The caloric intake of the undernour-ished group was about 23% of that of the control group (1794.10±32.01 versus 8037.17±89.05 Kcal; p<0.001). From the second week of treatment, the animals became undernourished and remained in this nutritional state until the end of the experiment. The results of the Pearson’s correlation test indi-cated the BMI increased over time in the control group (r=0.787; p<0.001) and reduced over time in the undernourished group (r=-0.550; p<0.05) (Fig-ure 1).
Figure 1 - Evolution of Body Mass Index (BMI) of control and undernourished groups. r:
correlation coefficient and p: significance level; according to the Pearson’s test. The dashed line
indicates the cutoff for classification of undernourishment in the rat BMI, according to Novelli
et al. (2007).
The comparison of the organ weight and peritoneal fat weight between the undernourished and control rats is presented in Table II. Substantial weight reduction was observed for all the organs and tissue assessed (p<0.001). The peritoneal fat weight was 34 times greater in the control group than in the undernourished animals. The encephalon was the organ that presented the lowest reduction
(although significant, at 11.50%).
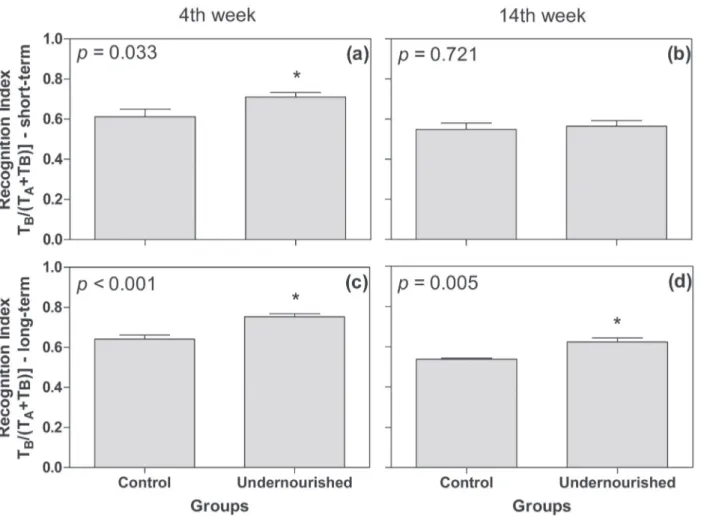
The results obtained from the Recognition Object Test demonstrated a higher recognition rate in the short-term memory for the undernourished
group compared with the control group only after the fourth week of CR (p<0.05; Figure 2a). No
statistically significant results were found in the
short-term memory for the undernourished group compared with the control group at the fourteenth week of CR (p=0.721; Figure 2b). In the long-term memory (Figure 2c, d) the undernourished group showed higher recognition rate compared to the control group both at the fourth week (p<0.001) and at the fourteenth week of CR (p<0.01).
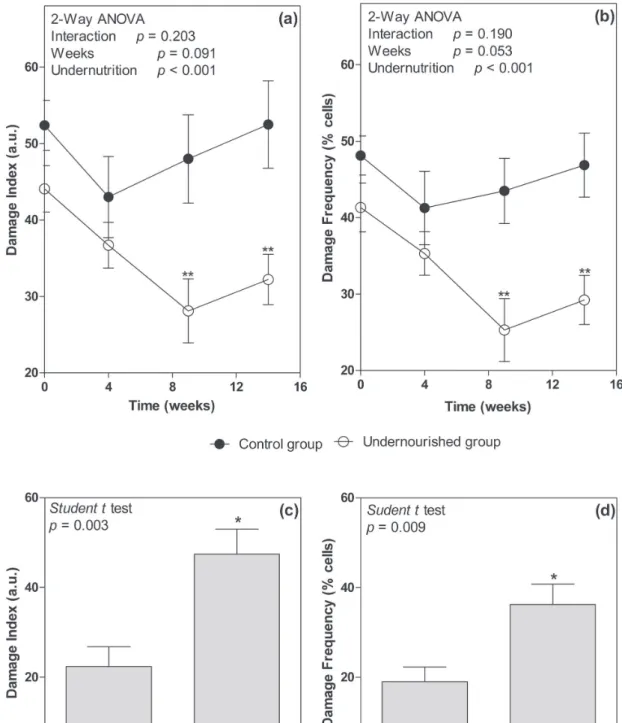
weeks (p<0.01) in the undernourished animals,
both in the damage index and the damage frequency
(Figure 3a, b). In relation to DNA damage in the hippocampus, evaluated at the fourteenth week, the
undernourished group presented higher levels of damage (2-fold higher), both in the damage index (p<0.01) and in the damage frequency (p<0.01) (Figure 3c, d).
Figure 2 - Short and long-term memory assessed using the Object Recognition Test performed at the 4th (a, c) and 14th weeks (b,
d) of caloric restriction. The data are expressed as mean and standard deviation. p: significance level according to the Student t test.
In the bars, significative diference is highlighted by “*”.
TABLE II
Weight reduction of the organs and peritoneal fat (in grams) of rats submitted to caloric restriction.
Organs/tissues
Groups
Average reduction in
organs/tissues (%) p
Control Undernourished
Weight (g)
Liver 12.22 ± 0.36 3.77 ± 0.31 69.15 <0.001
Spleen 0.62 ± 0.05 0.22 ± 0.02 64.52 <0.001
Intestine 26.64 ± 1.29 10.17 ± 0.98 61.82 <0.001
Peritoneal fat 6.16 ± 0.90 0.18 ± 0.16 97.10 <0.001
Kidney 2.14 ± 0.03 1.08 ± 0.07 50.47 <0.001
Figure 3 - Level of DNA damage index in the blood and hippocampus of rats submitted to caloric restriction for 14 weeks. The graphs (a) and (b) present the evolution of the DNA damage index in blood cells according to the damage index and damage
frequency, respectively. The filled circles represent the control group and the unfilled circles the undernourished group. The
statistical comparison was performed using the 2-way ANOVA followed bySidak´s multiple comparison test. ** Statistical
difference between groups in the same week (p<0.01). ●Control group and ○Undernourished group. The graphs (c) and (d) present
the DNA damage level in hippocampus cells at the end of treatment, represented by the damage index and frequency, respectively
DISCUSSION
In the present study the mortally rate of animals submitted to CR, by reduction of chow availability, was 25%. This mortality rate was lower than that observed in a study performed with younger animals using limited lactation (Nunes et al. 2002), in which the mortally rate was of 30%. In our study,
the CR was sufficient to cause undernourishment as defined in accordance with Madi and Campos
(1975), who used 4.00 to 6.00 g of chow/day per rat in the undernourished group. In our study we used a similar CR regime, a value between 75 at 80% of intake of the control group, corresponding to a mean of 0.07 g of chow/g of bodyweight per day (or approximately 4.00 to 5.00 g of chow/day per rat).
The bodyweight gain of the animals in CR was, on average, only 38% of that of the control group. In agreement, another study (Remmers et al. 2008) that focused on undernutrition in rats during the postnatal period until six months of age demonstrated that severe CR prejudices normal development. Dietary restriction significantly
affects the growth and differentiation of cells and
tissues (Selman et al. 2005). These data are in
accordance with our findings that showed reduced
weight of the organs in animals subjected to CR. Thinness was demonstrated by a 34-fold reduction in peritoneal fat weight. The encephalon was the organ that lost less weight in relation to the other evaluated organs.
Various regions of the encephalon are affected
by undernutrition, for example, the cerebellum and the hippocampal system (Valadares et al. 2010). We found an increase of 13% in short-term memory and of 10% in long-term memory after 4 weeks and an increase of 20% in long-term memory after 14 weeks in the undernutrition group. We believe that the increased exploration by the animals subjected to CR may be explained by their greater need to seek for food in response to food deprivation, and
it would not be advantageous for the animals to continue exploring a place they knew had no food. In the experiment performed by Valadares et al. (2010) that evaluated the recognition memory
test, there was an evident difference in recognition
between the tested groups, in which undernourished rats showed lower recognition both in the long and short duration test when compared to the control animals. However, the process of undernutrition used was protein-caloric, which may account for
the different results found in that study compared
to ours.
Although Bevins and Besheer (2006) and De Lima et al. (2007) have stated that the memory test is used to assess recognition memory, the test is recommended as a good marker to assess the exploratory behavior in relation to hunger. Eating behavior is also related to feeling hunger, exploratory behavior, learning and memory. Therefore it is possible to relate the present work with other studies that claim that undernourished rats have greater motivation to obtain food in response to deprivation (Rich et al. 2010, Myskiw
and Izquierdo 2012). This would be explained by
the ability of the body to provide the brain with energy in detriment to other organs when necessary, especially in the early stages of life, as in the case of the animals in this study. In view of this, Bass et al. (1970) stated that when nutrients are restricted, the body seeks to adapt by inducing vital organs to maintain normal or close to normal growth, in an attempt to preserve the brain.
Although the reduction of the encephalon was only 10%, this may have contributed to
cause cell changes, specifically, increased levels
of DNA damage in the hippocampus. In relation to cell damage in this encephalon region, we believe that hippocampal loss did not alter the results from the memory tests because such a loss may have been functionally compensated in other important encephalon areas involved in object
the DNA damage in hippocampal cells seen in the undernourished group cannot be fully explained. However, the clinical form of undernutrition “kwashiorkor” could lead to an imbalance between free radical production and disposal, which would be explained by a decrease in antioxidant defenses, resulting in an uncontrolled production of free radicals that would damage the DNA (Waterlow 1995).
In relation to the results of DNA damage in blood presented in Figure 3, there is a very interesting point for discussion: at time 0, the DNA damage variation in the groups possibly was random with both groups presenting high DNA damage (around 40-50% of damaged blood cells). This fact could be at least partially explained by the
stress suffered by animals during the transport to our
institution where the study was performed as well as to the process of adaptation to the new laboratory
conditions suffered by animals. Another explanation
for this variation in the DNA damage could be
related to the food intake adaptation suffered by
these animals. Initially, during the acclimatization period (9 days) the animals received food ad libitum. Then, the animals were randomly assigned into 2 treatment groups and both groups received food intake monitored to maintain the eutrophic state and the undernutrition state according to the control and undernourished group, respectively. In other words, it is very likely that the high DNA damage level could be related to stress caused by the adaptation to the new laboratory conditions
summed to the acute effect of caloric restriction
implementation, for maintaining the eutrophic state and for maintaining undernutrition state (i.e. the animals did not receive food ad libitum). The level of DNA damage was assessed at time 0 week in relation to time 4 week. In the course of the experiment, both groups adapted to the controlled
diet ad to the new environment. Consequently,
DNA damage was discernible between groups in later stages.
In their recent study, Celik et al. (2012)
found no differences in relation to DNA damage
in leukocytes between marasmic undernourished children and a group of children in the eutrophic state. However, the authors claim that CR tends to decrease DNA damage, data in agreement with the results of our study (for DNA damage in blood cells). On the other hand, in the study performed by Cortés et al. (2001) which used weaned animals in
the undernourished state, a significant increase in
DNA damage was reported, wherein the damage type found could be due to deficiency of many
essential nutrients required for the synthesis of
proteins that are related to DNA integrity, the repair mechanisms of DNA adducts, and/or due to the unavailability of molecules necessary to protect cells against oxidative damage.
In addition to the biometric parameters evalu-ated during the course of the study, it was possible to observe clinical signs that were similar to those classically related to undernutrition in “marasmus”, including: weight loss, dull eyes, hair loss, severe shaking, diarrhea, hypothermia and weak breathing (Leite et al. 2011).
Finally, the experiment presented here showed that CR in the proportion and model (rodent) that was tested caused damage at the cellular level and some behavioral changes when assessed using the Object Recognition Test and the Comet Assay. Even so, undernutrition should be discouraged in diets and combatted in situations of extreme poverty.
The positive effects found in the memory test are
not closely related to the damage found in the DNA of hippocampal cells, because, although this region
was damaged, the injury may have been offset by
other areas of the encephalon also involved with object recognition and exploration of the spatial environment. The reasons for the excessive genotoxicity in the hippocampus are not fully understood, although the mechanisms affecting the memory in undernutrition are an important
the mechanisms are established, more efficient interventions will be possible.
Our results showed that excessive caloric re-striction induced undernutrition and reproduced in the animal model their major metabolic disor-ders, such as excessive weight loss and changes in
growth and in cell/tissue differentiation, leading to
death. Undernutrition caused an improvement in recognition memory of the rats that is possibly as-sociated with their exploratory behavior in relation to starvation. However, undernutrition caused dam-age at the cellular level, reducing DNA damdam-age in blood and increasing in the hippocampus. The study results also contribute to the nutrigenomics
because the effects of a lack of nutrients on the ge -netic material were evaluated. Since these aspects are established, it will be possible to perform more
efficient interventions in the nutrigenomics field.
ACKNOWLEDGMENTS
Financial support was provided by Conselho
Na-cional de Desenvolvimento Científico e Tecnológi
-co (CNPq, Brazil) and Laboratory of Experimental
Nutrition - UNISC. We thank colleagues from the Laboratory of Histology and Pathology and Labo-ratory of Biotechnology and Genetics (UNISC) for their help with the experiments.
RESUMO
Este estudo avaliou a memória de reconhecimento e os níveis de danos no DNA (sangue e hipocampo) em ratos Wistar jovens desnutridos. O experimento foi conduzido ao longo de 14 semanas com os animais divididos em grupo controle (GC, n=8) e grupo desnutrido (GD, n=12) que foi submetido a restrição calórica. O estado nutricional para desnutrição foi definido pelo Índice de Massa Corporal (IMC) de ≤0,45g/cm2
e pela pesagem dos órgãos/tecido (fígado, baço, intestino, gordura peritoneal, rim e encéfalo). O Teste de Reconhecimento de Objeto Novo avaliou a memória de reconhecimento e o Ensaio Cometa avaliou os níveis de danos no DNA. O teste t de Student, ANOVA de duas vias e a análise
de correlação de Pearson foram usados e o nível de significância foi de p<0,05. O GD apresentou um menor IMC e menores pesos dos órgãos/tecido que o GC (p<0,001). Em relação à memória de curto prazo, a taxa de reconhecimento foi maior no GD (p<0,05), apenas após 4 semanas. Em relação à memória de longo prazo, novamente a taxa de reconhecimento foi maior no GD em comparação ao GC, depois de 4 semanas (p<0,001) e depois de 14 semanas (p<0,01). O GD apresentou diminuição dos níveis de danos no DNA no sangue (p<0,01) e aumento nos níveis de danos no DNA no hipocampo (p<0,01). Concluiu-se neste estudo que a desnutrição pela restrição calórica não causou prejuízo na memória de reconhecimento, porém induziu danos no DNA no hipocampo.
Palavras-chave: dano no DNA, memória, estado nutricio-nal, desnutrição, ratos Wistar.
REFERENCES
BASS NH, NETSKY MG AND YOUNG E. 1970. Effects of neonatal malnutrition on developing cerebrum. I. Micro-chemical and histologic study of cellular differentiation in the rat. Arch Neurol 23: 289-302.
BEVINS RA AND BESHEER J. 2006. Object recognition in
rats and mice: a one-trial non-matching-to-sample learning task to study ‘recognition memory’. Nat Protoc 1: 1306-1311.
CELIK M, SERMATOV K, ABUHANDAN M, ZEYREK D,
KOCYIGIT A AND ISCAN A.2012. Oxidative status and
DNA damage in chidren with marasmic malnutrition. J Clin Lab Anal 26: 161-166.
CORTéS E, GONZáLEZ C, BETANCOURT M AND ORTIZ R.
2001. Assessment of DNA damage in spleen, bone mar-row, and peripheral blood from malnourished rats by sin-gle cell gel electrophoresis assay. Teratog Carcinog Muta-gen 21: 231-247.
DA SILVA J, DE FREITAS TRO, MARINHO JR, SPEIT G AND
ERDTMANN B. 2000. An alkali single-cell gel
electropho-resis (comet) assay for environmental biomonitoring with native rodents. Genet Mol Biol 23: 241-245.
DE LI M A M N M, PR E S T I-TO R R E S J, CA L D A N A F,
GRAZZIOTIN MM, SCALCO FS, GUIMARAES MR,
BROMBERG E, FRANKE SIR, HENRIqUES JAP AND
SCHRöDER N.2007. Desferoxamine reverses neonatal
iron-induced recognition memory impairment in rats. Eur J Pharmacol 570: 111-114.
Fao - FOOD AND AGRICULTURE ORGANIZATION OF THE
UNITED NATIONS. 2014. The state of food and agriculture. Rome: FAO.
FRANKE SIR, PRá D, GIULIAN R, DIAS JF, YONEAMA
ML, DA SILVA J, ERDTMANN B AND HENRIqUES JAP. 2006. Influence of orange juice in the levels and in the genotoxicity of iron and copper. Food Chem Toxicol 44: 425-435.
HEDLEY AA, OGDEN CL, JOHNSON CL, CARROLL MD,
CURTIN LR AND FLEGAL KM.2004. Prevalence of
overweight and obesity among US children, adolescents, and adults, 1999-2002. JAMA 291: 2847-2850.
LEITE SN, JORDãO AA, ANDRADE TAM, MASSON DS
AND FRADE MAC. 2011. Modelos experimentais de
desnutrição e sua influência no trofismo cutâneo. An Bras
Dermatol 86: 681-688.
MADI K AND CAMPOS SD.1975. Desnutrição experimental:
resultados anátomo-patológicos e bioquímicos da
administração de dietas hipoprotéicas a ratos albinos jovens. Mem Inst Oswaldo Cruz 73: 153-181.
MASORO EJ. 2000. Caloric restriction and aging: an update.
Exp Gerontol 35: 299-305.
MENDOZA-NúñEZ VM, SáNCHEZ-RODRÍGUEZ MA,
RETANA-UGALDE R, VARGAS-GUADARRAMA LA
AND ALTAMIRANO-LOZANO MA. 2005. Undernutrition
without malnutrition as a protective factor to prevent DNA damage in the elderly. Nutr Res 25: 271-280.
MOLZ P, ELLWANGER JH, DOS SANTOS CEI, DIAS JF, DE
CAMPOS D, CORBELLINI VA, PRá D, PUTZKE MTL
AND FRANKE SIR. 2014. A metabolomics approach to
evaluate the effects of shiitake mushroom (Lentinula edodes) treatment in undernourished young rats. Nucl Instrum Methods Phys Res B 318: 194-197.
MüLLER O AND KRAWINKEL M. 2005. Malnutrition and
health in developing countries. Can Med Assoc 173: 279-286.
MYSKIW JC AND IZqUIERDO I.2012. Posterior parietal
cor-tex and long-term memory: some data from laboratory ani-mals. Front Integr Neurosci 6: 8.
NOVELLI ELB, DINIZ YS, GALHARDI CM, EBAID GMx,
RODRIGUES HG, MANI F, FERNANDES AAH, CICOGNA
AC AND NOVELLI FILHO JLVB.2007. Anthropometrical
parameters and markers of obesity in rats. Lab Anim 41: 111-119.
NUNES ML, BATISTA BB, MICHELI F AND BATISTELLA V. 2002. Effects of early malnutrition and nutritional rehabili-tation in rats. J Pediatr (Rio J) 78: 39-44.
PAxINOS G AND WATSON C.2005. The rat brain in stereotaxic coordinates. 5th
ed., San Diego: Elsevier.
RE M M E R S F, SC H R E U D E R MF, GE M K E R J B J A N D
DELEMARRE-VAN DE WAAL HA. 2008. Energy intake
and resting energy expenditure in adult male rats after early postnatal food restriction. Br J Nutr 99: 1149-1156. RICH NJ, VAN LANDINGHAM JW, FIGUEIROA S, SETH
R, CORNIOLA RS AND LEVENSON CW. 2010. Chronic
caloric restriction reduces tissue damage and improves spatial memory in a rat model of traumatic brain injury. J Neurosci Res 88: 2933-2939.
SCHILP J, WIJNHOVEN HAH, DEEG DJH AND VISSER M.
2011. Early determinants for the development of undernu-trition in an older general population: Longitudinal Aging Study Amsterdam. Br J Nutr 106: 708-717.
SE L M A N C, PH I L L I P S T, STA I B JL, DU N C A N JS,
LEEUWENBURGH C AND SPEAKMAN JR. 2005. Energy
expenditure of calorically restricted rats is higher than predicted from their altered body composition. Mech Ageing Dev 126: 783-793.
SHETTY P. 2006. Malnutrition and undernutrition. Medicine
34: 524-529.
SMART JL, TRICKLEBANK MD, ADLARD BPF AND
DOBBING J.1976. Nutritionally small-for-dates rats: their
subsequent growth, regional brain 5-hydroxytryptamine
turnover, and behavior. Pediatr Res 10: 807-811.
TICE RR, AGURELL E, ANDERSON D, BURLINSON B,
HARTMANN A, KOBAYASHI H, MIYAMAE Y, ROJAS
E, RYU JC AND SASAKI YF. 2000. Single cell gel/comet
assay: guidelines for in vitro and in vivo genetic toxicology testing. Environ Mol Mutagen 35: 206-221.
VALADARES CT, FUKUDA MTH, FRANçOLIN-SILVA AL,
HERNANDES AS AND ALMEIDA SS. 2010. Effects of
postnatal protein malnutrition on learning and memory procedures. Nutr Neurosci 13: 274-282.
WATERLOW JC. 1995. Whole-body protein turnover in
humans-past, present, and future. Annu Rev Nutr 15: 57-92.
WHO - WORLD HEALTH ORGANIZATION. 1995. Physical