Braz. Arch. Biol. Technol. v.54 n.6: pp. 1357-1366, Nov/Dec 2011
1357
Vol.54, n. 6: pp.1357-1366, November-December 2011
ISSN 1516-8913 Printed in Brazil BRAZILIAN ARCHIVES OF
BIOLOGY AND TECHNOLOGY
A N I N T E R N A T I O N A L J O U R N A L
Growth Characteristics Modeling of
Bifidobacterium bifidum
Using RSM and ANN
Ganga S. Meena, Suneel Gupta, Gautam C. Majumdar and Rintu Banerjee
*Microbial Biotechnology and Downstream Processing Laboratory; Department of Agricultural and Food Engineering; Indian Institute of Technology; Kharagpur-721 302 - India
ABSTRACT
The aim of this work was to optimize the biomass production by Bifidobacterium bifidum 255 using the response surface methodology (RSM) and artificial neural network (ANN) both coupled with GA. To develop the empirical model for the yield of probiotic bacteria, additional carbon and nitrogen content, inoculum size, age, temperature and pH were selected as the parameters. Models were developed using ¼ fractional factorial design (FFD) of the experiments with the selected parameters. The normalized percentage mean squared error obtained from the ANN and RSM models were 0.05 and 0.1%, respectively. Regression coefficient (R2) of the ANN model showed higher prediction accuracy compared to that of the RSM model. The empirical yield model (for both ANN and RSM) obtained were utilized as the objective functions to be maximized with the help of genetic algorithm. The optimal conditions for the maximal biomass yield were 37.4 °C, pH 7.09, inoculum volume 1.97 ml, inoculum age 58.58 h, carbon content 41.74% (w/v), and nitrogen content 46.23% (w/v). The work reported is a novel concept of combining the statistical modeling and evolutionary optimization for an improved yield of cell mass of B. bifidum
255.
Key words: Probiotics, response surface methodology (RSM), FFD, artificial neural network (ANN), genetic algorithms (GA)
*Author for correspondence: [email protected]
INTRODUCTION
Bifidobacterium is the most prominent member of
plethora class of bacterial species with probiotic properties. The popularity of this group of bacteria is based on the millennia of use in the food and feed that are used in the probiotic dairy drinks and yoghurts since long (Sanders, 1999). At present, in India, the production of probiotics is reported to grow annually about 22.6 % until 2015 and the market of the probiotics is ~20.6 million rupees (€320,000). The market demand indicates that it is economically viable product. The probiotics have
Bifidobacterium sp. is one of the major microorganisms in the gastrointestinal tract flora of the children and adults. These bacteria have a strong stimulatory effect for the normal development of microbiota and maturation of gut associated lymphoid tissue (Schezenmeir and De Vrese, 2001). Probiotic bacteria such as
Bifidobacterium and Lactobacillus sp. in the
gastrointestinal tract can play an important role in promoting the human health (Savage, 1977; Mitsuoka, 1990). These microorganisms can contribute to digestion, immune stimulation and inhibition of the pathogens such as Bacteroides,
Escherichia, Clostriduim and Proteus which are
potentially harmful bacteria found in the gastrointestinal tract (Ziemer and Gibson, 1998). The primary mechanism for probiotic action is known as competitive colonization or competitive suppression. It is best described as the proliferation of the probiotic bacteria in the human intestine, leaving little space for the growth of any pathogens (Ballongue, 1992; Biavati et al., 2000). To develop the growth model of probiotic bacteria through the traditional method, i.e. one variable at-a-time is time consuming and interactions of different variables can also affect the yield. Unlike the conventional optimization, the statistical optimization methods can take into account the interactions of the variables in generating the process response. Process optimization through the statistical method is a technique in which changes or adjustments are made in a process to get better results (Myers and Montgomery, 2002). There are several techniques for process optimization, i.e., Response Surface Methodology (RSM), Artificial Neural Networks (ANN), Genetic Algorithms (GA), etc. In these engineering applications, a response of interest is usually influenced by several variables and the objective of the engineering applications is to find the variables that can optimize the response. RSM is a tool on that basis we find the optimal process parameters that produce a maximum or minimum value of the response and represent the direct and interactive effects of the process parameters through two and three-dimensional plots (Gangadharan et al., 2008). Artificial neural networks are computational models of nervous systems. Natural organisms, however, do not possess only nervous systems but also genetic information stored in the nucleus of their cells (genotype). The nervous system is part of the phenotype which is derived from this genotype through the process of
development (Rajasekaran and Vijaylakshmi, 2004). Using the method of neural networks (NN), the relationship between a set of independent variables X and the dependent variables Y can be obtained. From the given pairs of input X and output Y data, neural network directly learns, and then develops a relationship between them but does not yield any mathematical equation relating the variables. After the learning, this network is able to predict the correct output from an input data set that has not been previously used during the learning. Genetic algorithms (GA) are a tool by which the optimization problems can be accurately solved within a limited use of computer time (Das, 2005). The objective of this work was to optimize and improve the yield of probiotic bacteria,
Bifidobacterium bifidum by optimizing the growth
parameters such as temperature, pH, inoculum volume, inoculum age and additional effect of different carbon and nitrogen sources with the help of Response Surface Methodology, Artificial Neural Network and Genetic Algorithms.
MATERIALS AND METHODS
Organism and growth condition
Pure culture of Bifidobacterium bifidum 255 was obtained from the National Collection of Dairy Cultures (NCDC) Karnal, Haryana (India). The culture was grown in a modified MRS media containing 1% (w/v) sodium thiosulphate at 30ºC under anaerobic condition. Biomass growth was determined by measuring the optical density (OD) at 600 nm.
Experimental design
Selection of initial parameters
For the selection of initial parameters, ‘one variable at a time method’ was used. The different variables viz. temperature, pH, volume of inoculum, age of inoculum and additional carbon and nitrogen sources were selected for growth of
B. bifidum.
Empirical model development
Growth Characteristics Modeling of Bifidobacterium bifidum
Braz. Arch. Biol. Technol. v.54 n.6: pp. 1357-1366, Nov/Dec 2011
1359
of ‘dependent variables’ obtained from each of the combinations of independent variables was measured. A mathematical relationship between the independent and dependent variables was developed. This relationship was called ‘model’. Using this model, the predicted values of responses were found out within the domain of limiting values of independent variables. For the different growth parameters, a polynomial model was developed between the growth and growth parameters to find out the following relationship between the coded values x1, x2, x3, x4, x5 and x6 of independent variables and dependent variable Yp
as shown below
Yp=bo+b1x1+b2x2+b3x3+b4x4+b5x5+b6x6+
b7x1 2
+b8x2 2
+b9x3 2
+b10x4 2
+b11x5 2
+b12x6 2
+b1
3x1x2+b14x1x3+b15x1x4+b16x1x5+b17x1x6+b18
x2x3+b19x2x4+b20x2x5+b21x2x6+b22x3x4+b23x
3x5+b24x3x6+b25x4x5+b26x4x6+b27x5x6 (Eq. 1)
Where bo, b1, b2………etc. are the regression constants.
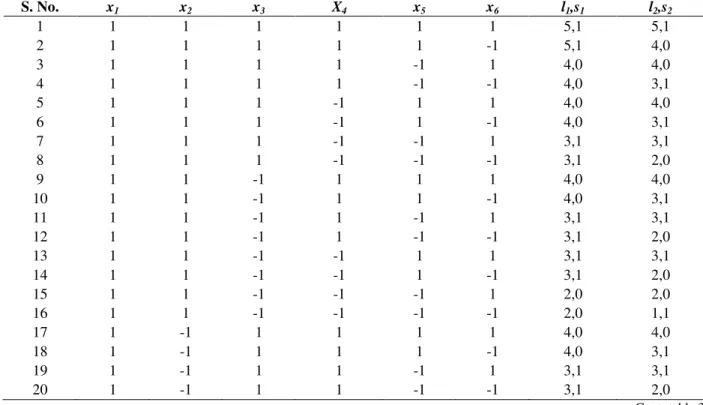
Experimental modeling Fractional factorial design
Using two levels (+1 and -1) factorial design, two values of l and s for two sacrificing interactions were l1, s1, l2 and s2. With the help of factorial design, s values were identified as (s1= 0, s2 =0), (s1= 0, s2 =1), (s1= 1, s2 =0), and (s1= 1, s2 =1). In this study, all the experiments were conducted according to s1= 0 and s2 =0 design.
Optimization
Neural Network modeling
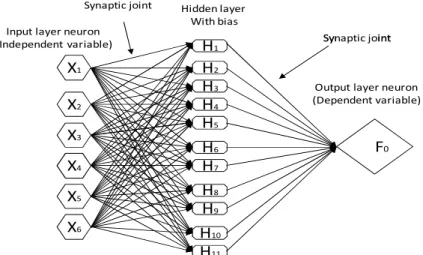
ANN chosen was a radial basis function network with supervised learning. The model was based on feed forward back propagation training method. In this process, the network computed the error between the desired output (predicted) and the actual (experimental) output. It trained the network to make adjustments to minimize the error and back propagate the same.
F0 H1 H11 H10 H9 H8 H7 H6 H5 H4 H3 H2 X1 X6 X5 X4 X3 X2 X4
Input layer neuron (Independent variable)
Output layer neuron (Dependent variable) Hidden layer With bias Synaptic joint Synaptic joint Synaptic joint
Figure 1- Basic structure of a feed forward back propagation neural network.
Genetic Algorithms
In this optimization study, GA was applied to the developed ANN based model as shown in the Fig 2. The prime objective of this study was to maximize the biomass yield of gap B. bifidum by monitoring the growth parameters such as temperature, pH, inoculum volume, inoculum age, carbon % and nitrogen %. It was posed as the minimization of problem associated with the optimization studies. Genetic optimization continued till the termination condition i.e. maximum biomass yield was obtained.
Software used
For proper execution of ANN and GA, MATLAB 7.0 was used to develop the empirical model.
RESULTS AND DISCUSSION
Selection of initial parameters
Selection
Crossover Randomly initialize
Gen = 0
Calculate fitness of each variable
Mutation Gen = Gen + 1
Termination criteria satisfaction
Start
Stop
Figure 2 - Flow chart of simple genetic algorithms.
Growth Characteristics Modeling of Bifidobacterium bifidum
Braz. Arch. Biol. Technol. v.54 n.6: pp. 1357-1366, Nov/Dec 2011
1361
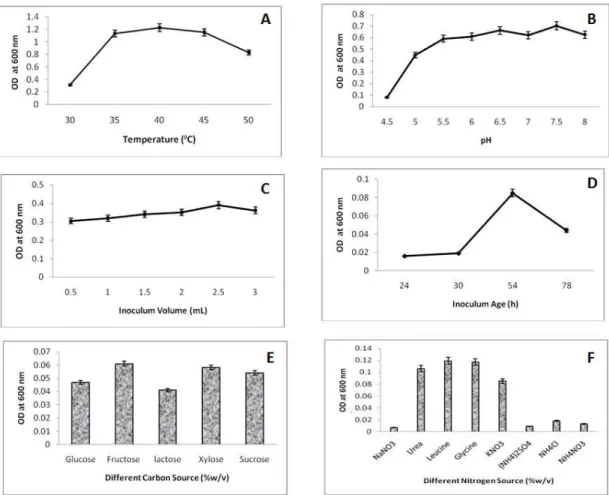
Table 1 - Values of different parameters for single parameter optimization. Different growth
parameters
Variation of parameters Maximum growth on parameter
Temperature, (°C) 30, 35, 37, 40, 45 37
pH 4.0, 4.5, 5.0, 5.5, 6.0, 6.5, 7.0 ,7.5, 8.0, 7.5
Inoculum volume, (ml) 0.5, 1.0, 1.5, 2.0, 2.5, 3.0 2.5
Inoculum age, (h) 24, 30, 54, 78 54
Carbon sources, (% w/v) Glucose, Fructose, Sucrose Lactose, Xylose Fructose Nitrogen sources, (%w/v) Sodium nitrate, Urea, Leucine, Glycine, Potassium
nitrate, Ammonium sulphate, Ammonium chloride, Ammonium nitrate
Leucine
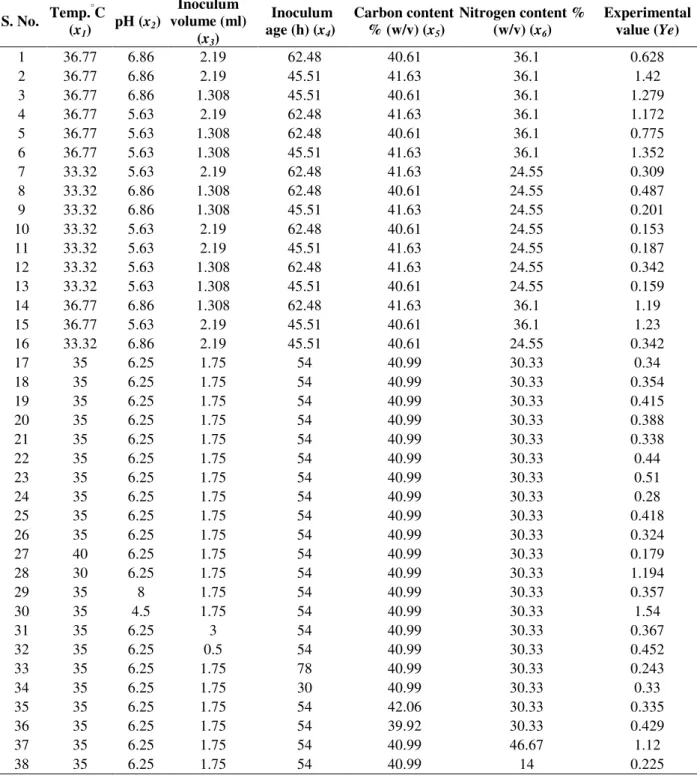
Empirical model development
From the above results, the maximum and minimum values of six independent parameters for
B. bifidum were fixed as shown in Table 2. For
developing the model between coded values x1, x2,
x3, x4, x5, x6 of independent variables and dependent variable Yp, the experiments were
conducted according to the fractional factorial design. All these combinations have been given in Table 3 with their corresponding l and s values. Various combination of process variable found at
s1=0, s2=0 is shown in the Table 4 with their experimental value Ye for the growth of B. bifidum.
Table 2 - Limiting value of independent variables.
Parameters Maximum value Minimum value
Temperature, (°C) 40 30
pH 8 4.5
Inoculum volume, (ml) 3 0.5
Inoculum age, (h) 78 30
Carbon content, (%w/v) 42.06 30
Nitrogen content, (% w/v) 46.67 14
Table 3 - Values of l and s for various experimental runs with 6 independent variables as sacrificing interactions.
S. No. x1 x2 x3 X4 x5 x6 l1,s1 l2,s2
1 1 1 1 1 1 1 5,1 5,1
2 1 1 1 1 1 -1 5,1 4,0
3 1 1 1 1 -1 1 4,0 4,0
4 1 1 1 1 -1 -1 4,0 3,1
5 1 1 1 -1 1 1 4,0 4,0
6 1 1 1 -1 1 -1 4,0 3,1
7 1 1 1 -1 -1 1 3,1 3,1
8 1 1 1 -1 -1 -1 3,1 2,0
9 1 1 -1 1 1 1 4,0 4,0
10 1 1 -1 1 1 -1 4,0 3,1
11 1 1 -1 1 -1 1 3,1 3,1
12 1 1 -1 1 -1 -1 3,1 2,0
13 1 1 -1 -1 1 1 3,1 3,1
14 1 1 -1 -1 1 -1 3,1 2,0
15 1 1 -1 -1 -1 1 2,0 2,0
16 1 1 -1 -1 -1 -1 2,0 1,1
17 1 -1 1 1 1 1 4,0 4,0
18 1 -1 1 1 1 -1 4,0 3,1
19 1 -1 1 1 -1 1 3,1 3,1
20 1 -1 1 1 -1 -1 3,1 2,0
(cont. table 3)
n x1 x2 x3 X4 x5 x6 l1,s1 l2,s2
21 1 -1 1 -1 1 1 3,1 3,1
22 1 -1 1 -1 1 -1 3,1 2,0
23 1 -1 1 -1 -1 1 2,0 2,0
24 1 -1 1 -1 -1 -1 2,0 1,1
25 1 -1 -1 1 1 1 3,1 3,1
26 1 -1 -1 1 1 -1 3,1 2,0
27 1 -1 -1 1 -1 1 2,0 2,0
28 1 -1 -1 1 -1 -1 2,0 1,1
29 1 -1 -1 -1 1 1 2,0 2,0
30 1 -1 -1 -1 1 -1 2,0 1,1
31 1 -1 -1 -1 -1 1 1,1 1,1
32 1 -1 -1 -1 -1 -1 1,1 0,0
33 -1 1 1 1 1 1 4,0 5,1
34 -1 1 1 1 1 -1 4,0 4,0
35 -1 1 1 1 -1 1 3,1 4,0
36 -1 1 1 1 -1 -1 3,1 3,1
37 -1 1 1 -1 1 1 3,1 4,0
38 -1 1 1 -1 1 -1 3,1 3,1
39 -1 1 1 -1 -1 1 2,0 3,1
40 -1 1 1 -1 -1 -1 2,0 2,0
41 -1 1 -1 1 1 1 3,1 4,0
42 -1 1 -1 1 1 -1 3,1 3,1
43 -1 1 -1 1 -1 1 2,0 3,1
44 -1 1 -1 1 -1 -1 2,0 2,0
45 -1 1 -1 -1 1 1 2,0 3,1
46 -1 1 -1 -1 1 -1 2,0 2,0
47 -1 1 -1 -1 -1 1 1,1 2,0
48 -1 1 -1 -1 -1 -1 1,1 1,1
49 -1 -1 1 1 1 1 3,1 1,1
50 -1 -1 1 1 1 -1 3,1 3,1
51 -1 -1 1 1 -1 1 2,0 3,1
52 -1 -1 1 1 -1 -1 2,0 2,0
53 -1 -1 1 -1 1 1 2,0 3,1
54 -1 -1 1 -1 1 -1 2,0 2,0
55 -1 -1 1 -1 -1 1 1,1 2,0
56 -1 -1 1 -1 -1 -1 1,1 1,1
57 -1 -1 -1 1 1 1 2,0 3,1
58 -1 -1 -1 1 1 -1 2,0 2,0
59 -1 -1 -1 1 -1 1 1,1 2,0
60 -1 -1 -1 1 -1 -1 1,1 1,1
61 -1 -1 -1 -1 1 1 1,1 2,0
62 -1 -1 -1 -1 1 -1 1,1 1,1
63 -1 -1 -1 -1 -1 1 0,0 1,1
Growth Characteristics Modeling of Bifidobacterium bifidum
Braz. Arch. Biol. Technol. v.54 n.6: pp. 1357-1366, Nov/Dec 2011
1363
Table 4 - Experimental design for B. bifidum with experimental value Ye.
S. No. Temp. °C
(x1)
pH (x2)
Inoculum volume (ml)
(x3)
Inoculum age (h) (x4)
Carbon content % (w/v) (x5)
Nitrogen content % (w/v) (x6)
Experimental value (Ye)
1 36.77 6.86 2.19 62.48 40.61 36.1 0.628
2 36.77 6.86 2.19 45.51 41.63 36.1 1.42
3 36.77 6.86 1.308 45.51 40.61 36.1 1.279
4 36.77 5.63 2.19 62.48 41.63 36.1 1.172
5 36.77 5.63 1.308 62.48 40.61 36.1 0.775
6 36.77 5.63 1.308 45.51 41.63 36.1 1.352
7 33.32 5.63 2.19 62.48 41.63 24.55 0.309
8 33.32 6.86 1.308 62.48 40.61 24.55 0.487
9 33.32 6.86 1.308 45.51 41.63 24.55 0.201
10 33.32 5.63 2.19 62.48 40.61 24.55 0.153
11 33.32 5.63 2.19 45.51 41.63 24.55 0.187
12 33.32 5.63 1.308 62.48 41.63 24.55 0.342
13 33.32 5.63 1.308 45.51 40.61 24.55 0.159
14 36.77 6.86 1.308 62.48 41.63 36.1 1.19
15 36.77 5.63 2.19 45.51 40.61 36.1 1.23
16 33.32 6.86 2.19 45.51 40.61 24.55 0.342
17 35 6.25 1.75 54 40.99 30.33 0.34
18 35 6.25 1.75 54 40.99 30.33 0.354
19 35 6.25 1.75 54 40.99 30.33 0.415
20 35 6.25 1.75 54 40.99 30.33 0.388
21 35 6.25 1.75 54 40.99 30.33 0.338
22 35 6.25 1.75 54 40.99 30.33 0.44
23 35 6.25 1.75 54 40.99 30.33 0.51
24 35 6.25 1.75 54 40.99 30.33 0.28
25 35 6.25 1.75 54 40.99 30.33 0.418
26 35 6.25 1.75 54 40.99 30.33 0.324
27 40 6.25 1.75 54 40.99 30.33 0.179
28 30 6.25 1.75 54 40.99 30.33 1.194
29 35 8 1.75 54 40.99 30.33 0.357
30 35 4.5 1.75 54 40.99 30.33 1.54
31 35 6.25 3 54 40.99 30.33 0.367
32 35 6.25 0.5 54 40.99 30.33 0.452
33 35 6.25 1.75 78 40.99 30.33 0.243
34 35 6.25 1.75 30 40.99 30.33 0.33
35 35 6.25 1.75 54 42.06 30.33 0.335
36 35 6.25 1.75 54 39.92 30.33 0.429
37 35 6.25 1.75 54 40.99 46.67 1.12
38 35 6.25 1.75 54 40.99 14 0.225
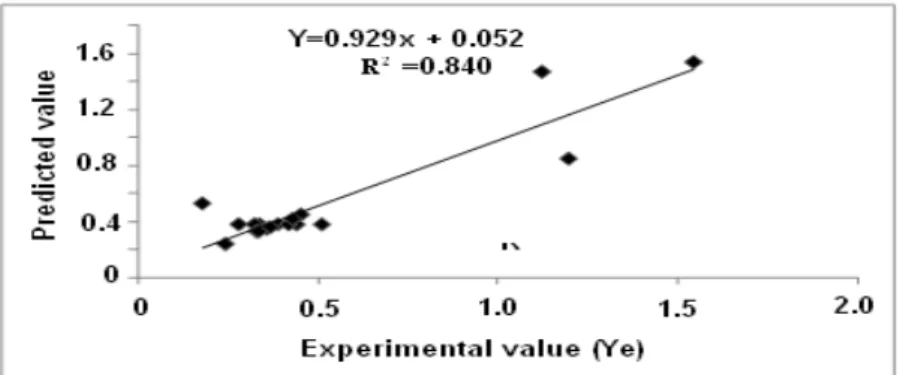
The experimental data were fitted to the full quadratic equation. The design matrix and the fitness of each term were analyzed by means of the ANOVA (Kumari et al., 2008). Figure 4 shows the
Figure 4 - Determination of regression equation Coefficient R2 for B. bifidum 255 EMD method.
A self-organizing feature map network was used to predict the growth condition parameters. Different factors, viz. temperature, pH, inoculum volume, Inoculum age, additional carbon and nitrogen sources were used as each unit of input layer. The output layer was composed of one response variable, the growth of B. bifidum. A set of factors was used for training and fed into the computer. Several iterations were conducted with different numbers of neurons of hidden layer in order to determine the optimal ANN structure.
The optimum number of neurons in the hidden
layer was iteratively determined by changing the number of neurons. This was started with two neurons and the number of neurons was increased up to six. The least MSE value and a good prediction of the outputs of both training and validation sets were obtained with four neurons in the hidden layer (Dutta et al., 2004). The R2 value between the actual and estimated responses was determined as 0.930 (Fig. 5). In ANN modeling, the replicates at center point did not improve the rediction capability of the network because of the similar inputs.
Figure 5 - Determination of regression equation Coefficient R2 for B. bifidum 255 ANN method.
Using MATLAB 7.0, the constants of regression equation and predicted value of dependent variable (OD) were found out. The ‘model’ which was obtained for B. bifidum 255 is given below.
Yp = 0.3789 - 0.1621 x1 - 0.6200 x2 - 0.0451x3 -
0.0414 x4 - 0.0567x5 + 0.8012 x6 + 0.3110 x1 2
+ 0.5667 x1x2 + 0.0277x1x3 - 0.0953 x1x4 - 0.0020 x1x5
+ 0.2900 x1x6 + 94.3853 x2 2
+ 8.4113 x2x3 - 8.3785
x2x4 + 32.7978 x2x5 + 1.7702 x2x6 + 0.3975 x3 2
+ 0.6130 x3x4 + 0.3763 x3x5 - 3.0558 x3x6 + 0.0620
x4 2
+ 0.4437 x4x5 - 8.6072 x4x6 + 0.6171x5 2
+ 6.7946 x5x6 - 31.6387 x6
2
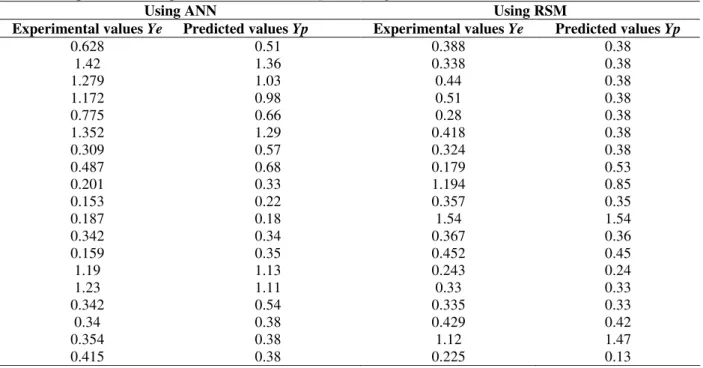
(Eq. 2) The predicted value of independent variable and corresponding experimental value for B. bifidum 255 is shown in Table 5. Genetic algorithms were applied on the data obtained from the neural network using MATLAB 7.0 The optimum values or the combination of different process parameters on which the bacterial growth measured by the optical density (OD) was maximum for B. bifidum
Growth Characteristics Modeling of Bifidobacterium bifidum
Braz. Arch. Biol. Technol. v.54 n.6: pp. 1357-1366, Nov/Dec 2011
1365
Table 5 - Experimental and predicted values for B .bifidum using RSM and ANN.
Using ANN Using RSM
Experimental values Ye Predicted values Yp Experimental values Ye Predicted values Yp
0.628 0.51 0.388 0.38
1.42 1.36 0.338 0.38
1.279 1.03 0.44 0.38
1.172 0.98 0.51 0.38
0.775 0.66 0.28 0.38
1.352 1.29 0.418 0.38
0.309 0.57 0.324 0.38
0.487 0.68 0.179 0.53
0.201 0.33 1.194 0.85
0.153 0.22 0.357 0.35
0.187 0.18 1.54 1.54
0.342 0.34 0.367 0.36
0.159 0.35 0.452 0.45
1.19 1.13 0.243 0.24
1.23 1.11 0.33 0.33
0.342 0.54 0.335 0.33
0.34 0.38 0.429 0.42
0.354 0.38 1.12 1.47
0.415 0.38 0.225 0.13
Table 6 - Optimum value of process parameters for B. bifidum 255.
There are several reports on the optimization of growth of the probiotic bacteria which are very close to the present result. Kiviharju et al. (2005) reported maximum production of B.longum at 40oC. Ram and Chander, (2003) reported maximum growth of Bifidobacteria at 37 oC and pH 7.0. Laxmi et al. (2011) reported the addition of carbon and nitrogen sources for enhanced growth of Bifidobacterium sp. In the present study, the RSM/ANN coupled with GA methodology resulted in an enhanced biomass yield. This is a new approach not reported earlier. However, optimization studies based on the ANN-GA for improved performance of biological systems have been reported earlier by Haider et al. (2008) and Sivapathasekaran et al. (2010).
CONCLUSION
In the present study, MATLAB 7.0 was used to fit the experimental values into a regression equation which predicted the yield of B. bifidum 255. The RSM and ANN methodologies coupled with GA were used for optimizing the input parameters. Both the models provided similar quality predictions for the above independent variables in terms of the growth conditions with ANN with more accuracy in estimation. The regression coefficients (R2) of ANN and RSM were 0.9368 and 0.8838, respectively, which clearly reflected that the ANN was better than RSM. The optimum values obtained after the GA study were 37.4°C, pH 7.09, inoculum volume 1.97 ml, inoculum age
Parameters Optimum values
Temperature, (°C) 37.4
pH 7.09
Inoculums volume, (ml) 1.95
Inoculums age, (h) 58.18
Carbon content, (%) w/v 41.74
58.58 h, carbon content 41.74% (w/v), nitrogen content 46.23% (w/v), resulting the maximum yield of probiotic bacteria. It was further noticed that ANN coupled with GA was the best combination for model development of B.bifidum.
REFERENCE
Ballongue, J. (1992), Bifidobacteria and probiotic action probiotics, the scientific basis. J. Dairy Sci., 7, 357-413.
Biavati, B.; Vescovo, M.; Torriabi, S. and Bottazzi, V. (2000), Bifidobacteria: history, ecology, physiology and applications. Analyt. Microbiol., 50,117-131. Das, H. (2005), Hand book of food processing
operations analysis. Asian book private limited, New Delhi.
Dutta, J.R.; Dutta, P.K. and Banerjee, R. (2004), Optimization of culture parameters for extracellular protease production from a newly isolated
Pseudomonas sp. using response surface and artificial neural network models. Process Biochem., 39, 2193-98.
Gangadharan, D.; Sivaramakrishnan, S.; Nampoothiri, K.M.; Sukumaran, R.K. and Pandey, A. (2008), Response surface methodology for the optimization of alpha amylase production by Bacillus amyloliquefaciens. Bioresource Technol., 99, 4597-02.
Gibson, G.R. and Roberfroid, M. (1995), Dietary modulation of the human colonic microbiota: introducing the concept of prebiotics. J. Nutr., 125, 1401–1412.
Gismondo, M.R.; Drago, L. and Lombardi, A. (1999), Review of probiotics available to modify gastrointestinal flora. Int. J. Antimicrob. Agents, 12, 287–292.
Goldberg, D. (1989), Genetic Algorithms in search,
Optimization and machine learning. Pearson Education, Asia.
Gulati, T.; Chakrabarti, M.; Singh, A.; Duvuuri, M. and Banerjee, R. (2010), Comparative study of response surface methodology, artificial neural network and genetic algorithms for optimization of Soybean hydration. Food Technol. Biotech., 48, 11-18.
Haider, M.A.; Pakshirajan, K.; Singh, A. and Chaudhury, S. (2008), Artificial neural network-genetic algorithm approach to optimize media constituents for enhancing lipase production by a soil microorganism. Appl. Biochem. Biotechnol., 144, 225-235.
Kiviharju, K.; Leisola, M. and Eerikäinen, T. (2005), Optimization of a Bifidobacterium longum production process. J. Biotechnol., 117, 299-308.
Kumari, K.S.; Babu, I.S. and Rao, G.H. (2008), Process optimization for citric acid production from raw glycerol using response surface methodology, Indian J. Biotech., 7, 496-501.
Laxmi, N.P.; Mutamed, M.A. and Nagendra, P.S. (2011), Effect of carbon and nitrogen sources on growth of Bifidobacterium animalis Bb12 and
Lactobacillus delbrueckii ssp. bulgaricus ATCC 11842 and production of β-galactosidase under different culture conditions. Int. Food Res. J., 18, 373-380.Mitsuoka, T. (1990), Bifidobacteria and their role in human health. J. Ind. Microbiol., 6, 263-268.
Myers, R.M. and Montgomery, D.C. (2002), Response surface methodology. John Wiley and Sons, Inc., New York.
Rajasekaran, S. and Vijaylakshmi, P.G.S. (2004),
Neural networks fuzzy Logic and genetic algorithms. Prentice Hall of India, New Delhi.
Ram, C. and Chander, H. (2003), Optimization of culture conditions of probiotic bifidobacteria for maximal adhesion to hexadecane. World J.
Microbiol. Biotechnol., 19, 407-410.
Sanders, M.E. (1999), Probiotics. Food Biotechnol.,53, 67–77.
Savage, D. (1977), Microbial ecology of the gastrointestinal tract. J. Microbiol., 31, 107-133. Schezenmeir, J. and De Vrese, M. (2001), Probiotics,
prebiotics, and synbiotics -approaching a definition.
Am. J. Clin. Nutr.,73, 361-364.
Sen, R. and Babu K.S. (2005), Modeling and optimization of the process conditions for biomass production and sporulation of a probiotic culture.
Process Biochem., 40, 2531-38.
Sivapathasekaran, C.; Mukherjee, S.; Ray, A.; Gupta, A. and Sen, R. (2010). Artificial neural network modeling and genetic algorithm based medium optimization for the improved production of marine biosurfactant. Bioresource Technol., 101, 1884-87. Ziemer, C.J. and Gibson, G.R. (1998), An Overview of
probiotics, prebiotics and synbiotics in the functional food concept: perspectives and future strategies. Int.
Dairy. J., 8, 473-479.