Food Science and Technology ISSN 0101-2061
DI:
D http://dx.doi.org/10.1590/1678-457X.05416
1 Introduction
The request for a healthier life associated with rapid and practical ways of eating has led to a continuous search for alternative products that can offer both convenience and nutritional balance. The ingestion of a balanced diet is the most effective and the safest way to avoid, or even correct, health problems like diabetes, malnutrition, obesity and heart disease (Gutkoski et al., 2007). As consequence of these conditions, changes in eating habits happened, resulting in the introduction of new foods on the market, with consequent increase in demand and consumption of healthy, nutritious and safe foods.
Amongst these foods it is included the cereal bars with their different types, flavors and nutritional compositions, which are among the products which had a higher growth in the food sector in recent years (Palazzolo, 2003), this fact favored by the reason of having their consumption facilitated because they do not require any additional preparation and can be commercialized in individual packages.
According to Ferreira et al. (2007) the cereal bars can offer high concentrations of fibers, vitamins and minerals being a practical and convenient way to ingest nutrients considered essential for a good organic functioning and thus preventing and controlling certain pathologies such as obesity, cancer, diabetes, among others.
In turn, the industry looks for new ingredients that can meet the demands of the consumer market that wants products with sensory and nutritional quality associated with benefits to health (Bower & Whitten, 2000). In developing new products, it is essential to optimize parameters such as shape, color, appearance, flavor, texture and consistency, as well as the interaction of different components in order to achieve a full balance that results in excellent quality and good acceptability (Barboza et al., 2003).
These foods should be pleasant and give satisfaction to the consumer, being these aspects result of the interaction of different parameters of sensory quality (Sampaio et al., 2010). Thus, the development of new products is of vital importance for the survival of most companies and is closely related to the needs and consumer trends. The consumers tend to become more selective and demanding when choosing the brands at their disposal.
Therefore, industries need to innovate and develop products that anticipate these needs to surprise the consumer and win the market ahead of the competition (Barboza et al., 2003). Supported in these aspects the industry has started investing in research aimed at developing new formulations of cereal bars that could meet the demands of the consumer market. Several types of ingredients or adjuvants have been searched. Noteworthy among them the binders that are generally based syrups derived
Physico-chemical, sensory and nutritional characteristics of cereal bars with addition
of acacia gum, inulin and sorbitol
Silvana Mariana SREBERNICH1*, Gisele Mara Silva GDNÇALVES2, Rita de Cássia Salvucci Celeste DRMENESE3, Cristiane Rodrigues Gomes RUFFI3
Received 19 Feb., 2016 Accepted 27 June, 2016
1 Faculty of Nutrition, Pontificia Universidade Católica de Campinas – PUC-Campinas, Campinas, SP, Brazil
2 Faculty of Pharmaceutical Sciences, Pontificia Universidade Católica de Campinas – PUC-Campinas, Campinas, SP, Brazil 3 Instituto de Tecnologia de Alimentos – ITAL, Campinas, SP, Brazil
*Corresponding author: srebernich@puc-campinas.edu.br Abstract
The cereal bars are products globally accepted and consumed by all age groups. In this study, by Response Surface Methodology (RSM), the effects of different concentrations of inulin, acacia gum and sorbitol in the characteristics of hardness, color and water activity of cereal bars were studied. A total of 17 experiments being 8 factorials, 6 axials and 3 repetitions at the central point were performed. The regression model presented for the hardness was significant indicating that the quantities of inulin, acacia gum and sorbitol affect the hardness of the cereal bars. Referring to color it was observed that the less inulin and more sorbitol, the more yellow the tone of the bars was. The results of water activity were not influenced by the ingredients. In a comprehensive assessment through the RSM, the bars coming from the treatments 5 and 11 provided the best results and when submitted to sensory evaluation they were not statistically different. Although these bars have presented reduction of 15 to 20% in calorific value, according to the DRC 54/2012 they cannot be considered products with a reduced caloric value. These bars also presented considerable level of soluble fiber (more than 3% inulin).
Keywords: soluble fiber; polyol; cereals; nutrition.
from sugar. Thus the use of other binders not sugar derivatives such as acacia gum becomes an alternative to be studied in the production of diet bars.
The use of acacia gum in the food industry has several technological, nutritional and functional properties. Referring to cereal bars, the use of acacia gum releases the use of lecithin in syrup due to its natural emulsifying properties. It also serves as binding agent in fruits and grains, promotes an inelastic short texture and by controlling water activity stabilizes the texture during storage (prevents hardening). It can also be used as a substitute for fats, contributing positively to the sensory characteristics of food, such as: flavor and its perception in the mouth, appearance, aroma etc. (Lethuaut et al., 2003). Being a product of low caloric value (1.3 to 1.8 kcal or 5.5 to 7.7 kj), resulting from its resistance to digestion, it contributes as a substitute for sugar and as a source of dietary fiber, being frequently employed in diet and light food products (Maruyama et al., 2006).
It is known that acacia gum has beneficial effects on health such as improved bowel habits, blood sugar lowering effect, low glycemic index and property of dietary fiber. In this line of research, studies done by Flamammg et al. (2006) showed a lower glycemic and insulin response in individuals who consumed cereal bars enriched with soluble fiber (guar gum) as compared to those who consumed commercial bars low in fiber.
Thus, the aim of this work was, by using Response Surface Methodology (RSM), to study the effects of different concentrations of acacia gum, inulin and sorbitol on physico-chemical, microbiological and sensory characteristics in the production of cereal bars in order to select the best ones.
2 Materials and methods
Rice and oat flakes, dried apple, cinnamon powder, maltodextrin, salt, apple juice, aspartame, flavors of apple and cinnamon, considered fixed ingredients (basic formulation) in the study, were purchased in the local market (Campinas/SP, Brazil) taking care to keep the same brands in all experiments. The other ingredients, considered variable ingredients, were: Acacia gum, a binding agent and source of soluble fiber – 90% dry basis (Fibregum B, provided by Nexira Brasil), Inulin, 96% soluble fiber (Beneo P95, provided by Clariant) and Sorbitol, sweetner and preservative (Polyglobe 0100, provided by Ingredion Brasil).
2.1 Experimental design
The experiments were conducted as Central Composite Rotational Design (CCRD) with 3 factors or independent variables (N). 17 experiments were performed (2N + 2N + 3)
being 8 factorials, 6 axials and 3 replicates at the central point. The axial points (-α and +α) are calculated by the equation α = (2N)1/4 being α = 1.682 (three variables). The independent
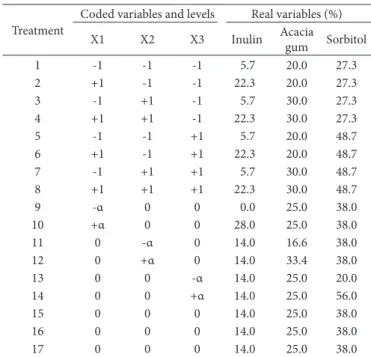
variables are the percentages of inulin, acacia gum and sorbitol used in the formulation. The levels of the variables studied were based on preliminary tests and the coded and real values of the 3 variables are shown in Table 1. The treatments were performed randomly.
2.2 Preparation of cereal bars
The bars were prepared according to the following steps: initially apple juice was heated at followed by addition of sorbitol syrup, acacia gum, inulin and maltodextrin being
these ingredients concentrated at 82-83 oBrix after what
flavor was added. Dver these ingredients, dry ingredients (mixture of rice and oat flakes, dried apples, cinnamon, salt and aspartame) were added followed by homogenization of the components. The mass obtained (38 ºC) were deposited in the mold followed by roller compaction and kept for 15 minutes at 8 ºC. After this time the bars were removed from the mold (28 ºC) and package in polyethylene film and storage at room temperature. The amounts of inulin, acacia gum and sorbitol are described in Table 1.
Four batches of each treatment from the experimental design were performed yielding a total of 60 cereal bars (15 bars per batch since the template used had 15 cells being each cell equivalent to one cereal bar). The shape of the bars was obtained according to the dimensions of the cells (85 x 30 x 12 mm, respectively length, width and height).
The bars produced were stored at room temperature for a period of seven days in order to achieve the stabilization of the chemical reactions and also the physical-chemical properties of the ingredients, therefore reducing their influence on the physico-chemical parameters analyzed.
2.3 Cereal bars evaluation
The cereal bars from the treatments were evaluated for responses or dependent variables: texture (hardness), color and water activity.
Table 1. Experimental design for three independent variables.
Treatment
Coded variables and levels Real variables (%)
X1 X2 X3 Inulin Acacia
gum Sorbitol
1 -1 -1 -1 5.7 20.0 27.3
2 +1 -1 -1 22.3 20.0 27.3
3 -1 +1 -1 5.7 30.0 27.3
4 +1 +1 -1 22.3 30.0 27.3
5 -1 -1 +1 5.7 20.0 48.7
6 +1 -1 +1 22.3 20.0 48.7
7 -1 +1 +1 5.7 30.0 48.7
8 +1 +1 +1 22.3 30.0 48.7
9 -α 0 0 0.0 25.0 38.0
10 +α 0 0 28.0 25.0 38.0
11 0 -α 0 14.0 16.6 38.0
12 0 +α 0 14.0 33.4 38.0
13 0 0 -α 14.0 25.0 20.0
14 0 0 +α 14.0 25.0 56.0
15 0 0 0 14.0 25.0 38.0
16 0 0 0 14.0 25.0 38.0
Hardness
The hardness determination was performed in texturometer TA-XT2 (Stable Micro SystemsTM), operating with the software
Texture Expert, operation mode: measure strength in compression, probe HDP/KS5 Kramer Shear Cell under the following conditions: speeds pre-test and testing: 2.0 mm/s; post-test speed: 10.0 mm/s, distance of 90%, 5 replicates (Drmenese, 2010).
Color
To measure the color in three dimensions (brightness - L* and redness-greenness – a* and yellowness-blueness – b* coordinates), it was used the colorimeter Color Eye 2020, software CDMCDR 1500PlusTM - Macbeth, with direct reading in the sample, with 20mm
in diameter, 10º observation, illuminant D65 and configuration DREDS to obtain the L* values (brightness), -a/+a* (green/red) and -b/+b* (blue/yellow), in triplicate (Drmenese, 2010).
Water activity
Samples of cereal bar were previously macerated in a porcelain mortar and homogenized in triplicate and the water activity
was measured directly in a hygrometer AquaLabTM (CX-2T
model, Decagon Devices Inc., Washington, USA) at a constant temperature (25.0 ± 0.3 °C) (Drmenese, 2010).
2.4 Analysis of the results of the dependent variables
The average responses of hardness, color and water activity for each of the 17 treatments were treated by Multiple Regression Analysis of Response Surface Methodology (Barros et al., 1995) to develop mathematical models, with the use of the program “Statistica for Windows 5.0”. Through this statistical methodology it was studied the effects of independent variables on the dependent variables. The values of the estimated effects show how each factor (independent variable) influence the various parameters (dependent variables).
Analysis of Variance (F test) was applied to test the adequacy of the models. It was observed the significance of regression and lack of fit for 95% confidence level by F test and the coefficient of determination (R2). The closer to 100%, the better the model
fit the experimental data observed.
To determine the effect of independent variables on the responses, three-dimensional graphics were drawn with the program Statistica, settling one of the independent variables at the midpoint.
2.5 Complementary evaluation
Among the treatments studied were selected two which presented the best macroscopic features and lowest amount of gum acacia in the formulation (lower cost) for a complementary evaluation in order to better characterize them.
Microbiological evaluation
Microbiological analysis of coliform bacteria (45 oC), Bacillus
cereus and Salmonella (pathogens relevant to public health associated with this type of product) were conducted to verify if the samples met the microbiological standards established by
the Directory Collegiate of the National Agency for Sanitary Surveillance, Ministry Health (Brasil, 2001). Molds and yeasts were also determined, since they are potential spoilage in this type of product. The methods used are described in Silva et al. (2010).
Physico-chemical evaluation
The determination of moisture was carried out by using the Standard Method 012/IV from Adolfo Lutz Institute (Instituto Adolfo Lutz, 2005) while the determination of ash, protein and lipids were performed according to methodology described by ADAC (Association of Dfficial Analytical Chemists, 2000). The carbohydrate content was calculated by difference from the levels of nutrients analyzed.
Sensory evaluation
The two best formulations were evaluated by 50 consumers of cereal bars on the acceptability of the appearance and of the product overall through 9-point hedonic scale (9 = like extremely, 5 = neither like nor dislike, 1 = dislike extremely). The color, texture (adhesiveness, crunchiness, chewiness), flavor (caramel, fruit) and taste (sweetness, acidity) were evaluated for intensity scale (1 = very little intense, 5 = moderately intense, 9 = extremely intense). To purchase intent it was used a 5-point scale (5 = definitely buy, 3 = may buy or may not buy, 1 = definitely would not buy) (Meilgaard, Civille & Carr, 2006). Tests were carried out with volunteer consumers selected by invitation after they signed a written Free Consent Form. In addition, this study was approved by the Research Ethics Committee of Pontificia Universidade Católica de Campinas under protocol 751/07.
Statistical Analysis for the results of sensory analysis
The results of sensory analysis were subjected to analysis of variance (ANDVA) followed by the Tukey test for comparison of means at 5% probability (Statsoft, 2000).
Caloric value
The total caloric value was calculated by using the Equation 1:
( ) ( ) 1
4 9 .
TCV = carbohidrates +proteín + lípids kcal g− (1)
3 Results and discussion
The results of analysis of hardness, color and water activity of the cereal bars of each one of the 17 trials established in the experimental design (Table 2), were treated by multiple regression analysis of Response Surface Methodology, to develop mathematical models, with the use of Statistica software (Barros et al., 1995).
1 2 2
2 3 1 3
183, 688 6, 536 23, 287 –
435 – 1, 657 – 122
HARD x x
x x x x
= − + + (2)
In the analysis of the terms of regression the proposed model for hardness, it was observed that the terms related to quantities of the three ingredients studied inulin (x1), acacia gum (x2) and sorbitol (x3), within the ranges studied in the
trials, were statistically significant, affecting the hardness of the bars, i.e., the more acacia gum and inulin and less sorbitol, the greater the hardness of the product. Moreover the increase in hardness of bars might be due to migration of moisture between the carbohydrates (such as starches, pectins, sugars and maltodextrin) and the proteins (Shaun, 2008).
Looking at the response surface generated for this response (Figure 1) it was observed that the region of less hardness was located at the points where the amount of sorbitol used in the treatment was maximal, regardless of the amount of acacia gum.
A study conducted by Freitas & Moretti (2006) shows that the breaking strength increases as the fiber content and sugar increase. In this study variations in texture between the samples are derived from different items of the independent variables. Thus, inulin and gum acacia, as sources of fiber, increase strength while sorbitol has the opposite effect.
Relative to color (brightness - L* and redness-greenness - a* and yellowness-blueness - b* coordinates), L* values (brightness), –a/+a* (green/red) and -b/+b* (blue/yellow), from the results obtained in the ANDVA for the dependent variable b*, the adjusted model is significant, with the percentage of variation equal to 76.12%. The model with the coded variable considering the regression coefficient statistically significant at p <0.05 for these independent variables is (Equation 3):
b* = 23.138 – 0.0982x1 + 0.112x3 (3)
In assessing the response surface generated for b* (Figure 2), it appears that the less inulin and more sorbitol, the more yellow (+b*) is the tone of the cereal bars. There was no significant effect of acacia gum amount in the parameter of color b*.
ANDVA showed that the regression models were not significant for L* and a* at 95% confidence level (p ≤ 0.05). The coefficients of determination were equal to 0.462 and 0.489 respectively. This shows that these dependent variables, within the conditions studied, do not represent important responses to assess the influence of the quantities of the ingredients tested in the formulation of cereal bars.
Water activity (aw): ANDVA showed that the regression
model was not significant for the data of water activity at 95% confidence level (p ≤ 0.05). The determination coefficient obtained was equal to 0.659. This shows that the water activity, within the conditions studied, does not represent an important response to the evaluation of the influence of the quantities of the ingredients tested in the formulation of cereal bars.
All tests have generated samples with water activity below 0.60, which prevents the proliferation of spoilage microorganisms, especially osmophilic yeasts and xerophilic fungi (Bobbio & Bobbio, 1992). It features low-perishable products and can be stored for long periods, enabling their production in large-scale.
It is known that water activity of cereal bars varies in function of its ingredients and storage time (Freitas & Moretti, 2005). Therefore, cereal bars made with sugar, bran and cereals tend to present high moisture contents leading to the results of water activity exceeding 0.61 and interfering directly with the
shelf life of the product.
The results of complementary evaluation of the 2 best cereal bars (treatments 5 and 11) are presented and discussed as follow.
Table 2. Results of hardness (texture), color (L*, a* and b*) and water activity (aw) of the cereal bars coming from the 17 treatments.
Treatment Hardness (gf)
Color
aw
L* a* b*
1 68685.2 ± 3675.3 52.78 ± 0.48 11.26 ± 0.27 25.64 ± 0.34 0.552 ± 0.002
2 148501.9 ± 15615.2 59.49 ± 1.28 10.28 ± 0.40 25.80 ± 0.81 0.534 ± 0.005
3 124414.4 ± 9901.2 58.79 ± 0.52 9.83 ± 0.38 25.54 ± 1.36 0.551 ± 0.003
4 149683.9 ± 13055.6 62.70 ± 2.17 8.39 ± 0.66 23.53 ± 1.41 0.572 ± 0.007
5 31360.5 ± 2126.7 57.57 ± 0.81 9.99 ± 0.07 28.03 ± 0.64 0.590 ± 0.001
6 41598.9 ± 2526.6 60.28 ± 0.13 9.25 ± 0.43 25.81 ± 0.84 0.594 ± 0.003
7 38635.1 ± 2023.7 52.94 ± 0.56 11.62 ± 0.49 27.52 ± 1.34 0.591 ± 0.002
8 46676.3 ± 2130.0 54.14 ± 0.60 11.07 ± 0.46 26.13 ± 0.81 0.573 ± 0.006
9 54800.8 ± 4368.1 55.37 ± 1.16 11.58 ± 0.63 27.65 ± 0.89 0.587 ± 0.002
10 109228.3 ± 1312.8 59.89 ± 2.03 9.00 ± 0.23 24.27 ± 0.64 0.596 ± 0.003
11 46209.6 ± 4566.6 53.84 ± 0.66 11.61 ± 0.56 25.72 ± 0.07 0.585 ± 0.001
12 67432.6 ± 1.766.9 54.80 ± 0.22 11.21 ± 0.10 26.81 ± 1.01 0.576 ± 0.003
13 138727.3 ± 9265.0 60.21 ± 0.91 7.60 ± 0.39 22.36 ± 0.67 0.567 ± 0.007
14 44132.5 ± 743.9 55.42 ± 0.48 11.93 ± 0.31 27.90 ± 0.66 0.576 ± 0.004
15 92186.4 ± 11903.6 60.35 ± 1.41 9.93 ± 0.66 25.86 ± 1.55 0.572 ± 0.001
16 86657.5 ± 5530.1 61.30 ± 1.09 9.68 ± 0.40 26.98 ± 0.44 0.575 ± 0.006
17 95825.4 ± 7028.6 54.60 ± 1.79 10.99 ± 0.31 26.48 ± 1.01 0.574 ± 0.002
The results obtained in the microbiological analyses of the cereal bars were in accordance with Resolution 12/01 (Brasil, 2001) which establishes as maximum values 5 x 10 for coliforms at 45 ºC/g, 5 x 10² for Bacillus cereus/g and absence for Salmonella
sp./25 g. Therefore, the cereal bars analyzed proved to be adequate for consumption. The main factors for obtaining these results are related to the microbiological quality of raw material used, with hygienic care taken in preparing the bar and with low water activity, unfavorable to microbial growth.
However, even with the favorable results obtained in this study, the microbiological evaluation should be carried out, since the process conditions do not favor the destruction of the original microbial load of raw material, hence the importance of working with raw materials of good microbiological quality.
In the evaluation of the overall appearance and the intensity of the attributes color, texture (adhesiveness, crunchiness, chewiness), flavor (caramel, fruit) and taste (sweetness, acidity) there was no significant difference (p> 0.05) between treatments 5 and 11.
Both samples obtained averages corresponding to “liked moderately” for appearance. The color, caramel flavor and acidity of both samples were considered little intense; the crispness,
the flavor of fruit and sweetness obtained means between “little intense” and “moderately intense” and adhesiveness and chewiness were considered “moderately intense”.
Referring to the acceptability of the product in a global way, treating 11 with an average close to “liked moderately” was significantly (p ≤ 0.05) better accepted than treatment 5, which had an average corresponding to “liked slightly” on the scale used for the evaluation.
Thus, with higher levels of acacia gum occurs an increase of the adhesiveness among the ingredients of the formulation leading to compression of the bar and the presence of higher amount of this gum in treatment 5 may have had some influence on the characteristics of chewiness, crispness and adhesiveness thus affecting the overall quality.
About the frequency of purchase intent (positive, indifferent and negative), the negative purchase intention was less than 10%, independent of the treatment considered. Dn the other hand, the positive purchase intention (definitely buy and probably buy) was 54% and 64% for the treatments 5 and 11 respectively, which confirms the greater acceptability of the treatment 11 by the consumers.
This preference follows the trend observed by Gutkoski et al. (2007) who state that the purchase intent increases with increasing fiber in cereal bars.
Proximate composition of cereal bars formulation 5 and 11 was determined through the physical and chemical analysis. The results obtained in these determinations are shown in Table 3.
Dbserving the moisture data presented in Table 3 (13.50% and 13.36%), there was no difference (p > 0.05) between the formulations analyzed. It can be observed that the results are well above the most cited by several authors [Mourão et al. (2009) - 4.68 to 7.28%; Brito et al. (2004) - 7.63% and Freitas & Moretti (2005) - 10.71%], but relatively close to those found
Table 3. Means of physical-chemical determinations expressed in percentage and total caloric value of cereal bars.
Determination (%)
Formulation
5 11 d.m.s. (5%)
Moisture 13.50 ± 0.33 a 13.36 ± 0.11 a 0.73
Total solids 86.50 ± 0.33 a 86.64 ± 0.11 a 0.74
Protein 3.93 ± 0.08 a 3.82 ± 0.24 a 0.13
Lipids 1.20 ± 0.03 a 1.20 ± 0.04 a 0.04
Mineral matter 1.57 ± 0.08 a 1.54 ± 0.07 a 0.07
Carbohydrates1 79.80 80.08
---Total sugar 50.58 ± 0.70 a 60.02 ± 0.27 b 2.73
Reducing sugar 6.22 ± 0.34 b 5.17 ± 0.04 a 0.99
Calories (kcal.100 g-1)2 338.90 340.40
---Calories (kcal.25 g-1)3 84.70 85.10
---1 value calculated by difference; 2 value calculated using conversion factors of 4 kcal.g-1 for carbohydrates and protein and 9 kcal.g-1 for lipids; 3 calories equivalent to a commercial bar;
reducing sugars, the formulations were statistically different (p ≤ 0.05) ranging from 5.17% (formulation 11) to 6.22% (formulation 5). Due to the presence of sorbitol in place of glucose syrup in these formulations the results of this study are much lower than those found by Garcia et al. (1998) who obtained for reducing sugars values between 23.31 to 25.39% due to the high percentage of glucose syrup used in the formulations.
As for the caloric value of the bars there was no difference between the formulations and the results found correspond to a reduction of 15% over the average caloric value (400 kcal) described in the labels of conventional commercial bars. Although the product is not considered as reduced-calorie according to DRC 54/2012, this is a positive factor in favor of the bars developed in this study, whereas today one expects from food the supply of nutrients needed by the body but with lower caloric value. These results are superior to those found by Gutkoski et al. (2007) (291.61 to 321.70 kcal.100 g-1), close to those found by
Guimarães & Silva (2009) (349.61 to 358,77 kcal.100 g-1) and by
Silva et al. (2009) (344 kcal.100 g-1) and lower than those found
by Mourão et al. (2009) (377 to 404 kcal.100 g-1).
4 Conclusions
The results of this study showed the feasibility of obtaining cereal bar, apple and cinnamon flavor with additions of inulin, gum acacia and sorbitol within the levels studied. These cereal bars when subjected to microbiological analysis showed to be within the standards established by the Brazilian Food Legislation (DRC 12/2001) (Brasil, 2001) and this was favored by low water activity, unfavorable to microbial growth. The results also showed that the independent variables had no significant influence on the water activity and on the parameters associated with color, light and shade of green/red. In turn, lower amounts of inulin and greater amounts of sorbitol lead to product more yellowish, while the gum acacia did not affect this parameter.
Regarding the hardness of the product, inulin, acacia gum and sorbitol interfere directly. Low concentration of inulin and acacia gum and a higher concentration of sorbitol lead to bars with less hardness. A comprehensive assessment of the bars through the SRM, those coming from the formulations 5 and 11 provided the best results. When the formulations 5 and 11 were compared by sensory evaluation, they were statistically equal for all attributes considered, except for the overall acceptance attribute, in which the formulation 11 was superior.
This fact reflected in the parameter purchase intent being the formulation 11, with 64% of the panel likely to buy superior than formulation 5 (54%). Regarding the composition formulations 5 and 11 had low levels of protein and lipids while the opposite occurred as the mineral matter.
The bars also presented reduction of 15 to 20% in calorific value, but in accordance with the DRC 54/2012 they cannot be considered products with a reduced calorific value. Moreover these bars presented considerable level of soluble fiber (more than 3% inulin).
by Mridula et al. (2013) - 11,4 to 13,2%; Gutkoski et al. (2007) - 10.75 to 13.95% and Loveday et al. (2009) - 10 to 15%. Thus, it is perceived by the various studies cited that the moisture of the cereal bars varied considerably, ranging from 4.68 to 15.00%. Therefore, the data obtained for moisture in this study are within the values mentioned in literature.
Concerning the protein content, it ranged between 3.82% (formulation 11) and 3.93% (formulation 5) having no significant difference (p ≤ 0.05) between them. When comparing these values with those presented in the literature it is observed that the values obtained in this study are lower than those. So Dutcosky et al. (2006), Guimarães & Silva (2009) and Gutkoski et al. (2007) reported values for protein from 4.34 to 5.36%; 5.58 to 6.15%; 6.18 to 12.37%, respectively. These differences are a result of the quantities and ingredients used in bars and bar types produced, since bars are produced with different goals or purposes. Thus, there are cereal bars with high caloric value to athletes, high-fiber bars, high protein bars etc. However, the results of protein obtained with the cereal bar in this study are close to those of commercial bars on the market, which is on average 4.4%.
As for lipids content, the results were the same with no difference between the two formulations. Data concerning the lipid content in cereal bars cited in the literature are usually higher than those obtained in this work. So Garcia et al. (1998) working with cereal bars containing different levels of toasted rice bran obtained lipids between 7.43 and 9.57%, while Silva et al. (2009), Gutkoski et al.(2007) and Guimarães & Silva (2009) obtained lipids ranging from 7.5 to 7.8%, from 4.94 to 6.57 and from 4.26 to 5.32% respectively. In turn, Dutcosky et al. (2006) obtained values between 2.60 and 4.13% for banana flavored cereal bars and between 1.28 and 2.85% for cereal bars passion fruit taste, the latter values closer to that found in this study.
However, values in a much wider range (between 5.19 and 17.43%) were found by Mourão et al. (2009), Brito et al. (2004) claim that the commercial bars lipid content varies, on average, from 5 to 6%, but bars with the most varied contents can be found, from 0.68% as quoted by Brito et al. (2004) till 12% or more, especially in the case of commercial bars with chocolate coating.
As for the ash, the values obtained in this study varied between 1.54 (formulation 11) and 1.57% (formulation 5) and there was no significant difference (p > 0.05) between them, but they were higher than the values found by Brito et al (2004), Guimarães & Silva (2009) reported ash content between 1.15 to 1.38% in cereal bars made with dried fruit and dried buriti in different concentrations. Moreover, Garcia et al. (1998) found ash values between 2.61 and 3.68%, up from values found in this study.
As for carbohydrates, these were obtained by difference and ranged between 79.80 and 80.08%, but above the average, around 74% found in commercial bars. Moreover, Mourão et al. (2009) obtained values between 62.93 and 79.83% while Garcia et al. (1998) obtained values between 67.37 and 72.11%. However, like other nutrients, the amount of carbohydrates is subject to composition of the ingredients of the bars.
Gutkoski, L. C., Bonamigo, J. M. A., Teixeira, D. M. F., & Pedó, I. (2007). Desenvolvimento de barras de cereais à base de aveia com alto teor de fibra alimentar. Ciência e Tecnologia de Alimentos, 27(2), 355-363. http://dx.doi.org/10.1590/S0101-20612007000200025.
Instituto Adolfo Lutz – IAL. (2005). Normas analíticas do Instituto Adolfo Lutz: métodos físico-químicos para análise de alimentos (4th ed., Série A - Normas e Manuais Técnicos). Brasília: Ministério da Saúde. Lethuaut, L., Brossard, C., Rousseau, F., Bousseau, B., & Genot, C.
(2003). Sweetness-texture interactions in model dairy desserts: effect of sucrose concentration and the carrageenan type. International Dairy Journal, 13(8), 631-641. http://dx.doi.org/10.1016/S0958-6946(03)00106-7.
Loveday, S. M., Hindmarsh, J. P., Creamer, L. K., & Singh, H. (2009). Physicochemical changes in a model protein bar during storage. Food Research International, 42(7), 798-806. http://dx.doi.org/10.1016/j. foodres.2009.03.002.
Maruyama, L. Y., Cardarelli, H. R., Buriti, F. C. A., & Saad, S. M. I. (2006). Textura instrumental de queijo petit-suisse potencialmente probiótico: influência de diferentes combinações de gomas. Ciência e Tecnologia de Alimentos, 26(2), 386-393. http://dx.doi.org/10.1590/ S0101-20612006000200022.
Meilgaard, M., Civille, G. V., & Carr, B. T. (2006). Sensory evaluation techniques (4th ed., 448 p.). Boca Raton: CRC Press.
Mourão, L. H. E., Pontes, D. F., Rodrigues, M. C. P., Brasil, I. M., Souza, M. A. No., & Cavalcante, M. T. B. (2009). Dbtenção de barras de cereais de caju ameixa com alto teor de fibras. Alimentos e Nutrição, 20(3), 427-433.
Mridula, D., Singh, K. K., & Barnwal, P. (2013). Development of omega-3 rich energy bar with flaxseed. Journal of Food Science and Technology, 50(5), 950-957. http://dx.doi.org/10.1007/s13197-011-0425-x. PMid:24426002.
Drmenese, R. C. S. C. (2010). Obtenção de farinha de banana verde por diferentes processos de secagem e aplicação em produtos alimentícios (Tese de doutorado). Faculdade de Engenharia de Alimentos, Universidade Estadual de Campinas, Campinas.
Palazzolo, G. (2003). Cereal bars: they’re not just for breakfast anymore. Cereal Foods World, 48(2), 70-72.
Sampaio, C. R. P., Ferreira, S. M. R., & Canniatti-Brazaca, S. G. (2010). Caracterização físico-química e composição de barras de cereais fortificadas com ferro. Alimentos e Nutrição, 21(4), 607-616. Shaun, P. A. (2008). Mechanisms of nutrition bar hardening: effect of
hydrolyzed whey protein and carbohydrate source (Dissertação de mestrado), Utah State University, Logan, Utah.
Silva, I. Q., Dliveira, B. C. F., Lopes, A. S., & Pena, R. S. (2009). Dbtenção de barra de cereais adicionada do resíduo industrial de maracujá. Alimentos e Nutrição, 20(2), 321-329.
Silva, N., Junqueira, V. C. A., Silveira, N. F. A., Taniwaki, M. H., Santos, R. F. S., & Gomes, R. A. R. (2010). Manual de métodos de analise microbiológica de alimentos e água (4th ed., pp. 113-302). São Paulo: Livraria Varela.
Statsoft. (2000). Statistica for Windows. Tulsa: Statsoft. Retrieved from http://www.statsoft.com
References
Association of Dfficial Analytical Chemists – ADAC. (2000). Official methods of analysis of the association of Official Analytical Chemists (17th ed., Vol. 2). Gaithersburg: ADAC.
Barboza, L. M. V., Freitas, R. J. S., & Waszczynskyj, N. (2003). Desenvolvimento de produtos e análise sensorial. Brasil Alimentos, 18, 34-35.
Barros, B. No., Scarminio, I. S., & Bruns, R. E. (1995). Planejamento e otimização de experimentos (303 p.). Campinas: Editora da UNICAMP. Bobbio, F. D., & Bobbio, P. A. (1992). Química do processamento de
alimentos (145 p.). São Paulo: Varela.
Bower, I. A., & Whitten, R. (2000). Sensory characteristics and consumer liking for cereal bar snack foods. Journal of Sensory Studies, 15(3), 327-345. http://dx.doi.org/10.1111/j.1745-459X.2000.tb00274.x. Brasil. Agência Nacional de Vigilância Sanitária. (2001, January 10).
Aprova o regulamento técnico sobre padrões microbiológicos para alimentos (Resolução RDC nº 12, de 02 de janeiro de 2001). Diário Oficial [da] Republica Federativa do Brasil, seção 1.
Brito, I. P., Campos, J. M., Souza, T. F. L., Wakiyama, C., & Azeredo, G. A. (2004). Elaboração de avaliação global de barra de cereais caseira. Boletim do Centro Pesquisa e Processamento de Alimentos, 22(1), 35-50.
Dutcosky, S. D., Grossmann, M. V. E., Silva, R. S. S. F., & Welsch, A. K. (2006). Combine sensory optimization of a prebiotic cereal product using multicomponent mixture experiments. Food Chemistry, 98(4), 630-638. http://dx.doi.org/10.1016/j.foodchem.2005.06.029. Ferreira, L. G., Pontes, D. F., & Rodrigues, M. C. P. (2007). Avaliação
sensorial de barras de cereais com propriedades funcionais, direcionadas a mulheres no período do climatério, São Paulo. Higiene Alimentar, 21(155), 33-37.
Flamammg, A. M., Kendall, D. M., Baumgartner, C. J., Slagle, T. D., & Choe, Y. S. (2006). Effect of a viscous fiber bar on post prandial glycemia in subjects with type 2 diabetes. Journal of the American College of Nutrition, 25(5), 409-414. http://dx.doi.org/10.1080/073 15724.2006.10719553. PMid:17031010.
Freitas, D. G. C., & Moretti, R. H. (2005). Barras de cereais elaboradas com proteína de soja e gérmen de trigo, características físico-químicas e textura durante o armazenamento. Archivos Latinoamericanos de Nutrición, 55(3), 299-304.
Freitas, D. G. C., & Moretti, R. H. (2006). Caracterização e avaliação de sensorial de barras de cereais funcional de alto teor protéico e vitamínico. Ciência e Tecnologia de Alimentos, 26(2), 318-324. http:// dx.doi.org/10.1590/S0101-20612006000200014.
Garcia, M. C., Lobato, L. P., Benassi, M. T., & Soares, M. S.Jr. (1998). Application of toasted rice bran in cereal bars. Ciência e Tecnologia de Alimentos, 32(4), 718-724. http://dx.doi.org/10.1590/S0101-20612012005000096.