Vol.57, n.6: pp. 962-970, November-December 2014 http://dx.doi.org/10.1590/S1516-8913201402657
ISSN 1516-8913 Printed in Brazil
BRAZILIAN ARCHIVES OF BIOLOGY AND TECHNOLOGY
A N I N T E R N A T I O N A L J O U R N A L
Growth Characteristics Modeling of Mixed Culture of
Bifidobacterium bifidum and Lactobacillus acidophilus using
Response Surface Methodology and Artificial Neural
Network
Ganga Sahay Meena
1*, Gautam Chandra Majumdar
1, Rintu Banerjee
1, Nitin Kumar
1and
Pankaj Kumar Meena
21 Microbial Biotechnology and Downstream Processing Laboratory; Department of Agricultural and Food
Engineering; Indian Institute of Technology; Kharagpur - India. 2By Product Laboratory; Dairy Technology Division National Dairy Research Institute; Karnal; Haryana - India.
ABSTRACT
Different culture conditions viz. additional carbon and nitrogen content, inoculum size and age, temperature and pH of the mixed culture of Bifidobacterium bifidum and Lactobacillus acidophilus were optimized using response surface methodology (RSM) and artificial neural network (ANN). Kinetic growth models were fitted for the cultivations using a Fractional Factorial (FF) design experiments for different variables. This novel concept of combining the optimization and modeling presented different optimal conditions for the mixture of B. bifidum and L. acidophilus growth from their one variable at-a-time (OVAT) optimization study. Through these statistical tools, the product yield (cell mass) of the mixture of B. bifidum and L. acidophilus was increased. Regression coefficients (R2) of both the statistical tools predicted that ANN was better than RSM and the regression equation was solved with the help of genetic algorithms (GA). The normalized percentage mean squared error obtained from the ANN and RSM models were 0.08 and 0.3%, respectively. The optimum conditions for the maximum biomass yield were at temperature 38°C, pH 6.5, inoculum volume 1.60 mL, inoculum age 30 h, carbon content 42.31% (w/v), and nitrogen content 14.20% (w/v). The results demonstrated a higher prediction accuracy of ANN compared to RSM.
Key words: Response surface methodology (RSM), Artificial neural network (ANN), Genetic algorithms (GA),
Fractional factorial design (FFD), Bifidobacterium bifidum, Lactobacillus acidophilus
*Author for correspondence: [email protected]
INTRODUCTION
According to the recently adopted definition by FAO/WHO, probiotics are live microorganisms, which when administered in adequate amounts confer a health benefit on the host (Hemaiswarya et al. 2013). Probiotics are not a new invention but have existed in traditional foods such as beverages, salty fishes, yogurt, different types of cheeses, etc since olden times (Amara and shibl 2013). Several microbial groups have the potential to function as probiotics but the species of
Lactobacillus and Bifidobacterium are the most
may be direct or indirect such as enhanced barrier function, modulation of the mucosal immune system, production of antimicrobial agents, enhancement of digestion and absorption of food and alteration of the intestinal microflora (Hemaiswarya et al. 2013), anti-mutagenic effects, anti-carcinogenic properties, improvement in lactose metabolism, reduction in serum cholesterol and immune system stimulation (Shah 2007), better calcium absorption, prevention of allergy and reduction in dental decay are associated with the consumption of probiotics (Singh et al. 2011). According to a recent market research report, ‘Probiotics Market (2009;2014)’, the global probiotics market generated US$15.9 billion in 2008 and was expected to be worth US$ 32.6 billion by 2014 with a compound annual growth rate of 12.6% from 2009 to 2014. India is fast emerging as a potential market for probiotics in foods with several companies such as Nestle, Mother Dairy, Danisco, Chr Hansen, Yakult and Danone. The probiotic product industry in India is an estimated 20.6 million with a projected annual growth rate of 22.6% until 2015 (Ganguly et al. 2011). Probiotics in India generally come in two forms, viz., milk and fermented milk products with the former constituting a major chunk (50-60%) of the market. List of probiotic containing foods is wide and still growing. Main products existing in the market are dairy-based, including fermented milks, cheese, ice cream, buttermilk, milk powder, and yogurts, the latter accounting for the largest share of sales. Usually, dairy products are known as the ‘best carrier’ of probiotics.
Probiotic bacteria such as Lactobacillus and
Bifidobacterium can play an important role in
promoting human health in the gastrointestinal tract (Mitsuoka 1990). They actively contribute in the digestion, immune stimulation and inhibition
of pathogens such as Bacteroides, Escherichia,
Clostriduim and Proteus, which are potentially
harmful bacteria found in the gastrointestinal tract (Ziemer and Gibson 1998). Recently, systematic reviews on the health benefits of probiotics in details have been published (Aureli et al. 2011; Amara and Shibl 2013). The effectiveness of the probiotic effects generally depends on the mechanisms by which they exerts their activities. Mostly, to treat a disease, the probiotics follow a set of mechanisms, which were recently reviewed (Hemaiswarya et al. 2013). The primary mechanism for probiotic action is known as
competitive colonization, or competitive
suppression, best described as the proliferation of probiotic bacteria in the human intestine, leaving little space and food for the growth of any pathogens. Secondary, the by-products (i.e., lactic acid and acetic acid) secreted by these probiotics lowers the pH, thereby creating a hostile environment for the growth of pathogenic microorganisms. The secreted acids also increases the peristalsis, which also helps to speed pathogens out from the intestines (Ballongue 1992; Biavati et al. 2000).
Traditional, i.e., one variable at-a-time (OVAT) method of bacterial growth optimization is not only time consuming but also neglects interactions of different variables, which affects the yield. Process optimization through statistical method is a technique in which changes or adjustments are made in a process to get better results (Myers and Montgomery 2002). There are several techniques for process optimization such as Response Surface Methodology (RSM), Artificial Neural Networks (ANN), Genetic Algorithms (GA), etc. In these engineering applications, a response of interest is usually influenced by several variables and the objective of the engineering applications is to find the variables that can optimize the response. RSM is a tool to study the optimal process parameters that produce a maximum, or minimum value of the response and represents the direct and interactive effects of the process parameters through two and three-dimensional plots (Gangadharan et al. 2008). ANN is computational model of nervous systems. Natural organisms, however, do not possess only nervous systems but also have genetic information stored in the nucleus of their cells (genotype). The nervous system is part of the phenotype, which is derived from this genotype through a process,
called development (Rajasekaran and
Vijaylakshmi 2004). Using the method of neural networks (NN), the relationship between a set of
independent variables X and the dependent
variables Y can be obtained. From the given pairs
of input X and output Y data, neural network
tools have been reported by several other authors (Nagarjun et al. 2005; Kumari et al. 2009; Lima et al. 2009; Negi and Banerjee, 2009; Usmiati and Marwati, 2009; Coelho et al. 2011; Meena et al. 2011; Meena et al. 2013).
This study developed the empirical model to
increase the cell growth of the mixed culture of B.
bifidum and L. acidophilus (1:1 ratio) by
optimizing the growth parameters such as temperature, pH, inoculum volume, incubation period and additional effect of different carbon and nitrogen sources employing RSM, ANN and GA.
MATERIALS AND METHODS
Micro-organisms and their growth conditions
Bifidum bifidum NCDC 255 and L. acidophilus
NCDC 14were obtained in freeze dried state from
National Collection of Dairy Cultures (NCDC), National Dairy Research institute, Karnal, Haryana, India. The methods used for the microbial culture activation and pellet extraction
was same as earlier reported (Meena et al. 2011;
Meena et al. 2013). Composition of the medium
used for the growth of mixed culture of B. bifidum
and L. acidophilus (1:1) contained (g/L) casein
peptone 10, yeast extract 5, sodium acetate 5,
Tween 80 1, MgSO4 0.2, MnSO4 0.05,K2HPO4 2
and itspH was maintained at 7.0. The growth of
the mixed culture was carried out in 250 mL
Erlenmeyer flasks each containing 50 mL growth
medium and maintained at 37 0C. The cell biomass
was determined by measuring the optical density (OD) of the medium after 24 h at 600 nm. Before measuring the OD, the liquid containing cells were centrifuged and washed with sterile distilled water for two times to remove the adhering medium constituents. All the solvents and reagents used in the present study were procured from Merck, Germany.
Experimental design
Selection of initial parameters
For the selection of initial parameters, ‘one variable at a time method’ was used. The different
variables, viz. temperature, pH, volume of
inoculum, age of inoculum and additional carbon and nitrogen sources were selected for the growth of mixed culture.
Empirical model development using RSM
In order to find the effect of different growth parameters on the predicted value of bacterial
growth Yp was obtained by conducting the
experiments on different combination of
independent variables (growth parameters), which was obtained from a standard experimental design. During the experiments, the response, or values of dependent variables obtained from each of the combinations of independent variables was measured. A mathematical relationship between the independent and dependent variables was developed. Using this model, the predicted value of response was find out within the domain of limiting values of independent variables. For the different growth parameters, it was desired to develop a polynomial model between the mixed culture growth and growth parameters to develop the following relationship between the coded values of independent variables, i.e., temperature (x1), pH (x2), inoculum volume (x3), inoculum age (x4), carbon sources (x5) and nitrogen sources (x6) and dependent variable (cell mass of mixed culture, Yp) as shown below.
Yp=bo+b1x1+b2x2+b3x3+b4x4+b5x5+b6x6+b7x1 2
+b8 x2
2 +b9x3
2 +b10x4
2 +b11x5
2 +b12x6
2
+b13x1x2+b14x1x3+b
15x1x4+b16x1x5+b17x1x6+b18x2x3+b19x2x4+b20x2x5+b2
1x2x6+b22x3x4+b23x3x5+b24x3x6+b25x4x5+b26x4x6+b27 x5x6 (Eq. 1) Where bo, b1, b2………etc. are the regression constants.
Experimental Modeling
Fractional factorial design
Fractional factorial design is a method by which the numbers of experiments are considerably reduced. This is used for the screening of independent variables, which have large effect on the dependent variables (Das 2005). Using two
levels (+1 and -1) factorial design, two values of l
and s were found out for all the experimental runs.
Here, the values of l and s for two scarifying
interactions were l1, s1, and l2, s2, respectively. With the help of factorial design, different s values were identified as (s1= 0, s2 =0), (s1= 0, s2 =1), (s1= 1, s2 =0), and (s1= 1, s2 =1). All the experiments
were conducted according to s1= 0 and s2 =0
design (Meena et al. 2011), during present investigation.
Optimization
Artificial neural network modeling
In this present investigation, a feed forward back
propagation neural network (Meena et al. 2011;
between the desired (predicted) response and the actual (experimental) response. The number of neurons in input layer, hidden layer and output layer of this neural network were kept as 6, 11 and 1, respectively. This ANN was first trained with
reported data of B. bifidum (Meena et al. 2011).
After training, it was able to predict the cell mass yield of the mixed culture accurately through error minimization that was compared with the predicted value of cell mass yield obtained from RSM (Meena et al. 2013).
Genetic Algorithms
In order to maximize the cell mass yield of the mixed culture, GA was applied to the developed
ANN based model (Meena et al. 2011; Meena et
al. 2013) by monitoring above mentioned six growth parameters. It was posed as the
minimization of problem associated with the optimization studies. Genetic optimization was continued till the maximum cell mass yield obtained.
Software used
For the proper execution of ANN and GA, MATLAB 7.0 was used to develop the empirical model.
RESULTS AND DISCUSSION
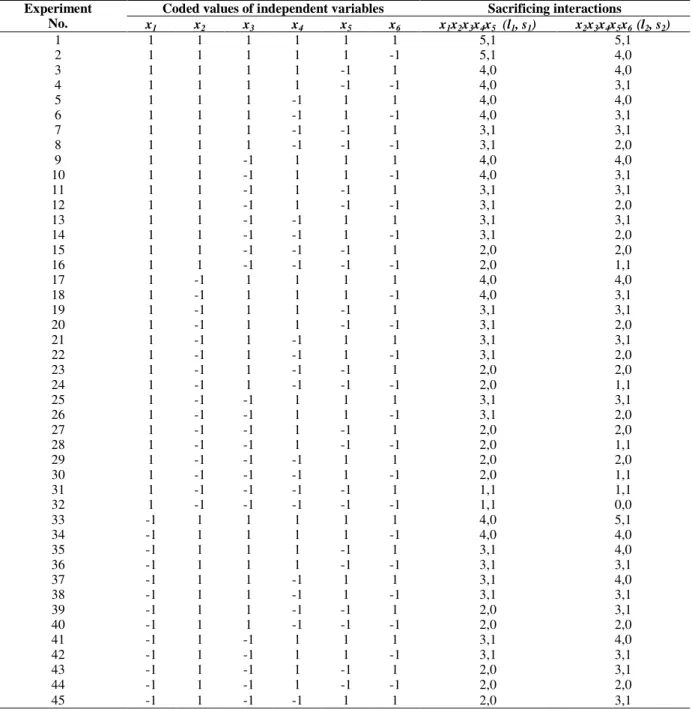
Selection of initial parameters
Different growth variables for mixed culture growth were selected by OVAT method and results showed in Figure 1 (A - F). All these parameters, their variation and optimum values are given in Table 1.
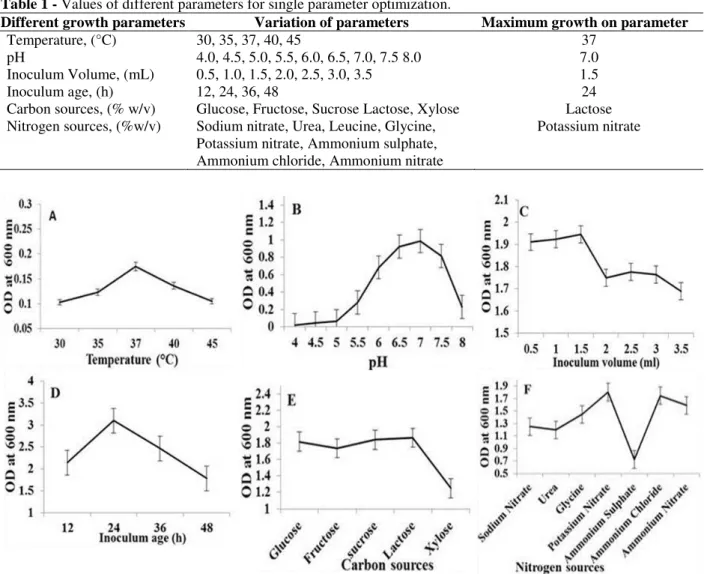
Table 1 - Values of different parameters for single parameter optimization.
Different growth parameters Variation of parameters Maximum growth on parameter
Temperature, (°C) 30, 35, 37, 40, 45 37
pH 4.0, 4.5, 5.0, 5.5, 6.0, 6.5, 7.0, 7.5 8.0 7.0
Inoculum Volume, (mL) 0.5, 1.0, 1.5, 2.0, 2.5, 3.0, 3.5 1.5
Inoculum age, (h) 12, 24, 36, 48 24
Carbon sources, (% w/v) Glucose, Fructose, Sucrose Lactose, Xylose Lactose Nitrogen sources, (%w/v) Sodium nitrate, Urea, Leucine, Glycine,
Potassium nitrate, Ammonium sulphate, Ammonium chloride, Ammonium nitrate
Potassium nitrate
Figure 1 - Selection of different parameters for mixed culture growth (A. Selection of initial temperature, B.
Empirical model development
From the initial parameter selection, the maximum and minimum values of six independent parameters for mixed culture were fixed as shown in Table 2. Then, a model was developed between
the coded values of independent variables (x1, x2,
x3, x4, x5 and x6) and dependent variable (Yp) by
conducting the experiments according to
Fractional Factorial design. All these combinations
are given in Table 3 with their corresponding l and
s values.Various combination of process variable
found at s1=0, s2=0 is shown in the Table 4 with
their experimental value (Ye) for growth of mixed
culture.
Table 2 - Limiting value of independent variables.
Parameters Maximum
value
Minimum value
Temperature, (0C) 45 30
pH 8.0 4.0
Inoculum volume, (mL) 3.5 0.5
Inoculum age, (h) 48 12
Carbon content, (%w/v) 42.06 30 Nitrogen content, (% w/v) 46.67 14
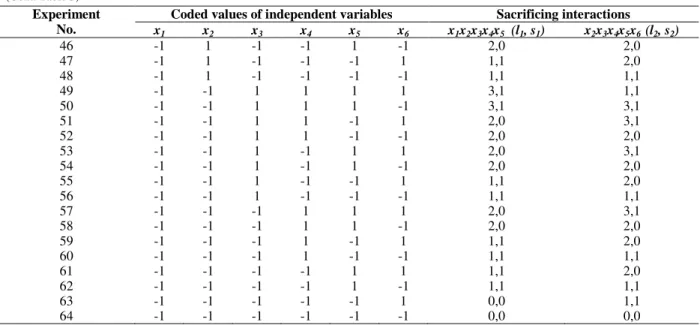
Table 3 - Values of l and s for various experimental runs with 6 independent variables using x1x2x3x4x5 and
x2x3x4x5x6 as sacrificing interactions.
Experiment No.
Coded values of independent variables Sacrificing interactions
x1 x2 x3 x4 x5 x6 x1x2x3x4x5 (l1, s1) x2x3x4x5x6 (l2, s2)
1 1 1 1 1 1 1 5,1 5,1
2 1 1 1 1 1 -1 5,1 4,0
3 1 1 1 1 -1 1 4,0 4,0
4 1 1 1 1 -1 -1 4,0 3,1
5 1 1 1 -1 1 1 4,0 4,0
6 1 1 1 -1 1 -1 4,0 3,1
7 1 1 1 -1 -1 1 3,1 3,1
8 1 1 1 -1 -1 -1 3,1 2,0
9 1 1 -1 1 1 1 4,0 4,0
10 1 1 -1 1 1 -1 4,0 3,1
11 1 1 -1 1 -1 1 3,1 3,1
12 1 1 -1 1 -1 -1 3,1 2,0
13 1 1 -1 -1 1 1 3,1 3,1
14 1 1 -1 -1 1 -1 3,1 2,0
15 1 1 -1 -1 -1 1 2,0 2,0
16 1 1 -1 -1 -1 -1 2,0 1,1
17 1 -1 1 1 1 1 4,0 4,0
18 1 -1 1 1 1 -1 4,0 3,1
19 1 -1 1 1 -1 1 3,1 3,1
20 1 -1 1 1 -1 -1 3,1 2,0
21 1 -1 1 -1 1 1 3,1 3,1
22 1 -1 1 -1 1 -1 3,1 2,0
23 1 -1 1 -1 -1 1 2,0 2,0
24 1 -1 1 -1 -1 -1 2,0 1,1
25 1 -1 -1 1 1 1 3,1 3,1
26 1 -1 -1 1 1 -1 3,1 2,0
27 1 -1 -1 1 -1 1 2,0 2,0
28 1 -1 -1 1 -1 -1 2,0 1,1
29 1 -1 -1 -1 1 1 2,0 2,0
30 1 -1 -1 -1 1 -1 2,0 1,1
31 1 -1 -1 -1 -1 1 1,1 1,1
32 1 -1 -1 -1 -1 -1 1,1 0,0
33 -1 1 1 1 1 1 4,0 5,1
34 -1 1 1 1 1 -1 4,0 4,0
35 -1 1 1 1 -1 1 3,1 4,0
36 -1 1 1 1 -1 -1 3,1 3,1
37 -1 1 1 -1 1 1 3,1 4,0
38 -1 1 1 -1 1 -1 3,1 3,1
39 -1 1 1 -1 -1 1 2,0 3,1
40 -1 1 1 -1 -1 -1 2,0 2,0
41 -1 1 -1 1 1 1 3,1 4,0
42 -1 1 -1 1 1 -1 3,1 3,1
43 -1 1 -1 1 -1 1 2,0 3,1
44 -1 1 -1 1 -1 -1 2,0 2,0
45 -1 1 -1 -1 1 1 2,0 3,1
(Cont. Table 3)
Experiment No.
Coded values of independent variables Sacrificing interactions
x1 x2 x3 x4 x5 x6 x1x2x3x4x5 (l1, s1) x2x3x4x5x6 (l2, s2)
46 -1 1 -1 -1 1 -1 2,0 2,0
47 -1 1 -1 -1 -1 1 1,1 2,0
48 -1 1 -1 -1 -1 -1 1,1 1,1
49 -1 -1 1 1 1 1 3,1 1,1
50 -1 -1 1 1 1 -1 3,1 3,1
51 -1 -1 1 1 -1 1 2,0 3,1
52 -1 -1 1 1 -1 -1 2,0 2,0
53 -1 -1 1 -1 1 1 2,0 3,1
54 -1 -1 1 -1 1 -1 2,0 2,0
55 -1 -1 1 -1 -1 1 1,1 2,0
56 -1 -1 1 -1 -1 -1 1,1 1,1
57 -1 -1 -1 1 1 1 2,0 3,1
58 -1 -1 -1 1 1 -1 2,0 2,0
59 -1 -1 -1 1 -1 1 1,1 2,0
60 -1 -1 -1 1 -1 -1 1,1 1,1
61 -1 -1 -1 -1 1 1 1,1 2,0
62 -1 -1 -1 -1 1 -1 1,1 1,1
63 -1 -1 -1 -1 -1 1 0,0 1,1
64 -1 -1 -1 -1 -1 -1 0,0 0,0
Table 4 - Experimental design for mixed culture of B. bifidum and L. acidophilus growth with experimental (Ye),
RSM and ANN predicted values of mixed culture cell biomass. Run
order
Temp.
0
C (x1)
pH (x2)
Inoculum volume (mL) (x3)
Inoculum age (h) (x4)
Carbon content % w/v (x5)
Nitrogen content % w/v (x6)
Experimental value (Ye),
OD600
RSM predicted values (Yp )
ANN Predicted values Yp
1 40.15 6.86 2.53 36.36 41.37 24.57 0.789 0.7412 0.828
2 40.15 6.86 2.53 23.64 40.61 24.57 0.2 0.3088 0.222
3 40.15 6.86 1.47 36.36 40.61 24.57 0.136 0.3512 0.1519
4 40.15 6.86 1.47 23.64 41.37 24.57 0.99 0.9081 1.022
5 40.15 5.63 2.53 36.36 40.61 24.57 0.345 0.4992 0.3777
6 40.15 5.63 2.53 23.64 41.37 24.57 0.845 0.7069 0.883
7 40.15 5.63 1.47 36.36 41.37 24.57 0.642 0.6086 0.6839
8 40.15 5.63 1.47 23.64 40.61 24.57 0.406 0.5267 0.443
9 34.85 6.86 2.53 36.36 40.61 36.11 0.746 0.85 0.787
10 34.85 6.86 2.53 23.64 41.37 36.11 0.985 0.7919 1.015
11 34.85 6.86 1.47 36.36 41.37 36.11 0.625 0.5383 0.666
12 34.85 6.86 1.47 23.64 40.61 36.11 0.825 0.8949 0.863
13 34.85 5.63 2.53 36.36 41.37 36.11 1.12 0.9772 1.142
14 34.85 5.63 2.53 23.64 40.61 36.11 0.926 0.9373 0.961
15 34.85 5.63 1.47 36.36 40.61 36.11 0.923 1.039 0.959
16 34.85 5.63 1.47 23.64 41.37 36.11 1.09 0.9137 1.114
17 37.5 6.25 2 30 40.99 30.54 0.708 0.75 0.72
18 37.5 6.25 2 30 40.99 30.54 0.619 0.67 0.563
19 37.5 6.25 2 30 40.99 30.54 0.758 0.8616 0.959
20 37.5 6.25 2 30 40.99 30.54 0.682 0.8616 0.959
21 37.5 6.25 2 30 40.99 30.54 0.912 0.8616 0.959
22 37.5 6.25 2 30 40.99 30.54 0.912 0.8616 0.959
23 37.5 6.25 2 30 40.99 30.54 0.98 0.8616 0.959
24 37.5 6.25 2 30 40.99 30.54 1.07 0.8616 0.959
25 37.5 6.25 2 30 40.99 30.54 0.995 0.8616 0.959
26 37.5 6.25 2 30 40.99 30.54 0.98 0.8616 0.959
27 45 6.25 2 30 40.99 30.34 0.953 0.8478 0.985
28 30 6.25 2 30 40.99 30.34 0.945 1.0502 0.979
29 37.5 8 2 30 40.99 30.34 0.001 0.067 0.003
30 37.5 4.5 2 30 40.99 30.34 0.27 0.3013 0.296
31 37.5 6.25 3.5 30 40.99 30.34 1 1.0507 1.03
32 37.5 6.25 0.5 30 40.99 30.34 1.09 1.0393 1.115
33 37.5 6.25 2 48 40.99 30.34 1.36 1.2615 1.335
34 37.5 6.25 2 12 40.99 30.34 1.3 1.3985 1.304
35 37.5 6.25 2 30 42.06 30.34 0.892 1.2116 0.93
36 37.5 6.25 2 30 39.92 30.34 1.11 0.9364 1.13
37 37.5 6.25 2 30 40.99 46.67 1.02 1.1252 1.05
RSM is mainly used for the optimization of growth conditions, reaction parameter, or
scaling-up the mixed culture growth conditions (Sen and
Babu 2005). Experimental data were fitted to the full quadratic equation and the design matrix and the fitness of each term was analyzed by the means of ANOVA (Kumari et al. 2008). Figure 2 shows
the corresponding model coefficients (R2 0.7949)
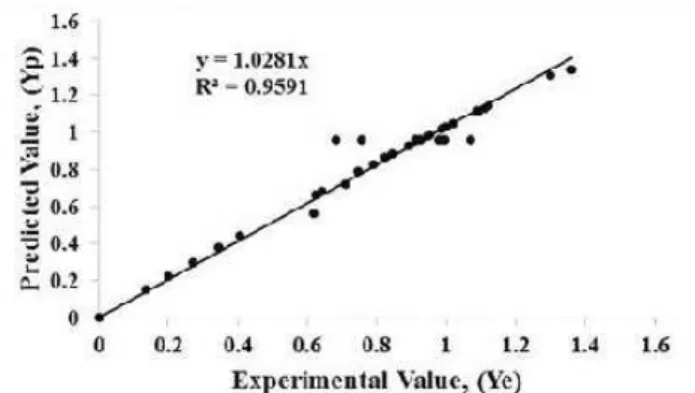
together with the regression coefficient of determination. This was a measure of how well the regression model could be made to fit the raw data. A self-organizing feature map network was used to
predict the growth condition parameters using each independent variable as input layer and growth of mixed culture as response. The least Mean Squared Error (MSE) value and a good prediction of the outputs of both training and validation sets were obtained with four neurons in
the hidden layer (Dutta et al. 2004). The R2 value
between the actual and estimated responses was determined as 0.9591 (Fig. 3). In ANN modeling, the replicates at center point did not improve the prediction capability of the network because of the similar inputs.
Figure 2 - Determination of regression equation
coefficient R2 for mixed culture cell biomass between experimental value (Ye) and RSM predicted values (Yp).
Figure 3 - Determination of regression equation
coefficient R2 for the mixed culture cell biomass between experimental value (Ye) and ANN predicted values (Yp).
Using MATLAB 7.0, the constants of regression equation and predicted value of dependent variable (OD) were found out. The obtained model for the
mixed culturewas as given below.
Yp = 0.8578 - 0.1016x1 - 0.1506 x2 + 0.0056x3 -
0.0684x4+ 0.1382x5 + 0.3032x6 + 0.0912x1
2 -
0.7072x2
2
+ 0.1872x3
2
+ 0.4722x4
2
+ 0.2162x5
2
-0.0357x6
2
+ 0.3180x1x2+ 0.0676x1x3 - 0.2590 x1x4 - 0.9292x1x5 + 1.3050x1x6 - 0.0168x2x3 - 0.2328x2x4
+ 0.1855x2x5 - 0.0645x2x6 + 0.5151x3x4 +
0.2316x3x5 + 0.2224x3x6 - 0.2625x4x5 - .2625x4x6 -1.8158x5x6 (Eq. 2)
The predicted value of independent variable and corresponding experimental value for the mixed
cultureis shown in the Table 5. Genetic algorithms
were applied on the data obtained from neural network using MATLAB7.0, which yielded similar results as of ANN but in very short time. Table 5 showed the optimum value, or combination of different process parameters on
which the bacterial growth measured by optical density (OD) was highest for the mixed culture.
Table 5 - ANN and GA optimized values of the process
parameters for maximum cell biomass of the mixed culture of B. bifidum and L. acidophilus.
In the present study, RSM, ANN and GA optimization methodologies were used to predict
the growth model of the mixed culture of B.
bifidum and L. acidophilus (1:1)and optimized the
growth parameters. Both the models were capable to predict the combination of independent variables for maximum cell biomass of mixed
Process parameters Optimum values
Temperature, (°C) 38
pH 6.5
culture but ANN showing more accuracy in estimation.
Regression coefficient (R2) of ANN and RSM
reflected that ANN was better than RSM. RSM was useful in getting insight information (e.g., interactions between different components) of the system directly, but ANN was also equally useful in the sensitivity analysis. ANN showed better modeling technique for data set showing nonlinear relationship over RSM. Thus, ANN could be a very powerful and flexible tool well suited for the development of empirical growth model due to an implicit corrective action arising from the training methodology and the associated estimation procedure. GA optimization results were similar to ANN but delivered within shortest use of computer time as compared to RSM and ANN. Present results showed that the higher cell mass
yield of mixed culture was observed at 38°C, pH
6.5, inoculum volume and age 1.6 mL and 30 h, respectively, carbon content 42.31% (w/v) and nitrogen content (14.20%, w/v). This combination of independent variables could be of significant importance to starter culture producing industries
in order to scale- up the production of B. bifidum
and L. acidophilus on commercial scale more
economically due to high cell mass yield.
REFERENCES
Amara AA, Shibal A. Role of Probiotics in health improvement, infection control and disease treatment and management-review. Saudi Pharmac J. 2013; doi: 10.1016/j.jsps.2013.07.001
Aureli P, Capurso L, Castellazzi AM, Clerici M, Giovannini M, Morelli L. et al. Probiotics and health: An evidence-based review. Pharmacol Res. 2011; 63: 366-376.
Biavati B, Vescovo M, Torriabi S, Bottazzi V. Bifidobacteria: history, ecology, physiology and applications. Analyt Microbiol. 2000; 50:117-131. Coelho LF, Lima CJBD, Rodovalho CM, Bernardo MP,
Contiero J. Lactic acid production by new Lactobacillus plantarum LMISM6 grown in molasses: optimization of medium composition. Braz J Chem Eng. 2011; 28: 27-36.
Das H. Empirical model development. Hand Book of Food Processing Operations Analysis. 1st ed. New Delhi: Asian Book Private Limited, 2005, 357-382 p.
Dutta JR, Dutta PK, Banerjee R. Optimization of culture parameters for extracellular protease production from a newly isolated Pseudomonas sp. using response surface and artificial neural network models. Process Biochem. 2004; 39: 2193-2198. Gangadharan D, Sivaramakrishnan S, Nampoothiri
KM, Sukumaran RK, Pandey A. Response surface methodology for the optimization of alpha amylase production by Bacillus amyloliquefaciens. Bioresource Technol. 2008; 99: 4597-4602.
Ganguly NK, Bhattacharya SK, Nair GB, Ramakrishna BS, Sachdev HPS, Batish VK. et al. ICMR-DBT guidelines for evaluation of probiotics in food. Indian J Med Res. 2011; 134: 22–25.
Hemaiswarya S, Raja R, Ravikumar R, Carvalho IS.
Mechanism of Action of Probiotics. Braz Arch Biol Technol. 2013; 56: 113-119.
Kumari A, Mahapatra P, Banerjee R. Statistical optimization of culture conditions by response surface methodology for synthesis of lipase with Enterobacter aerogenes. Braz Arch Biol Technol. 2009; 52: 1349-1356.
Kumari KS, Babu IS, Rao GH. Process optimization for citric acid production from raw glycerol using response surface methodology, Indian J Biotech. 2008; 7: 496-501.
Lima CJBD, Coelho LF, Blanco KC, Contiero J. Response surface optimization of D (-)-lactic acid production by Lactobacillus SMI8 using corn steep liquor and yeast autolysate as an alternative nitrogen source. Afr J Biotechnol. 2009; 8: 5842-5846.
Meena GS, Gupta S, Majumdar GC, Banerjee R. Growth Characteristics Modeling of Bifidobacterium bifidum Using RSM and ANN. Braz Arch Biol Technol. 2011; 54: 1357-1366.
Meena GS, Kumar N, Majumdar GC, Banerjee R, Meena P K, Yadav V. Growth Characteristics Modeling of Lactobacillus acidophillus Using RSM and ANN.Braz Arch Biol Technol. 2014; 57: 15-22. Mitsuoka T. Bifidobacteria and their role in human
health. J Ind Microbiol. 1990; 6: 263-268.
Myers RM, Montgomery DC. Response Surface Methodology: Process and Product Optimization Using Designed Experiments. 2nd ed. Hoboken: Wiley-Interscience, 2002.
Nagarjun PA, Rao RS, Rajesham S, Rao LV. Optimization of Lactic Acid Production in SSF by Lactobacillus amylovorus NRRL B-4542 Using Taguchi Methodology. J Microbiol. 2005; 43: 38-43. Negi S, Banerjee R. Optimization of extraction and
Rajasekaran S, Vijaylakshmi PGS. Neural Networks Fuzzy Logic and Genetic Algorithms. 1st ed. New Delhi: Prentice Hall of India, 2004.
Sen R, Babu KS. Modeling and optimization of the process conditions for biomass production and sporulation of a probiotic culture. Process Biochem. 2005; 40: 2531-2538.
Shah NP. Functional Cultures and Health Benefits. Int Dairy J. 2007; 17: 1262-1277.
Singh K, Kallali B, Kumar A, Thaker V. Probiotics: A review. Asian Pac J Trop Biomed. 2011; S287-S290.
Usmiati S, Marwati T. Selection and optimization process of bacteriocin production from Lactobacillus sp. Indones J Agric. 2009; 2: 82-92.
Ziemer CJ, Gibson GR. An overview of Probiotics, Prebiotics and Symbiotic in the Functional Food Concept: Perspectives and Future Strategies. Int Dairy J. 1998; 8: 473-479.