Acta Scientiarum
http://www.uem.br/acta ISSN printed: 1806-2636 ISSN on-line: 1807-8672
Doi: 10.4025/actascianimsci.v36i4.24021
Acta Scientiarum. Animal Sciences Maringá, v. 36, n. 4, p. 349-356, Oct.-Dec., 2014
Defoliation patterns and tillering dynamics in Italian ryegrass under
different herbage allowances
Larissa Arnhold Graminho*, Marta Gomes da Rocha, Luciana Pötter, Aline Tatiane Nunes da Rosa, Tuani Lopes Bergoli and Marcela Machado
Universidade Federal de Santa Maria, Avenida Roraima, 1000, 97105-900, Santa Maria, Rio Grande do Sul, Brazil. *Author for correspondence. E-mail: [email protected]
ABSTRACT. This work was carried out in order to generate information on the tillering process and to contribute for the understanding of the defoliation processon Italian ryegrass (Lolium multiflorum Lam.) grazed by lambs under different herbage allowances: 6, 8 and 12 kg of dry matter per 100 kg of animal live weight per day. The grazing method was intermittent. The experimental design was completely randomized following a repeated measure arrangement, with three treatments and two area replications. The intensity of defoliation is greater at 6 and 9% herbage allowances. The defoliation interval is higher at 12% herbage allowance, intermediate at 9% and lower at 6%. The rates of tiller emergence, survival and death, stability index the tiller population are similar for the different herbage allowances and differ according to the phenological stage of ryegrass. Structural changes caused by canopy management with low herbage allowance and/or due to the advance in developmental stage of ryegrass alter defoliation strategies, with more intense and frequent grazing.
Keywords: accumulated thermal sum, intermittent grazing, defoliation intensity, defoliation interval, lambs, Lolium multiflorum.
Padrões de desfolhação e da dinâmica de perfilhamento em azevém sob diferentes ofertas
de forragem
RESUMO. Este trabalho foi conduzido com o objetivo de gerar informações sobre o processo de perfilhamento e contribuir para com o entendimento do processo de desfolhação do azevém (Lolium multiflorum Lam.) utilizado por cordeiras, submetidas a diferentes ofertas de forragem: 6; 8 e 12 kg de MS 100-1 kg de peso corporal. O método de pastejo foi intermitente. O delineamento experimental foi
inteiramente casualizado, com medidas repetidas no tempo, três tratamentos e duas repetições de área. A intensidade de desfolhação é superior nas ofertas de forragem 6 e 9%. O intervalo entre desfolhações foi superior na oferta de forragem 12%, intermediária na oferta 9% e inferior na oferta 6%. As taxas de aparecimento, sobrevivência e mortalidade de perfilhos e o índice de estabilidade da população de perfilhos são similares nas ofertas de forragem e variam nos estádios fenológicos do azevém. Mudanças estruturais do dossel causadas pelo manejo com baixas ofertas de forragem e/ou pelo avanço do estádio fenológico do azevém alteram as estratégias de desfolhação, com pastejo realizado de forma mais intensa e frequente.
Palavras-chave: soma térmica, pastejo intermitente, intensidade de desfolhação, intervalo entre desfolhações, cordeiras,
Loliummultiflorum.
Introduction
In recent years, studies on forage crops have sought to relate plant response to management, based on criteria associated with abundant biomass, such as herbage allowance. This allowance plays an essential role in animal performance and in the productive response of pastures; depending on its value, it can influence the defoliation process by altering canopy structure. According to Lemaire et al. (2009), the amount of herbage removed results from the growth rate of new plant tissue and the efficiency of the harvesting process.
Defoliation patterns can be studied by evaluating the intensity and frequency of defoliation in individual tillers (SANTOS et al., 2013), and are essential to understanding the effect of grazing on plant and animal performance. Knowledge of the defoliation process allows management with greater harvesting opportunities and improved efficiency of produced herbage.
A b t d f h d f g b p p F 350 Acta Scientiarum (2010a), while removal from under intermi intensity was biomass remo the effect of under interm defoliation int frequency w intensity (52% how differen defoliation pr support highe for this forage One of t grasses, whic cutting or gra leaf tissue t remaining me (ALEXANDR been carried o process in rye
The objec information on as well as cont process under d
Material and m
The exper Science Depa Santa Maria Depression reg
Figure 1. Rainfal Santa Maria, Rio G
m. Animal Scienc
e evaluating th m ryegrass inter ittent grazing,
not influenc oval. Machado two intensiti mittent grazin tensity was sim was greater a
% biomass re ntial herbage
rocess of ryeg er yields and g
species. the main ch
h guarantees azing, is the r through leaf eristems or ax RINO et al., 2
out in Brazil egrass (BART ctive of the th
n the tillering p tribute to und different herba
methods
riment was ca artment of the (UFSM), lo gion of Rio Gra
ll (mm), maximum Grande do Sul Sta
ces
he intensities rcropped with observed that ced by the in o et al. (2011) ies of biomas ng, and obse milar whereas at the ‘High emoval). Und allowances grass can con greater efficie
haracteristics their persist regeneration c emergence xillary shoots b
2004). Few st to evaluate th H NETO et a his work is t process of Italia erstanding the age allowances.
arried out at t e Federal Un ocated in th ande do Sul stat
m temperature, m ate, 2012.
of biomass h black oat, defoliation ntensity of ) evaluated ss removal erved that defoliation h’ removal derstanding affect the ntribute to
ncy of use
of forage tence after capacity of from the by tillering udies have he tillering al., 2013). to generate an ryegrass, defoliation he Animal niversity of he Central te, Brazil, minimum tempera M featuring so for the ex obtained fro
The exp divided int experimenta The pasture Lam.) cv. ‘C broadcast see 20-20 (N-P-(100 kg of n four applicat September 1 The inte and three h and 12 kg o weight (LW phenologica 24-August 6 Pre-flowerin Flowering determine th the accumu degree-days emergence (CONFOR The plot grazing cycl occupation next occup equation: T average tem value regard cold-season
ature and average
Maringá, v. 36, n.
oil classified as xperimental p om Inmet (201 perimental area
to six plots, l units, plus an e of Italian ry
omum’ was im eding. At sowi -K) fertilizer w nitrogen per he tions, on June
5, 2012. ermittent graz herbage allowa of dry matter W). Grazing to al stages of ry 6); Vegetative 2
ng (Septemb (October 5 he interval bet lated thermal equivalent to
of two RTIN et al., 20
t occupation p e was consider
plus the inte pation. TS w
S = Σ (Dat - 5
mperature for th ded as base te species.
temperature (°C)
G
. 4, p. 349-356, O
s Paleaudalf. W period (Figu 12).
a consisted of which repr n adjacent area o
ryegrass (Lolium
mplemented in ing time, 200 k were used. Ure
ectare), as topd e 6, July 7, Au
zing method w ances were ev
(DM) per 10 ook place at t yegrass: Vegeta
2 (August 7-S ber 4-Octob -21). The tween grazing sum (TS) of o the TS nece
leaves o
10b).
eriod was 12 d red to be the p rval until the was calculated
5°C), in which he period (°C) emperature fo
) during the expe
Graminho et al.
Oct.-Dec., 2014
Weather data re 1) were
f 0.6 hectare, resented the of 0.4 hectare.
m multiflorum
May 2012, by
kg ha-1 of
05-ea was applied dressing, over ugust 18, and
was adopted, valuated: 6, 9 00 kg of live he following ative 1 (June eptember 3); er 4) and criterion to g sessions was
250 growing essary for the of ryegrass
days, and one period of plot start of the d using the h Dat = daily
); and 5°C = or growth of
Tillering of Italian ryegrass 351
Acta Scientiarum. Animal Sciences Maringá, v. 36, n. 4, p. 349-356, Oct.-Dec., 2014
The experimental animals were Suffolk female lambs, at eight months old and average weight of 43 ± 4.56 kg. The lambs had free access to water and mineral salt. Three test lambs were used per plot and a variable number of put-and-take animals were used to adjust the intended allowance.
Herbage mass was determined through the direct visual estimate method with double sampling, at the start and end of each grazing period. Samples obtained from the sections provided the levels of dry matter and the share of different botanical and structural components of the pasture, at the start and end of each period. The samples were separated manually into leaf blade, stem and inflorescence of ryegrass and other species. Later, the material was dried in a forced-air oven at 55ºC for 72 hours and weighed. The leaf:stem ratio was determined from the rate of leaves and stems, at the start and end of each grazing period.
The daily herbage accumulation rate was determined from the following formula:
DAR = (MF1(i) – MF2(i-1)) D-1
which:
DAR =daily herbage accumulation rate;
MF1 = pre-grazing herbage mass of grazing cycle ‘i’;
MF2 = post-grazing herbage mass of grazing cycle ‘i – 1’,
D = number of days in the interval period between grazing sessions.
The stocking rate was calculated using formula:
TL = ((PCt * DP) + (PCr *D)) DP-1
which:
TL = instant stocking rate (kg ha-1 of LW);
PCt = live weight of test lambs (kg ha-1);
PCr = live weight of put-and-take lambs (kg ha-1);
DP = days in the period of pasture occupation; D = number of days put-and-take lambs remained in the pasture.
Herbage allowance was calculated using formula:
OF = ((MF n-1 + DAR) TL-1)*100
which:
OF = herbage allowance (%);
MF = mean herbage mass (kg ha-1 of DM) =
[(MF initial + MF final) 2-1 ];
N = number of days in the grazing period (days);
DAR = daily herbage accumulation rate (kg ha-1
day-1 of DM);
TL = stocking rate of grazing cycle (kg ha-1 of
LW). The allowance of green leaf blades was
obtained by multiplying the herbage allowance by the mean percentage of leaf blades in MF.
In each plot, 35 tillers were marked with colored rings, distributed in seven locations, and monitored for canopy and pseudostem height. After each grazing cycle, the process of tiller marking was redone to include new individuals, in order to preserve the representativeness of the population. The length of leaf blades (expanded, in expansion and senescent) in these tillers were measured daily during the grazing periods and, using these measurements, it was possible to calculate the mean length of leaf blades, the intensity and defoliation frequency of leaf blades.
Defoliation intensity (%) was measured using the formula: defoliation intensity = ((CLFi-CLFf)
CLFi-1)*100, in which CLFi and CLFf are,
respectively, the initial length and final length of the leaf blade. To estimate defoliation frequency (number of defoliations/blades/day) in marked tillers, senescent or damaged leaf blades were identified with correction fluid the day before the animal entered the pastured. Defoliation frequency was calculated from the formula: defoliation frequency = number of contacts during grazing days / (number of possible contacts * duration of the evaluation). The time interval between two successive defoliations was determined by the formula: time interval = 1 /frequency.
To evaluate the population pattern of tillering,
three PVC rings 10 cm in diameter (0.0078 m2) were
used, fixed on the soil in each experimental unit. The demography of tillering was based on identifying and counting remaining live tillers and the emergence of new tillers. The first tiller marking took place at the start of the first grazing cycle, when all tillers of ryegrass within the area demarcated by the rings were marked with plastic wire of the same color, and named as the first generation of tillers (G1). Eighteen days after the first marking, live tillers from the first generation were recounted and new tillers were marked using plastic wire of a different color, and named second generation of tillers (G2) and, thus successively, until the end of the usage period of ryegrass.
The study calculated the rates of tiller emergence (TAP), mortality (TMP) and survival (TSP). The stability index (IESP) of the population of tillers was calculated as per Bahmani et al. (2003), in which: IESP = TSP*(1 + TAP). Site occupation, which measures the relationship between the emergence of leaves and the occupation of leaf shoots to form tillers, was calculated by dividing the tiller emergence rate by the rate of leaf blade emergence.
352 Graminho et al.
Acta Scientiarum. Animal Sciences Maringá, v. 36, n. 4, p. 349-356, Oct.-Dec., 2014
during the grazing cycles by counting live tillers, at
three fixed areas of 0.0625 m2 per plot, identified
with stakes. To determine mass per tiller (g of DM
tiller-1), samples were cut at three areas similar to
those used to evaluate tiller population density. The number of tillers in these samples was quantified; later, those samples were dried and weighed. Dry mass was divided by the number of tillers in the sample.
The experimental design experimental was entirely randomized, with repeated measurements over time, three treatments and two area replications. Analysis of variance was carried out using the ‘Mixed’ procedure in SAS (2002-2005) version 9.2. A structure selection test was used, following the Bayesian information criterion (BIC), to determine the model that best represented the data. Whenever differences were observed, the averages were compared using the ‘lsmeans’ procedure. The interaction between treatments and phenological stages was unfolded whenever it was significant at 10% probability, and variable responses were modeled using a polynomial function up to the third order. In the regression analysis, models were chosen based on the significance of the linear and quadratic coefficients, using Student’s t-test, at 10% probability. The variables were also subjected to Pearson’s linear correlation analysis.
Results and discussion
For the predicted values of 12, 9, and 6 kg of DM
100-1 kg of live weight (LW), the observed herbage
allowances were 12.6, 8.8 and 6.6 kg of DM 100-1 kg
of live weight (LW), respectively.
There was no interaction between herbage allowance and phenological stage for the defoliation intensity of leaf blades (p = 0.3225). There was a difference between herbage allowances for defoliation intensity (p = 0.0544). At herbage allowances of 6 and 9%, as defoliation intensities were similar, averaging 70.8%, which was 22.7% greater than the 54.7% intensity observed at 12% allowance. The defoliation intensity of leaf blades was positively correlated to instant stocking rate (r = 0.67; p = 0.0005) and negatively correlated to average leaf blade length (r = - 0.77; p < 0.0001) and com a canopy height (r = - 0.84; p < 0.0001).
Defoliation intensity varied according to allowance, whereas Lemaire and Agnusdei (2000) observed constant defoliation intensity of 50-55%
for grass species from genus Lolium sp. According to
those authors, this constant defoliation intensity could be attributed to an adjustment in bite depth to the average leaf blade length. In ryegrass, under different herbage allowances, this adjustment may not have occurred due to the fact that defoliation
intensity fit the negative linear regression model
because of leaf blade length (Ŷ = 94.8 - 4.20x; r2 =
0.60; p < 0.0001). According to this regression, a one-cm increase in leaf blade length caused a 4.20% reduction in defoliation intensity. Thus, the lower defoliation intensity at 12% allowance is accompanied by greater leaf blade length and taller canopy height (Table 1).
Defoliation intensity was greater at the pre-flowering stage (72.6%), when compared to the Vegetative 1 and Flowering stages (60.5%) and did not differ from Vegetative stage 2 (68.8%). Vegetative stage 1 had greater leaf blade length, higher final leaf:stem ratio and tiller population density, and lower stocking rate (Table 1), which provided animals greater opportunity to select leaf blades, resulting in low defoliation intensity. At Vegetative stage 2, structural changes in the canopy – such as lower height, tiller population density and final leaf:stem ratio (Table 1) – caused lambs to develop grazing strategies that did not differentiate this intensity from those observed at the other stages. According to Jochins et al. (2010), whenever the entire diet of animals consists of pasture, alterations in herbage availability result in changes to certain components of intake behavior, such as bite rate and grazing time. As such, these changes can affect defoliation intensity.
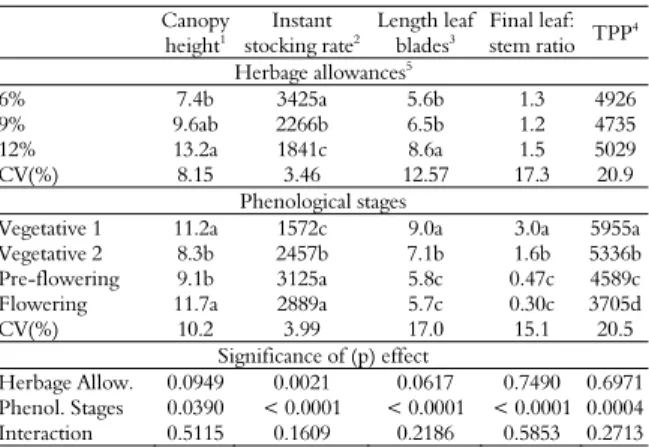
Table 1. Canopy height, instant stocking rate, leaf blade length, final leaf:stem ratio and tiller population density of Italian ryegrass managed under different herbage allowances and phenological stages.
Canopy
height1
Instant
stocking rate2
Length leaf
blades3
Final leaf:
stem ratio TPP
4
Herbage allowances5
6% 7.4b 3425a 5.6b 1.3 4926
9% 9.6ab 2266b 6.5b 1.2 4735
12% 13.2a 1841c 8.6a 1.5 5029
CV(%) 8.15 3.46 12.57 17.3 20.9
Phenological stages
Vegetative 1 11.2a 1572c 9.0a 3.0a 5955a
Vegetative 2 8.3b 2457b 7.1b 1.6b 5336b
Pre-flowering 9.1b 3125a 5.8c 0.47c 4589c
Flowering 11.7a 2889a 5.7c 0.30c 3705d
CV(%) 10.2 3.99 17.0 15.1 20.5
Significance of (p) effect
Herbage Allow. 0.0949 0.0021 0.0617 0.7490 0.6971
Phenol. Stages 0.0390 < 0.0001 < 0.0001 < 0.0001 0.0004
Interaction 0.5115 0.1609 0.2186 0.5853 0.2713
Values followed by letters, in the columns, differ from one another by the lsmeans test at 10% significance; 1canopy height (cm); 2instant stocking rate (kg of LW ha-1); 3leaf blade
length (cm); 4tiller population density (tillers m-2); 5Herbage allowances: 6, 9, or 12 kg
DM 100-1
kg LW.
Tillering Acta Sci cause perenne, sheep/h intensit stockin Def stage, e leaf:stem those o (Table height not hav their int in the d
The allowan between found between 1.50, an allowan differed The indicate total are and 12% by the a it is ca 116.2, 9 and defolia stocking
Figure 2
phenolog
g of Italian ryegr
entiarum. Anima
greater defol , managed with hectare, Hodgs ties ranging ng rate and 67%
foliation intens even though m ratio and le observed durin 1). During th and lower tille ve able to adju
take of leaf blad diet.
ere was no nce and phen
n defoliations between herb n defoliations ( nd 2.01 days un nces of 6, 9 an d from one ano e intervals o e that lambs gr
ea daily, when %, respectively. average numbe alculated that
143.7, and 16 12%, respec tions was ne g rate (r = - 0.7
2. Rates of tiller e gical stages. Differ
rass
al Sciences
liation intens h stocking rate son (1990) ob
between 13% % at the highes
sity was lower the instant st eaf blade lengt ng the stage P his stage, due er density (Tab
ust intake beh de, given the la
interaction nological stage
(p = 0.7258). bage allowance (p = 0.0076), w ntil returning t
nd 12%, respe other.
observed betw razed 84.0, 66.7 n subjected to
. By dividing th er of lambs dur each lamb gr
65.8 m2 at the
ctively. The i egatively corr
79; p = 0.0001)
emergence, surviv rent letters indicat
sities. In Lol
es of 29, 77 and served defolia % at the low st stocking rate
in the Flowe tocking rate, f th were simila Pre-flowering s to greater sw ble 1), lambs havior to main arger share of st
between herb for the inte . A difference s for the inte with values of 1 o the same tille ectively, and th
ween defoliat 7 and 49.7% of allowances of he area grazed d
ring pasture us razed daily o e allowances o interval betw elated to ins ).
val and mortality te that averages dif
lium d 91 ation west e. ering final ar to stage ward may ntain tems bage erval was erval 1.19, er at hese tions f the 6, 9 daily sage, over of 6, ween tant T allow graze each T (1.76 simil and l interv was interv corre 0.018 stage stages such and chang proce result durin lamb the sa T allow any allow survi the ti T betwe averag ryegr
(%) and stability ffer from one ano
Maringá,
Thus, the high wance, resulted
ed area and, co lamb to graze. The interval b 6 days) in Ve ar for the Pre lower than th val between d
similar to the val between elated to final 88; Table 1). 1 and 2 to t s de caused s as lower final tiller popula ges, in additi ess, may have r
t, in order t ng the Pre-fl s altered their ame leaves ove There was no wance and ph
difference wances (p > 0
ival and mort iller populatio The tiller em
een phenologic ging 89.3%. T ass to its use un
index of the tille ther (p < 0.1).
v. 36, n. 4, p. 34
hest instant sto d in greater onsequently, in
.
between defol egetative stage e-flowering an he other stage defoliations d e other stage n defoliation leaf:stem rat The transitio the Pre-flower tructural chan l leaf:stem rati
tion density on to hinder resulted in low to meet their lowering and defoliation str er a shorter int o interaction henological sta
between e
0.1) for rates o tality, or for on.
mergence rat cal stages (p = This may indic
nder different h
r population, in r
49-356, Oct.-Dec
ocking rates, used of the n a smaller ea
liations was g e 1; intervals nd Flowering s es (1.44 days) during Vegetat
s (1.62 days) s was pos tio (r = 0.51; on from Vege ring and Flow nges in the ca
io, leaf blade l (Table 1). ring the defol wer diet quality r nutritional Flowering s rategies by retu terval of days.
between he age, nor was evaluated he of tiller emerg the stability
te did not = 0.3928; Figu cate an adaptat
herbage allowan
ryegrass, as a func
354 Graminho et al.
Acta Scientiarum. Animal Sciences Maringá, v. 36, n. 4, p. 349-356, Oct.-Dec., 2014
According to Matthew et al. (2000), the tiller emergence rate can be regarded as an adaptive strategy by plants to grazing, in order to restore leaf area. As such, the tiller emergence rate and its lifespan are important characteristics for the persistence of plants in the community (ELYAS et al., 2006).
Tiller mortality rate was different in all phenological stages (p = 0.0001; Figure 2), increasing between Vegetative stage 1 to the Flowering stage, with values ranging from 10.9 to 52.2%, respectively. The tiller survival rate differed between phenological stages, with inverse behavior as tiller mortality rate (p = 0.0001; Figure 2), ranging from 89.1 to 47.8%, respectively. Tiller mortality rate was negatively correlated to final leaf:stem ratio (r = - 0.79; p < 0.0001). The reduction in the leaf:stem ratio stem (Table 1) as phenological stages advanced may have caused a decrease in the supply of photoassimilates, which in turn may have contributed to higher tiller mortality. According to Lemaire and Chapman (1996), the main cause of tiller mortality is the removal of the apical shoot by animal grazing, which occurs especially during the reproductive period when apical shoots are situated higher up the plant from stem growth towards the defoliation horizon, representing another reason for greater tiller mortality in this occasion.
The stability index of the tiller population (IESP) differed between grazing cycles (Figure 2) and fit the
linear regression model Ŷ = 2.57 - 0.0009 x (r2 =
0.78; p = 0.0001) as a function of the thermal sum accumulated during pasture use. Thus, each one-degree increase in the accumulated thermal sum caused a reduction of 0.0009 points in the stability index of the tiller population. According to Caminha et al. (2010), the IESP allows an integrated analysis of changes in the population, as it contemplates emergence and tiller survival rates jointly, not individually, which favors the visualization of the effect of environmental and management factors on the pasture, allowing for better understanding and management.
Despite the decrease in the stability of the tiller population, caused especially by higher tiller mortality, this variable was lower than 1 (Table 1) only during the Flowering stage. Barth Neto et al. (2013) also observed stability rates below 1, at the end of the usage period of ryegrass, in areas under intermittent grazing with prior soybean crop. According to Bahmani et al. (2003), the response obtained during this stage means that ryegrass showed that the tiller emergence rate was lower than tiller survival rates over the same period of time.
There was no interaction between herbage allowance and grazing cycle for tiller population density. Herbage allowances did not influence tiller
population density, averaging 4896 tillers m-2.
Confortin et al. (2013) did not observe any variation in ryegrass tiller density, either, when evaluating different herbage masses, finding an average of
2919.2 tillers m-2. For his part, Cauduro et al. (2006)
observed that low grazing intensity (5 times the potential intake of lambs) contributed to the fact that tiller population density was 9.21% lower than the
density of 3235.6 tillers m-2 observed at moderate
intensity (2.5 times the potential intake of lambs). The higher intensity of leaf blade removal, at the 6% and 9% allowances, may not have caused a sufficient opening in the herbage canopy to increase light incidence over basal shoots, and consequently there was no increase in new tiller production.
Tiller population density differed between the different grazing cycles (Table 1) and fit the linear
regression model (Ŷ= 8215.76 - 2.24x; r2 = 0.66;
p < 0.0001) as a function of the thermal sum accumulated during pasture use, with a reduction of
2.24 tillers m-2 for every degree accumulated during
the grazing cycles. According to Lemaire and Chapman (1996), a tiller density on a given pasture is due to the balance between mortality rates and the emergence of tillers. The negative correlation (r = - 0.82; p < 0.0001) between population density and tiller mortality rate indicates that the reduction in tiller density as the grazing cycle advanced may have occurred due to tiller mortality, given that there was no variation in the tiller emergence rate (Figure 2). Nor were environmental variables such as light availability, water, temperature and nutrients limiting.
There was an interaction between herbage allowance and phenological stage for mass per tiller (p = 0.0074). In Vegetative stage 1, mass per tiller was similar between all evaluated allowances, averaging 0.032 grams. In the Vegetative 2, Pre-flowering and Flowering stages, mass per tiller was similar at 6 and 9% allowances, with values of 0.041, 0.039, and 0.038 grams, respectively; this mass was lower than those observed in 12% allowance herbage. At 12% allowance, mass per tiller was 0.07, 0.069, and 0.075 grams for the Vegetative 2, Pre-flowering and Flowering stages.
The results obtained for mass per tiller, at the Vegetative 2, Pre-flowering and Flowering stages, at 6 and 9% allowances are in agreement with statements by Sbrissia and Da Silva (2008) that frequent and severe defoliation leads to lower individual tiller weight.
Tillering of Italian ryegrass 355
Acta Scientiarum. Animal Sciences Maringá, v. 36, n. 4, p. 349-356, Oct.-Dec., 2014
and 19.3%, respectively. During the Pre-flowering stage, site occupation differed between the different evaluated allowances. Site occupation was greater at 12% allowance, intermediate at 9% allowance 9% and lower at 6% allowance, with values of 34.2, 25.5, and 20.6%, respectively.
Site occupation was positively correlated to the number of live leaves (r = 0.47; p = 0.0194). There was an interaction between herbage allowance and vegetative stage (p = 0.0016) for the number of live leaves, with no difference between Vegetative 1 and 2 and Flowering phenological stages. The number of live leaves was greater, intermediate and lower, respectively, at the Pre-flowering stage, at 12, 9, and 6% herbage allowances, with values of 4.0, 3.4, and 2.9, respectively. The link between site occupation and number of live leaves is essential to understanding the tillering process, as each leaf blade has an axillary shoot that can originate a new tiller and site occupation measured the rate of leaf shoots that can evolve into tillers. Therefore, site occupation is essential to produce pasture, and is associated with the opportunity by animals to consume more or less herbage, of greater or lower quality, therefore ultimately relating it to animal performance. Thus, changes for site occupation at the different allowances occurred only when structural changes began in the pasture towards the reproductive phase, which indicates that the management implemented did not influence the site occupation of ryegrass at the other stages.
Conclusion
Structural changes in the ryegrass pasture caused by management with low herbage allowances and/or by successive phenological stages altered the defoliation strategies of lambs in that they graze intensely and frequently. Ryegrass pastures managed under different herbage allowances did not show variations in the rates of emergence, mortality and tiller survival, but these variables are affected by the different phenological stages. At the start of the reproductive phase of ryegrass, high herbage allowances lead to greater site occupation.
References
ALEXANDRINO, E.; NASCIMENTO JUNIOR, D.; MOSQUIM, P. R.; REGAZZI, A. J.; ROCHA, F. C. Características morfogênicas e estruturais na rebrotação da Brachiaria brizantha cv. Marandu. submetida a três doses de nitrogênio. Revista Brasileira de Zootecnia, v. 33, n. 6, p. 1372-1379, 2004.
BAHMANI, I.; THOM, E. R.; MATTHEW, C.; HOOPER, R. J.; LEMAIRE, G. Tiller dynamics of perennial ryegrass cultivars derived from different New
Zealand ecotype: effects of cultivar, season, nitrogen fertilizer and irrigation. Australian Journal of Agricultural Research, v. 54, n. 8, p. 803-817, 2003. BARTH NETO, A.; CARVALHO, P. C. F.; LEMAIRE, G.; SBRISSIA, A. F.; CANTO, M. W.; SAVIAN, J. V.; AMARAL, G. A.; BREMM, C. Perfilhamento em pastagem de azevém em sucessão a soja ou milho, sob diferentes métodos e intensidades de pastejo. Pesquisa Agropecuária Brasileira, v. 48, n. 3, p. 329-338, 2013. CAMINHA, F. O.; SILVA, S. C.; PAIVA, A. J.; PEREIRA, L. E. T.; MESQUITA, P.; GUARDA, V. D. A. Estabilidade da população de perfilhos de capim-marandu sob lotação contínua e adubação nitrogenada. Pesquisa Agropecuária Brasileira, v. 45, n. 2, p. 213-220, 2010. CAUDURO, G. F.; CARVALHO, P. C. F; BARBOSA, C. M. P.; LUNARDI, R.; NABINGER, C.; GONÇALVES, E. N.; DEVINCENZI, T. Variáveis morfogênicas e estruturais de azevém anual (Lolium multiflorum Lam.) manejado sob diferentes intensidades e métodos de pastejo. Revista Brasileira de Zootecnia, v. 35, n. 4, p. 1298-1307, 2006. CONFORTIN, A. C. C.; ROCHA, M. G.; QUADROS, F. L. F.; GLIENKE, C. L.; ROSSI, G. E.; MORAES, A. B. Características estruturais e morfogênicas de aveia preta e azevém anual sob duas intensidades de pastejo. Revista Brasileira de Zootecnia, v. 39, n. 11, p. 2357-2365, 2010a.
CONFORTIN, A. C. C.; QUADROS, F. L. F.; ROCHA, M. G.; CAMARGO, D. G.; GLIENKE, C. L.; KUINCHTNER, B. Morfogênese e estrutura de azevém anual submetido a três intensidades de pastejo. Acta Scientiarum. Animal Sciences, v. 32, n. 4, p. 385-391, 2010b.
CONFORTIN, A. C. C.; ROCHA, M. G.; MACHADO, J. M.; ROMAN J.; QUADROS, F. L. F ; PÖTTER, L. Diferentes massas de forragem sobre as variáveis morfogênicas e estruturais do azevém anual. Ciência Rural, v. 43, n. 3, p. 496-502, 2013.
ELYAS, A. C. W.; PINTO, J. C.; FURTINI NETO, A. E.; MORAIS, A. R. Nitrogênio e saturação de bases no desempenho do capim-pojuca (Paspalum swalen cv. Pojuca) cultivado em vasos. Ciência e Agrotecnologia, v. 30, n. 3, p. 554-561, 2006.
HODGSON, J. Grazing management. Science into practice. Harlow: Longman Scientific and Technical, 1990.
INMET-Instituto Nacional de Meteorologia. Consulta de dados da estação automática Santa Maria (RS). 2012. Available from: <http://www.inmet.gov.br/ sonabra/dspDadosCodigophp?QTgwmw>. Access on: Oct. 15, 2012.
JOCHINS, F.; PIRES, C. C.; GRIEBLER, L.; BOLZAN, A. M. S.; DIAS, F. D.; GABANI, D. B. Comportamento ingestivo e consumo de forragem por cordeiras em pastagem de milheto recebendo ou não suplemento. Revista Brasileira de Zootecnia, v. 39, n. 3, p. 572-581, 2010.
356 Graminho et al.
Acta Scientiarum. Animal Sciences Maringá, v. 36, n. 4, p. 349-356, Oct.-Dec., 2014
CARVALHO, P. C. F. (Ed.). Grassland
ecophysiology and grazing ecology. Wallingford: CABI, 2000. p. 265-288.
LEMAIRE, G.; CHAPMAN, C. Tissue flows in grazed plant communities. In: HODGSON, J.; ILLIUS, A.W. (Ed.). The ecology and management of grazing systems. Wallingford: CABI, 1996. p. 3-36.
LEMAIRE, G.; SILVA, S. C.; AGNUSDEI, M.; WADE, M.; HODGSON, J. Interactions between leaf lifespan and defoliation frequency in temperate and tropical pastures: a review. Grass and Forage Science, v. 64, p. 341-353, 2009. MACHADO, J. M.; ROCHA, M. G.; MORAES, A. B.; CONFORTIN, A. C. C.; OLIVEIRA NETO, R. A. Intensidade e frequência de desfolha em azevém. Revista Brasileira de Agrociência, v. 17, n. 3-4, p. 365-374, 2011. MATTHEW, C.; ASSUERO, S. G.; BLACK, C. K.; SACKVILLE HAMILTON, N. R. Tiller dynamics of grazed swards. In: LEMAIRE, G.; HODGSON, J.; MORAES, A.; NABINGER, C; CARVALHO, P. C. F. (Ed.). Grassland ecophysiology and grazing ecology. Wallingford: CABI, 2000. p. 127-150.
PONTES, L. S.; CARVALHO, P. C. F.; NABINGER, C.; SOARES, A. B. Fluxo de biomassa em pastagem de
Azevém anual (Lolium multiflorum Lam.) manejada em diferentes alturas. Revista Brasileira de Zootecnia, v. 33, n. 3, p. 529-537, 2004.
SANTOS, M. E. R.; FONSCECA, D. M.; SILVA, G. P.; BRAZ, T. G. S.; GOMES, V. M.; SILVA, S. P. Defoliation patterns is signal grass tillers with varying heights in the same pasture. Acta Scientiarum. Animal Sciences, v. 35, n. 3, p. 259-265, 2013.
SAS Institute Inc. User’s guide. Version 9.2. Cary: SAS, 2002-2005.
SBRISSIA, A. F.; DA SILVA, S. C. Compensação tamanho/densidade populacional de perfilhos em pastos de capim-marandu. Revista Brasileira de Zootecnia, v. 37, n. 1, p. 35-47, 2008.
Received on June 2, 2014. Accepted on July 9, 2014.