Study conducted at the Central Institute at Clinical Hospital, Faculty of Medicine, Universidade de São Paulo – USP – São Paulo (SP), Brazil and Department of Physical Therapy, Speech-Language and Audiology Therapy and Occupational Therapy, Faculty of Medicine, Universidade de São Paulo – USP – São Paulo (SP), Brazil.
(1) Central Institute at Clinical Hospital, Faculty of Medicine, Universidade de São Paulo – USP – São Paulo (SP), Brazil.
(2) Department of Audiology, Central Institute at Clinical Hospital, Faculty of Medicine, Universidade de São Paulo – USP – São Paulo (SP), Brazil. (3) Department of Ophthalmology and Otorhinolaryngology, Faculty of Medicine, Universidade de São Paulo – USP – São Paulo (SP), Brazil.
(4) Speech-Language and Audiology Therapy Course, Department of Physical Therapy, Speech-Language and Audiology Therapy and Occupational Therapy, Faculty of Medicine, Universidade de São Paulo – USP – São Paulo (SP), Brazil.
Conflict of interests: No
Author’s contribution: EMSB isprincipal researcher, responsible for study design, schedule design, literature review, data collection and analysis, article writing, and article review; RA was responsible for data collection supervision, article review; RFB for data collection facilitation, article review; AGS is a researcher and advisor, responsible for study design, schedule design, data analysis, article submission and procedures, article writing review, and approval of the final version. Correspondence address: Alessandra Giannella Samelli. R. Cipotânea, 51, Cidade Universitária, São Paulo (SP), Brazil, CEP: 05660-160.
E-mail: [email protected]
Received: 5/15/2013; Accepted: 9/11/2013
Quality indicators for audiology services
Indicadores de qualidade para serviços de audiologia
Erica Miranda da Silva Bacchetti1, Renata Akiyama2, Ricardo Ferreira Bento3, Alessandra Giannella Samelli4
ABSTRACT
Purpose: To construct quality indicators for Audiology services from the perspective of the user. Methods: A cross-sectional study using a satisfaction survey with 12 closed questions and one open-ended ques-tion was administered to users. Patients were asked to give their opinion about their last appointment regarding the: Ease of access to the service, Time spent in the waiting room, Cordiality, Attention dispensed to com-plaints, Impressions about the procedure, Confidence conveyed by the audiologist, Explanations on the complaint by the audiologist, Schedu-ling satisfaction, Overall service assessment. The patients were presented with a visual-analogue scale represented by five icons, followed by the question: “Which of these pictures best expresses your opinion?” The analysis considered the score of each question (a minimum score of one and a maximum of five points) and the overall score of the 12 questions. The data were compiled and analyzed for the construction of quality indicators. Results: The scores of the questionnaires were high, with an average score of 55.5 points, indicating a high level of satisfaction with the service. The data collected are homogeneous and suitable for the construction of quality indicators. Conclusion: The indicators cons-tructed for the service were: access to care, time in the waiting room, reception, performance of the professional staff, scheduling, and overall service assessment.
Keywords: Program Evaluation; Health Care Evaluation Mechanisms; Health Services Evaluation; Quality Indicators, Health Care
RESUMO
Objetivo: Construir indicadores de qualidade para Audiologia Clínica, sob a ótica do usuário. Métodos: Trata-se de um estudo transversal, realizado por meio de pesquisa de satisfação, aplicada por meio de 13 perguntas (sendo apenas uma aberta). Foi solicitado ao participante que opinasse sobre o último atendimento na unidade, com relação aos se-guintes aspectos: acesso ao atendimento; tempo de espera; cordialidade; atenção dada às queixas; impressão sobre o procedimento; confiança; ex-plicações (queixa e seguimento); satisfação; avaliação geral. As respostas foram dadas por meio de uma escala visual-analógica, representada por cinco ícones, que deveriam expressar a opinião dos participantes. Os re-sultados foram analisados considerando-se a pontuação de cada questão (mínima de 1 e máxima de 5 pontos) e a pontuação total do questionário. Os dados foram submetidos à análise estatística para a construção dos indicadores de qualidade. Resultados: A pontuação dos questionários atingiu um escore médio de 55,5 pontos. Os dados levantados foram homogêneos, configurando material adequado para a construção de indicadores de qualidade. Conclusão: Os indicadores construídos para o serviço foram: acesso ao atendimento, tempo em sala de espera, aco-lhimento, atuação profissional, agendamento e avaliação do atendimento.
INTRODUCTION
Concern about the quality of health services is no longer an isolated attitude and has become a technical and social impera-tive, enabling continuous monitoring and improvement of these services(1). Assessing the quality of health care services is
nee-ded, but it demands a lot of attention. The issue becomes even more complex when the polysemic concepts “assessment” and “quality” are combined, because of the difficulties in their joint use due to their multidimensional character, which encompasses objective and subjective dimensions of equal importance(2).
The assessment of the quality of health care services is therefore a broad and complex concept. The results of an as-sessment may be converted into indicators, which are indices that quantitatively measure the variations in the behavior of previously established quality standards(3).
The indicators provide data that enable measuring the re-ality of the service and the changes that have occurred. These variables describe a reality and must be statistically valid measures, because they represent information that is used by service managers. More than that, the data interpreted by indicators should be especially useful for decision making by those who collect the data or service managers, and may result in improvements to health care service(4,5).
However, the paradigm that guides the assessment of the quality of health services is markedly focused on, or even exclusive to, quantifiable objective dimensions, excluding the human, intersubjective dimension(6).
The importance of user opinion regarding the quality of health services should be reinforced(7-9). The incorporation of
user evaluation on the assessment represents a sensitive indi-cator of the quality of the service provided and provides data that help improve the quality of the service.
In 2006, the Audit and Health Control Regulatory Group of the Health Planning Coordination, Health State Department – São Paulo, Brazil published the Final Report of the Auditor Training Course(10), which aimed to train professionals for
assessment of the Unified Health System (Sistema Único de Saúde – SUS) Hearing Health Programs. The report indicated that the main aspect of auditing in hearing health is the asses-sment of health service quality and the ability to use techno-logical, financial, and human resources to meet the needs of its users, namely promoting the solution to their problems. On occasion, the auditors, who have worked in auditing hearing health services, reported difficulty in performing a qualitative assessment of the service and therefore ended up confined to quantitative aspects such as the existence of equipment, facili-ties, and trained personnel, listed in Ordinance No. 2.073/GM of September 28, 2004, which established the National Policy on Hearing Health Care(11).
This factor complicates one of the main aims of the asses-sment, which is to check the resolubility of the hearing health service, i.e., its effectiveness in addressing the user demands.
To try and solve that issue, user satisfaction assessment tools have been developed, using questionnaires, interviews, home visits, and other strategies to assess the quality and ability of the service in meeting user needs(10).
The concept of user satisfaction can be defined in terms of the expectations and perceptions that users have of the services provided. One must be aware of the concepts and careful when developing the instruments, because oftentimes what is being measured is not satisfaction itself, but the perception of service and the previous expectation of users(7).
Assessing the quality of a health service is key to obtain parameters on its operation and data for its improvement. Speech-Language and Audiology Therapy must seek tools that help achieve an accurate measure of the impacts and ou-tcomes of different interventions, by including the audiologist in health actions.
This study aimed to construct quality indicators from the perspective of users for the Department of Audiology, Central Institute at the Clinical Hospital, University of São Paulo, São Paulo, Brazil.
METHODS
The study was approved by the Ethics Committee for Analysis of Research Projects of the Clinical Hospital and Faculty of Medicine, University of São Paulo (USP) under protocol nº 0409/10.
Patients evaluated at the Department of Audiology between July 2010 and June 2011 were randomly invited to participate in the study. In total, 75 patients, aged between two and 83 years (mean: 47.9 years), accepted the invitation and signed the informed consent form. In the case of underage subjects, or those with neurological and/or cognitive impairments that prevented them from understanding the objectives and proce-dures involved in this study, the informed consent form was signed by the legal guardian. Only two patients declined the invitation, preferring not to sign the informed consent form.
User opinion was collected using a satisfaction survey, adapted from the model proposed in a previous study(12). This
instrument was administered by the researcher and comprised 12 closed questions and one open-ended question (Appendix 1).
In the case of underage subjects or those with neurological and/or cognitive impairments, the survey was conducted with the legal guardian, provided that he/she had accompanied the entire service.
Patients were requested to give their opinion about their last appointment, with respect to the following parameters: 1) Ease of access to the service; 2) Time spent in the waiting room; 3) Cordiality by the receptionist; 4) Cordiality by the professional; 5) Attention dispensed to complaints; 6) Impressions about the procedure; 7) Confidence conveyed by the audiologist; 8) Confidence in the procedure; 9) Explanations on the complaint by the audiologist; 10) Explanations on follow-up treatment; 11) Appointment scheduling satisfaction; 12) Overall service assessment.
In an attempt to quantify these attitudes, patients were pre-sented with a visual analog scale (VAS), reprepre-sented by a series of five icons (Appendix 1), followed by the question: “Which of these images best expresses your opinion?”
The results of the satisfaction survey were calculated by the sum of scores of each question, resulting in the overall score of the 12 questions. Each item in the questionnaire has a minimum score of one (icon E) and a maximum of five points (icon A). The overall score is the sum of responses of the 12 items, totaling a minimum score of 12 and a maximum of 60 points. Subjects who did not respond to the entire satisfaction survey were to be removed from the sample. However, all questionnaires were completed in full.
The open question consisted of a request for suggestions for service improvements. There was no score for this question, because it was included to validate the questionnaire. Thus, the answer should be in accordance with the answers of previous questions: for instance, if the answer to the closed question “Ease of access to service” had been positive, the open-ended question could not have a negative suggestion for that item, which would indicate inconsistency in the responses. There were no inconsistencies between questions in this study.
It is important highlight that Department of Audiology is part of the Otorhinolaryngology Ambulatory and is licensed by SUS to provide nationwide “high complexity hearing diagnosis, treat-ment, and rehabilitation”, through Ordinance 601 of the Health Care Department of October 31, 2005(13). The Department of
Audiology staff is composed of five audiologists, who have a soundproof room at their disposal, which includes five acoustic booths, a room for audiological assessment, and a room for
administrative support. The sector also has an otoscope, five audiometers, two middle ear analyzers, material for instrumental assessment, two computers, and a printer. Appointments hours are Monday to Friday from 7:00 AM to 6:00 PM.
The Spearman correlation, Mann-Whitney, and Equality of two proportions tests were used. Significance level was set at p≤0.05 and 95% confidence intervals for the mean were
constructed.
RESULTS
Sample characterization
The difference in gender distribution of subjects (66.7% women and 33.3% men) is shown in Table 1.
Satisfaction survey
The mean total questionnaire score was 55.5 ± 1.3 points (mean ± standard deviation). The score for each item in the user satisfaction survey is shown in Table 2.
The items in the user satisfaction survey were analyzed and divided into dimensions according to the aspect addressed to generate the quality indicators. Thus, the 12 questions were grouped into six dimensions: dimension 1: Access to service (Question 1); dimension 2: Time in the waiting room (Question 2); dimension 3: Reception (Questions 3, 4, and 5); dimension 4: Professional performance of staff (Questions 6, 7, 8, 9, and 10); dimension 5: Scheduling (Question 11); and dimension 6: Overall service assessment (Question 12). Each dimension represented a quality indicator and the scores were calculated by averaging the corresponding questions.
Thus, the quality indicators for the Hearing Health Service were:
Table 1. Gender distribution of subjects
Gender n % p-value
Male 50 66.7
<0.001
Female 25 33.3
Mann-Whitney test (p≤0.05)
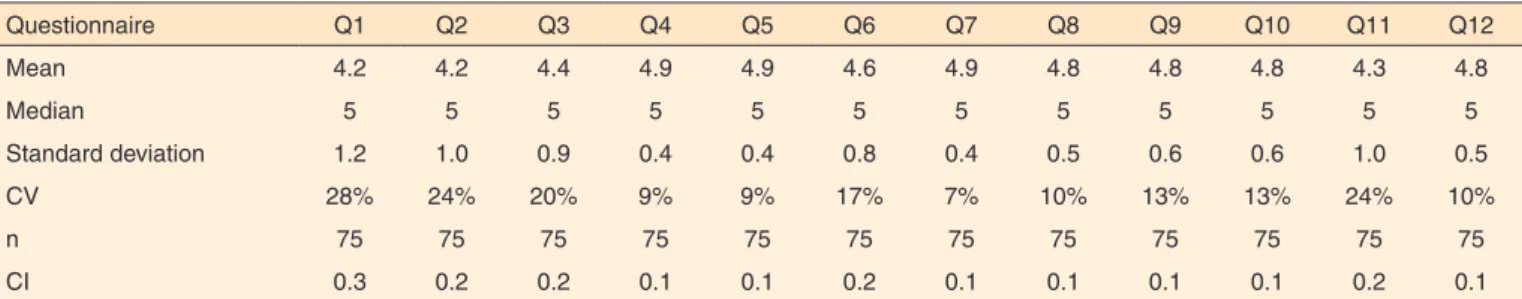
Table 2. Descriptive statistics of the user satisfaction survey.
Questionnaire Q1 Q2 Q3 Q4 Q5 Q6 Q7 Q8 Q9 Q10 Q11 Q12 Mean 4.2 4.2 4.4 4.9 4.9 4.6 4.9 4.8 4.8 4.8 4.3 4.8
Median 5 5 5 5 5 5 5 5 5 5 5 5
Standard deviation 1.2 1.0 0.9 0.4 0.4 0.8 0.4 0.5 0.6 0.6 1.0 0.5
CV 28% 24% 20% 9% 9% 17% 7% 10% 13% 13% 24% 10%
n 75 75 75 75 75 75 75 75 75 75 75 75
CI 0.3 0.2 0.2 0.1 0.1 0.2 0.1 0.1 0.1 0.1 0.2 0.1
Indicator 1 – Access to service: provides information on ad-mittance of high-complexity health service users (reference network);
Indicator 2 – Time in the waiting room: provides information on the time between the scheduled appointment time and the actual appointment time;
Indicator 3 – Reception: provides data on humanization of service such as reception, cordiality by professionals, and attention dispensed to service user complaints;
Indicator 4 – Professional performance of staff: analyzes how users perceive the service provided by the Department, whe-ther they trust the service provided by audiologists, whewhe-ther their questions are clarified, and whether instructions are provided accordingly;
Indicator 5 – Scheduling: a variable that expresses the time between the exam request and the examination;
Indicator 6 – Overall service assessment: shows the overall service impression at the Department.
The scores of the quality indicators, the confidence interval, and the descriptive statistics of quality indicators are shown in Figures 1 and 2, and Table 3, respectively.
DISCUSSION
In general, patients in the Department of Audiology who agreed to participate in the study expressed enthusiasm for the initiative of seeking to improve the quality of the health service provided.
Regarding the gender distribution of subjects in the study sample, previous research has shown greater use of health services by women, both by Unified Health System and private
health care users, which could explain the difference in the distribution. This difference in the use of health services is attributed to reproductive health-related issues, as well as traits inherent to women, which are related to the fact that women perceive their health needs differently and present more complaints and chronic diseases, albeit often less severe, than men(14).
Ordinance nº 587 – SAS/MS of October 07, 2004 was created to provide guidance to State Departments of Health for implementing State Networks for Hearing Health Care(15).
The text includes a form for credentialing of Medium and High Complexity Audiology services, whose approach is structural only and should be used exclusively for licensing of centers. Therefore, the text cannot be used as the only tool in the ac-creditation process of existing services.
In an effort to assess the quality of services, auditors of hearing health services use assessment tools from other areas, which are not suited to the specifics of Audiology. Thus, most assessments are based on infrastructure (facilities, number of professionals, equipment) and quantitative aspects (number of appointments, number of hearing aid adaptations, number of follow-ups), overlooking many aspects that comprise the quality of hearing health services(10,16).
The service evaluated in the study has been licensed by the Unified Health System (SUS) as a high complexity service(13).
The staff of audiologists performs audiological assessments,
Figure 1. Quality indicators scores
Legenda: I = Quality Indicator; Indicator 1 = Access to service; Indicator 2 = Time in the waiting room; Indicator 3 = Reception; Indicator 4 = Professional perfor-mance of staff; Indicator 5 = Scheduling; Indicator 6 = Overall service assessment.
Figure 2. Quality Indicators - Confidence Intervals
Table 3. Descriptive statistics of quality indicators for Hearing Health Service
Indicator Indicator 1 Indicator 2 Indicator 3 Indicator 4 Indicator 5 Indicator 6
Mean 4.19 4.21 4.72 4.77 4.29 4.80
Median 5.0 5.0 5.0 5.0 5.0 5.0
Standard deviation 1.2 1.0 0.5 0.4 1.0 0.5
CV 28% 24% 10% 9% 24% 10%
CI 0.26 0.23 0.10 0.10 0.24 0.11
but lacks a qualitative assessment tool, which could help im-prove the service.
The maximum overall score possible for the satisfaction survey was 60 points. The results indicated a high score of 55.5 points, showing a high level of user satisfaction with the service provided by the Department of Audiology at the Clinical Hospital of the University of São Paulo. The results are testament to the quality of the service provided, because a high quality service is not likely when the user is not satisfied with the service provided(9,17).
However, some studies have shown that a good portion of SUS users have a kind of “gratitude” for the services provided and do not claim their citizen rights for access to public ser-vices, which should be considered in the analysis of quality indicators from the perspective of users. Moreover, some studies have also reported the omission of negative criticism by users, especially in developing countries, for fear of losing the service and because of the relationship of dependency and affection towards health professionals(9,16-19). This type
of finding is expected in studies aimed at measuring user satisfaction of SUS services, but do not discredit the studies; in fact, these findings show the importance of being more cautious when analyzing the data.
Quality indicators should possess some key characteristics, namely: availability (the data for their calculation should be easily obtained), reliability (the data should be reliable), and validity (the indicator should be a function of the characteristics of the phenomenon measured). Moreover, the data represented by indicators should be useful for the decision making by those who collect the data or the service management(4).
All questions had excellent statistical variability, i.e., low values with coefficients of variation (CV) lower than 50% (Table 2). These findings show that the data collected are homogeneous and represent the general opinion of the popu-lation interviewed. Thus, the data were statistically reliable and represent suitable material for the construction of quality indicators(4).
Numerical indicators are extremely important for care and management purposes, because they can be subjected to analysis and comparison with standards internal and external to the institution. Moreover, indicators can be used as tools for evidence based decision-making(20,21).
The indicators constructed in this study were based on numeric indices, which were calculated by measuring the event under analysis (the service provided at the Department of Audiology) (Table 3). These indices often show significant changes in historical series and exceed certain standards or evidence when compared to similar institutions, meaning that they are performance-related indicators(22).
Some studies have shown that factors related to the ser-vice, the professionals, and patient characteristics determine user satisfaction with the service, even though some of these factors are not well defined. Factors related to the service and
the professionals such as cordiality, hospitality, information provided about the treatment, resolubility, availability, and time in the waiting room are considered relevant aspects to deter-mine user satisfaction, which validates the quality indicators constructed in this study(12,22,23).
Therefore, we were concerned in characterizing the service for which the indicators were constructed. The definition of factors relevant to performance of service is important, because these factors may explain variations in indicator data and lead to the solution of the problem(22). Variations in physical
facili-ties, equipment, professionals, and service operation may be responsible for abrupt changes in quality indicators.
Regarding Indicator 1 - Access to service, which had the lowest score (Figure 1) and highest confidence interval (CI) for the mean of all indicators (Figure 2), some studies have shown that the difficulty of access to services is one of the factors that most influences the degree of user satisfaction of SUS users, which is in agreement with the results of our study(12,17,24-26).
The results of Indicator 2 – Time in the waiting room, which had the second lowest score and second highest CI (Table 3), are also in agreement with other studies, which reported that a prolonged wait is a major cause of dissatisfaction(12,27).
Indicator 3 – Reception, is considered essential for good health care services, because it can favor the reorganization and qualification of services provided, so that professionals can act effectively to improve individual and collective health. The combination of access – reception factors results in greater user satisfaction with the service, determines the choice of service, and creates a good professional-patient relationship(28,29).
The result of Indicator 4 – Professional performance of staff, which had the second highest score, was similar to the one found in a similar study(17).
Indicator 5 – Scheduling, which had one of the lowest scores (Figure 1), emphasizes the importance of the triad access - time in the waiting room - scheduling and is in agreement with the results of other studies(12,27).
The high score of Indicator 6 – Overall service assessment, which actually had the highest score (Figure 1), validated the overall score of the Satisfaction Survey and the score of each quality indicator. The high influence of Indicator 6 on the overall score can be explained by the fact that this Indicator includes aspects concerning all other indicators, which contri-bute to a positive assessment of the service.
CONCLUSION
The quality indicators constructed for the service provi-ded at the Department of Audiology were: Access to service; Time in the waiting room; Reception; Performance of the professional staff; Scheduling; and Overall service assessment. These indicators were generated from data with a high degree of reliability, and thus can be used to evaluate the quality of audiology services from the perspective of the user.
REFERENCES
1. van Engen-Verheul MM, van der Veer SN, de Keizer NF, Tion Sjoe Sjoe W, van der Zwana EP, Peek N. A Web-based System to Facilitate Local, Systematic Quality Improvement by Multidisciplinary Care Teams: Development and First Experiences of CARDSS Online. Stud Health Technol Inform. 2013; 192:248-52. 2. Bosi MLM, Uchimura KY. Avaliação da qualidade ou
avaliação qualitativa do cuidado em saúde? Rev Saúde Pública. 2007;41(1):150-3.
3. Gastal FL. Controle estatístico de processo: um modelo para a avaliação da qualidade dos serviços de internação psiquiátrica [tese]. São Paulo: UNIFESP; 1995.
4. Tronchin DMR, Melleiro MM, Kurcgant P, Garcia AN, Garzin ACA. Subsídios teóricos para a construção e implantação de indicadores de qualidade em saúde. Rev Gaúch Enferm. 2009;30(3):542-6. 5. Deem KC, Diaz-Ordaz EA, Shiner B. Identifying quality
improvement opportunities in a universal newborn hearing screening program. Pediatrics. 2012;129(1);e157-64.
6. Uchimura KY, Bosi MLM. Qualidade e subjetividade na avaliação de programas e serviços de saúde. Cad Saúde Pública. 2002;18(6):1561-9.
7. Esperidião M, Trad LAB. Avaliação de satisfação de usuários. Ciênc Saúde Colet. 2005;10:303-12.
8. Choi W, Rho MJ, Park J, Kim K, Kwon YD, Choi IY. Information system success model for customer relationship management system in health promotion centers. Healthc Inform Res. 2013;19(2):110-20. 9. Sobreira PGP, Vasconcellos MTL, Portela MC. Avaliação do
processo de aconselhamento pré-teste nos Centros de Testagem e Aconselhamento (CTA) no Estado do Rio de Janeiro: a percepção dos usuários e profissionais de saúde. Ciênc Saúde Colet. 2012;17(11):3099-113.
10. São Paulo. Secretaria de Estado da Saúde. Coordenadoria de Planejamento de Saúde. Grupo Normativo de Auditoria e Controle de Saúde. 5º Curso do Ciclo de Capacitação de Auditores. “SUS e Audiologia: Formação de Auditores” Relatório Final. 2006. 11. Brasil. Ministério da Saúde. Gabinete do Ministro. Portaria Nº
2.073/GM de 28 de setembro de 2004. Institui a Política Nacional de Atenção à Saúde Auditiva. [Internet] [citado 2012 Nov. 20]. Disponível em: http://www.saude.mg.gov.br/images/documentos/ PORTARIA_2073.pdf.
12. Kloetzel K, Bertoni A M, Irazoqui MC, Campos VPG, Santos RN. Controle de qualidade em atenção primária à saúde. I – A satisfação
do usuário. Cad Saúde Pública. 1998;14(3):263-68.
13. Brasil. Ministério da Saúde. Secretaria de Atenção à Saúde. DATASUS – Cadastro Nacional de Estabelecimentos de Saúde. [Internet]. [citado 2010 Mar 29]; Disponível em: http://cnes.datasus. gov.br/Mod_Sipac.asp?VCo_Unidade=3550302078015.
14. Ribeiro MCSA, Barata RB, Almeida MF, Silva ZP. Perfil sociodemográfico e padrão de utilização de serviços de saúde para usuários e não-usuários do SUS - PNAD 2003. Ciênc Saúde Colet. 2006;11(4):1011-22.
15. Brasil. Ministério da Saúde. Secretaria de Atenção à Saúde. Portaria Nº 587 de 07 de outubro de 2004. Determina que as Secretarias de Estado da Saúde dos estados adotem as providências necessárias à organização e implantação das Redes Estaduais de Atenção à Saúde Auditiva. [Internet] [citado 2012 Nov. 20] Disponível em: http://dtr2001.saude.gov.br/sas/PORTARIAS/ Port2004/PT-587.htm.
16. Bevilacqua MC, Melo TM, Morettin M, Lopes AC. A avaliação de serviços em Audiologia: concepções e perspectivas. Rev Soc Bras Fonoaudiol. 2009;14(3):421-6
17. Armigliato ME, Prado DGA, Melo TM, Martinez MANS, Lopes AC, Amantini RCB, et al. Avaliação de serviços de saúde auditiva sob a perspectiva do usuário: proposta de instrumento. Rev Soc Bras Fonoaudiol. 2010;15(1):32-9.
18. Jenkinson C, Coulter A, Bruster S, Richards N, Chandola T. Patients’ experiences and satisfaction with health care: results of a questionnaire study of specific aspects of care. Qual Saf Health Care. 2002;11(4):335-9.
19. Vaitsman J, Andrade GR. Satisfação e responsividade: formas de medir a qualidade e humanização da assistência à saúde. Ciênc Saúde Colet. 2005;10(3):599-613.
20. Kurcgant P, Melleiro MM, Tronchin DMR. Indicadores para avaliação da qualidade do gerenciamento de recursos humanos em enfermagem. Rev Bras Enferm. 2008;61(3):539-44.
21. Moura GSS, Juchem BC, Falk MLR, Magalhães AMM, Suzuki LM. Construção e implantação de indicadores de qualidade assistencial de enfermagem. Rev Gaúcha Enferm. 2009;30(1):136-40.
22. Mainz J. Defining and classifying clinical indicators for quality improvement. Int J Qual Health Care. 2003;15(6):523-30.
23. Pietrovsk V, Dall’Agnol CM. Situações significativas no espaço-contexto da hemodiálise: o que dizem os usuários de um serviço? Rev Bras Enferm. 2006;59(5):630-5.
24. Gouveia GC, Souza WV, Luna CF, Souza-Júnior PRB, Szwarcwald CL. Health care users’ satisfaction in Brazil, 2003. Cad Saúde Pública. 2005;21 Suppl:109-18.
25. Lemme AC, Noronha G, Resende JB. A satisfação do usuário em hospital universitário. Rev Saúde Pública. 1991;25(1):41-6. 26. Assis MMA, Villa TCS, Nascimento MAA. Acesso aos serviços de
saúde: uma possibilidade a ser construída na prática. Ciênc Saúde Colet.2003;8(3):815-23.
28. Ramos DD, Lima MADS. Acesso e acolhimento aos usuários em uma unidade de saúde de Porto Alegre, Rio Grande do Sul, Brasil. Cad Saúde Pública. 2003;19(1):27-34.
29. Queiroz MVO, Jorge MSB, Marques JF, Cavalcante AM, Moreira KAP. Indicadores de qualidade da assistência ao nascimento
baseados na satisfação de puérperas. Texto contexto - Enferm. 2007;16(3):479-87.
30. Ayres JR. Norma e formação: horizontes filosóficos para as práticas de avaliação no contexto da promoção da saúde. Ciênc Saúde Colet. 2004;9(3):583-92.
Appendix 1. User satisfaction survey
1) Ease of access to service:
2) Time spent in the waiting room:
3) Cordiality by the receptionist:
4) Cordiality by the professional:
5) Attention dispensed to complaints:
6) Impressions about the procedure:
7) Confidence conveyed by the audiologist:
8) Confidence in the procedure:
9) Explanations on the complaint by the audiologist:
10) Explanations on follow-up treatment:
11) Appointment scheduling satisfaction:
12) Overall service assessment:
13) Suggestions on how to improve service:
_______________________________________________________ _______________________________________________________ _______________________________________________________ _______________________________________________________