Food Science and Technology
OO:
D https://doi.org/10.1590/1678-457X.12417
OSSN 0101-2061 (Print) OSSN 1678-457X (Online)
1 Introduction
The European anchovy (Engraulis encrasicolus) is a fish highly valued in our country, fondly consumed, easy to find and is used as many varieties of food from dessert to salty food in the Black Sea Region where it is mostly caught. Ot has an important share of 61% among marine fish. While 103,425 tons of the caught anchovy were consumed as food, 76.190 tons were used for fishmeal and fish oil production (Türkiye İstatistik Kurumu, 2013). The European anchovy contains high-quality of lipid and protein and also highly-balanced distribution in terms of vitamins. Ot is kind a fish, rich in polyunsaturated fatty acids and phospholipids (Kinsella, 1987; Güner et al., 1998). Ot is reported that nearly 30% of the total fatty acids in the European anchovy are docosahexaenoic acid (DHA) and eicosapentaenoic acid (EPA) (Shahidi & Cadwallader, 1997; Güner et al., 1998). Anchovy foods are important not only because they are delicious, but also they create local and cultural richness with different tastes along with having positive effects on human health (Boran et al., 2008).
Hamsi kaygana is a type of food, specific to the Black Sea Region of Turkey, prepared with the European anchovy. Although there are different formulations for the preparation of hamsi kaygana, it is mostly prepared using cleaned fresh anchovy, green onion, eggs, breadcrumbs, oil, salt and various spices. The product is ready to serve after being cooked with different methods (frying, baking or pan-frying). A product
that is easily prepared and has a high nutritional value can be assessed as a ready to eat food.
There are various studies on the antimicrobial effect of different spices and additives using in ready to eat food. Spices are natural plant substances or their mixtures, which are obtained directly or by splitting, drying, or grinding the various parts of plants and added to the food for color, taste, odor and flavor and are not regarded as food on their own. Ot has been shown in the studies that the spices used are important, not just being a flavor and taste component in food but also having preservative effects such as antimicrobial and antioxidant. (McKee, 1995; Nair et al., 2005; Ozpolat & Duman, 2017).
Lavandula stoechas is one of species in the Labiatae (Lamiaceae) family and known as lavender. Ot carries glycoside, saponins and essential oils. Ot is a very important drug. Ot has a wide usage area due to its effects such as painkiller, antiseptic, sedative (in asthma and epilepsy), expectorant, relieving the urinary tract infection, healing eczema wounds, and strengthening nerves and heart. The lavender essential oil carries compounds such as camphor, fenchone, borneol, terpineol, and cineole (Zuzarte et al., 2013).
On this study, lavender is added to hamsi kaygana, which is a traditional food of the Black Sea Region, to attract more consumers with its pleasant smell and also it is aimed to be
The effect of lavender (
Lavandula stoechas
) on the shelf life of a traditional food:
hamsi kaygana
Latif TAŞKAYA1*, Hatice HASANHOCAOĞLU YAPOCO1, Cansu METİN1, Yunus ALPARSLAN1
Received 05 May, 2017 Accepted 06 Aug., 2017
1Department of Fishing and Seafood Processing Technology, Fisheries Faculty, Muğla Sıtkı Koçman University, Muğla, Turkey
*Corresponding author: [email protected]
Abstract
This study aimed to determine the effect of Lavandula stoechas, which is intensively grown in Muğla and known as lavender, on the meat quality and shelf life of hamsi kaygana, a traditional food in the Black Sea Region of Turkey. The study groups consist of the control group (K), a group containing 0.1% (A), 0.5% (B), and 1% (C) lavender. After performing the initial analyses, all groups were stored at 4 ± 1 °C. During the storage, the proximate composition, sensory, physicochemical, chemical and microbiological analyses were carried out. According to the chemical results, the lavender added to hamsi kaygana at the rates of 0.5% and 1% had an antioxidant effect and TBA obtained on day 20 in group C did not exceed the limit values. Ot draws attention that lavender has a positive effect on TVB-N. There was less development in the groups in which lavender was added in microbiological terms. The best score in terms of sensory acceptance correlate well within the group B during storage (1 to 9 days) was evaluated. This study has revealed that hamsi kaygana, can be transported to wider markets, by increasing its durability with spices such as lavender and longer-term preservation and easy transportation with different packaging techniques.
Keywords: hamsi kaygana; anchovy; lavender; spices; shelf life; ready to eat food.
Food Sci. Technol, Campinas, 38(4): 711-718, Oct.-Dec. 2018 712 712/718
Traditional food: hamsi kaygana
determined the shelf life and quality of this product. This study is important in that it is tried to bring hamsi kaygana, to the general consumption as a ready to eat food.
2 Material and methods
Approximately 12 kg of cleaned and filleted anchovy was used as a material in the study. The anchovies used in the production of hamsi kaygana were purchased from the local fish market, transferred to Muğla Sıtkı Koçman University, Faculty of Fisheries, laboratory of Processing R&D unit in polystyrene boxes with ice. Dried lavender which is used as natural preservatives in hamsi kaygana production, was obtained from an herbalist in Muğla region. Brand of both salt and olive oil was Arifoğlu Baharat Gıda San. and Tic. Şti., which is a famous dried spice company in Turkey, and were purchased from local super market. Moreover, egg, bread and green onion to be used were bought from a supermarket.
The anchovies and green onion brought to the laboratory were chopped down into small pieces. The chopped anchovy (500 g), green onion (250 g), breadcrumbs (100 g), salt (9 g), one egg (≈ 7 g), and olive oil (30 mL) were mixed thoroughly to the dough consistency in a separate mixing bowl for each group. The control group was cooked at 1200 watts for 16 minutes in a microwave oven in a heat-resistant glass container without the addition of lavender. On the other groups, 0.1% lavender was added in group A, 0.5% in group B, and 1% in group C and it was mixed and cooked in the same way as the control group. The cooled and sliced hamsi kaygana was placed on a polystyrene plate in 2 slices, then covered with polyethylene stretch film and stored at +4 ± 1 °C.
For the analyses, a random package was selected on days 1, 3, 5, 7, 9, 11, 14, 16, and 20 and each analysis was performed with 3 parallels.
2.1 Proximate composition analyses
Analyses were carried out based on the Kjeldhal method for crude protein (Association of Official Analytical Chemists, 1984), the Bligh & Dyer (1959) method for crude lipid content, and the Association of Official Analytical Chemists (1995) method for moisture and ash content.
2.2 Sensory analyses
The sensory analyses of the samples were evaluated by 6 panelists in terms of smell, color, texture structure, and appearance according to Aubourg (2001). Four categories were ranked: 4 (highest quality), 3 (good quality), 2 (fair quality), and 1 (rejectable).
2.3 Physicochemical analyses
The pH value of the samples was measured using an Onolab WTW brand pH meter according to Manthey et al. (1988). The color values of the samples were measured using a colorimeter (Pen Color Art 1L, Artoksi MSM, Turkey). The water activity (aw) value of the samples was determined with Novasına (Model: LabSwift) water activity meter.
2.4 Chemical analyses
Total volatile basic nitrogen (TVB-N) analysis was determined according to Antonacopoulos & Vyncke (1989). On the determination of trimethylamine nitrogen (TMA-N), the method proposed by Boland & Paige (1971), which is a spectrophotometric method, was used. The determination of thiobarbituric acid (TBA) was performed using the spectrophotometric method according to Tarladgis et al. (1960).
2.5 Microbiological analyses
10 g of the sample from each group were weighed and added on autoclaved 90 mL of 0.1% peptone water and dilutions were obtained therefrom (Maturin & Peeler, 1998). Onoculations were done from prepared dilutions to plate count agar (PCA) (Merck) and incubated at 37 °C for 24-48 hours for the total bacteria and at 7 °C for 10 days for the total psychrophilic bacteria (U.S. Food and Drug Administration, 1998).
2.6 Statistical analysis
Whether the differences between the obtained parameters were statistically significant was determined by the variance analysis (ANOVA) using SPSS 16 Windows computer program. Upon determining a significant difference (p < 0.05) between the groups in ANOVA, the Tukey’s test was applied to determine between which groups the difference existed.
3 Results and discussion
3.1 Proximate composition analysis results
All proximate composition analysis results were shown in Table 1 collectively. Upon examining the nutritional values of the fresh anchovy brought to the laboratory, it was determined that crude protein was 16.67%, crude lipid was 1.29%, moisture was 78.26%, and ash was 3.08%. Duyar et al. (2010) determined that the crude protein value of the fresh anchovy was 19.80%, the crude lipid value was 3.20%, the moisture content was 75.40% and the ash content was 1.10%. Differences in values are thought to be due to the factors such as the region, season, and spawning period in which the fish used in the study is caught. On another study conducted, it was reported that the proximate composition in fish varied depending on various factors such as its living environment, nutritional conditions, season, species, age, and size (Gökoğlu, 2002).
respectively. While the highest loss of water was found in the fried anchovy (49.55%), the average protein and lipid contents of grilled, baked and microwaved anchovies were determined to be 25.55%, 17.51%, 22.58%, 20.54%, 24.4%, 23.30%, 22.63% and 22.34%, respectively.
On the last day of the storage, a regression was found in the protein content in the control group (p > 0.05). On day 20, the last day of the storage, while an increase was observed in the protein values of the groups in which lavender was added, the control group showed a decrease (p < 0.05). On the other hand, recent studies results showed that there were not significantly different found in protein values results in both farmed and wild sea bass meat stored (−20 °C) for 45 days (Smichi et al., 2017). Protein content of cooked groups in which lavender was added increased due to rise in dry matter contents. Proximate composition of study groups were affected by cooking temperature. Ot is thought that lavender is effective in preventing protein denaturation. Ot was also reported that the chemical composition and subsequently the nutritional value of meat was affected by the cooking methods and cooking conditions (heating rate, cooking time and temperature) modify (Brugiapaglia & Destefanis, 2012). Other researchers indicated that water losses, occurring during frying and baking resulted in higher protein content in fried and baked fish as compared to the raw fish fillets (Garcia-Arias et al., 2003).
Lipid values increased in all groups except for group C in 20 days after the first day. However, recent studies (Smichi et al., 2017) stated that there were not significantly difference observed in lipid values results in both farmed and wild sea bass meat during storage 45 days at −20 °C. This can be used as a good indicator that these increases occur because cooking produces important losses of water, which concentrates the lipid content. Researchers found that fish cooked in a microwave has a significant increase in protein and fat content Gokoglu et al. (2004). Other study presented that both protein and lipid content in the cooked tuna (Thunnus thynnus) samples increased (Ozquierdo et al., 2001). The decrease in the lipid content of group C was found to be statistically insignificant (p>0.05). The moisture values at the end of the storage period show that there is a decrease in groups B and C containing 0.5% and 1% lavender. The ash values increased in all groups and the highest increase was observed in group C with the highest lavender content. Smichi et al.
(2017) investigated that no significant differences in moisture and ash values during storage at both farm and wild sea bass meat (−20 °C, 45 days).
3.2 Sensory analysis results
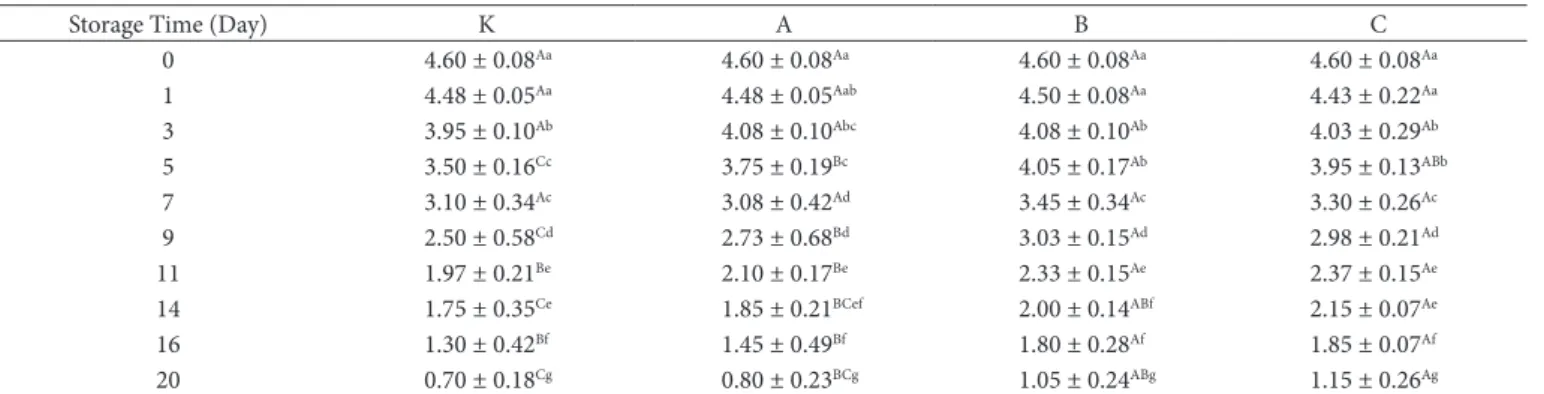
According to the sensory analysis results, the initial values of the samples were evaluated as “the best quality”. On the first days of the storage, while sensory score of group of group K decreased, the groups that were added lavender got higher scores. Groups B and C were more preferred by the panelists in terms of smell, color, texture structure, and appearance. The fact that as the intensity of lavender increased, it positively affected the criteria such as color, smell, etc. reflected on its general scores, and group C, in which 1% lavender was used, got the highest score. On day 20 of the storage, while groups K and A fell below the consumable limit value of 1, group B and C remained within the limit values with getting 1.05 and 1.15 points, respectively, thus it has been observed that their sensory shelf life were increased for 4 days (Table 2). On another study conducted, ice containing different amounts of thyme, marjoram, and clove extracts was used in the cleaned anchovy, and upon examining the sensory results, it was determined that the control group exceeded the limit values on day 9, and the other groups containing the extractions exceeded the limit values on day 12, by increasing their sensory shelf life 3 more days (Bensid et al., 2014).
3.3 Physicochemical analysis results
The initial pH value of the fresh anchovies used for the study was determined to be 6.44. The pH value is between 6.0 and 6.5 in fish after being caught, and the pH value can be accepted up to 6.8 (Köse & Erdem, 2004). At the end of the storage period, the pH value showed an increase in all groups compared to the initial value and was determined to be 6.90, 6.79, 6.74 and 6.76 for groups K, A, B, and C, respectively. While the groups in which lavender was used did not exceed the acceptable limit value until the end of the storage, the control group exceeded the value after the 11th day. Ot was determined that lavender
suppressed the increase in pH for at least 9 days. On the study conducted by Bensid et al. (2014), while the pH of the fresh anchovy was found to be 5.93, it was 7.3 in the control group samples at the end of the storage for 12 days, and in the groups Table 1. Proximate composition of raw material and study groups.
Proximate Composition (%)
Protein Lipid Moisture Ash
Raw Material 16.67 ± 0.59f 1.29 ± 0.17c 78.26 ± 0.62a 3.08 ± 0.10g
1. Day
K 17.61 ± 0.20e 6.84 ± 0.42b 53.51 ± 2.46f 7.46 ± 0.29f
A 18.34 ± 1.42de 6.88 ± 0.29b 53.45 ± 1.15f 8.80 ± 0.07de B 18.49 ± 1.51cd 7.29 ± 0.49a 57.10 ± 0.75b 8.43 ± 0.38e
C 19.00 ± 0.12c 8.16 ± 0.91a 56.41 ± 1.59bc 8.37 ± 1.28
20. Day
K 16.64 ± 0.42f 7.20 ± 0.40a 55.13 ± 0.74de 9.84 ± 0.50ab A 23.38 ± 0.39a 7.41 ± 0.21a 55.95 ± 0.53cd 9.43 ± 0.51bc
B 23.43 ± 0.27a 7.50 ± 0.40a 54.61 ± 0.97e 9.18 ± 0.21cd
Food Sci. Technol, Campinas, 38(4): 711-718, Oct.-Dec. 2018 714 714/718
Traditional food: hamsi kaygana
in which thyme, marjoram, and clove extracts were applied, it was 7.00, 6.93 and 6.89, respectively. On this study, as well as in our study, the positive effects of extracts on pH are observed. On another study, it was stated that the pH values of anchovy cakes before the storage and after the 12th day of the storage
after being cooked were within the range of 6.93-7.13 and that a time-dependent increase was detected (İnanlı et al., 2011).
Consumers usually decide on their first impressions about the food by looking at its brightness before consuming food (Yerlikaya & Gökoğlu, 2009). The COE (Commission Onternationale de L’eclairage) L*, a* and b* color range system is an analysis system that provides color measurement in three dimensions (Ermiş et al., 2007). On our study, the L*, a* and b* values were found to be 45.07, (-)2.33 and 5.27, respectively, according to the measured color analyses. Upon examining the L* values to the end of the storage, groups K, A, B, and C were determined to be 53.48, 44.05, 51.50 and 50.5, respectively. The decrease in the groups in which lavender was added may be due to the darker color of lavender. At the end of the storage, the a* values were found to be (-)0.92, (-)4.11, (-)1.6,1 and (-)1.17, respectively. On the samples which lavender was added, values closer to green were obtained. At the end of the storage, the b* values were obtained to be 14.33, 15.11, 13.55 and 12.82.
The water activity (aw) value in fresh fish meat is 0.98-0.99 (Şengör et al., 2004). The initial water activity (aw) of the fresh anchovy used in our study was determined to be 0.97. On our study, there was a slight decrease in the water activity value after the cooking process. During the storage, there were decreases in all groups depending on time (p<0.05) and the water activity (aw) value at the end of the storage was determined to be 0.94, 0.94, 0.93 and 0.94 for groups K, A, B and C, respectively. The water activity analysis results were in line with the moisture content.
3.4 Chemical analysis results
All chemical analysis results were shown in Table 3 collectively. The TVB-N value is the volatile bases that are formed with the reduction of protein and non-protein compounds and as a result of the microbial activity. The amount of TVB-N between 25-35 mg/100 g in fish was determined to be consumable limit values (European Commission, 1995). Upon examining the TVB-N values in our study, an increase was observed during the storage.
Gullian-Klanian et al. (2016) also reported that the TVB-N value result of red octopus increased with storage time. At the end of the storage, the highest TVB-N value was obtained in group K with 32.00 mg/100 g. However, until the end of the 20th storage
day, the consumable limit values were not exceeded in any group. Duyar et al. (2010) found the TVB-N value to be 12.21 mg/100 g in fresh anchovy and this value reached 25.14 mg/100 g on the 10th
day of the storage at 4 °C in ice. Ot is believed in the direction of the results that the addition of lavender has a positive effect on the TVB-N value. Gökoğlu et al. (2009) obtained the TVB-N value to be 8.99 mg/100 g in anchovy marinades prepared by adding pomegranate sauce at the end of the 21-month storage at 4 °C. On the study in which Bensid et al. (2014) applied thyme, clove, and marjoram extracts, they obtained 31.56 mg/100 g, 28.10 mg/100 g and 38.10 mg/100 g TVB-N values, respectively, at the end of the 12-day storage and the positive effects of plant extracts on the TVB-N value were observed compared to the control group (60.23 mg/100 g).
The TMA-N acceptability limit value in fish has been reported to be 5-10 mg/100 g (Sikorski et al., 1989). The acceptable TMA-N limit value for anchovy in accordance with the sensory analyses is stated to be 4 mg/100 g (Köse & Erdem, 2004). According to the TMA-N results obtained in our study, an increase was observed from the beginning to the last day of the storage for all groups. The increase observed in the TMA-N value is an expected result because of the bacterial degradation and enzymatic activity due to the storage. The highest value (5.35 mg/100 g) at the end of the storage was obtained in group K, not containing lavender and the lowest value (2.60 mg/100 g) was obtained in group C with 1% lavender content. The consumable limit values were not exceeded at the end of the study. On another study with anchovy pate stored at 4 °C for 8 days and in which they used thyme as a spice, Kaba et al. (2012) stated that while the TMA-N value obtained was 2.25 mg/100 g in the fresh product, it reached 5.86 mg/100g at the end of the storage and showed an increase, as it did in our study, but did not exceed the consumable limit value. Gullian-Klanian et al. (2016) reported that the TMA-N value of red octopus increased from the initial value of 3.03 to 3.48 mg/100 g with storage time. Varlık et al. (2000) determined that the TMA-N value of the marinated meatballs obtained from anchovy was 1.85 mg/100 g at the beginning of the storage and this value increased to 2.85 mg/100g at the end of the storage for 150 days.
Table 2. Changes in sensory assessment scores of study groups during cold storage.
Storage Time (Day) K A B C
0 4.60 ± 0.08Aa 4.60 ± 0.08Aa 4.60 ± 0.08Aa 4.60 ± 0.08Aa
1 4.48 ± 0.05Aa 4.48 ± 0.05Aab 4.50 ± 0.08Aa 4.43 ± 0.22Aa
3 3.95 ± 0.10Ab 4.08 ± 0.10Abc 4.08 ± 0.10Ab 4.03 ± 0.29Ab
5 3.50 ± 0.16Cc 3.75 ± 0.19Bc 4.05 ± 0.17Ab 3.95 ± 0.13ABb
7 3.10 ± 0.34Ac 3.08 ± 0.42Ad 3.45 ± 0.34Ac 3.30 ± 0.26Ac
9 2.50 ± 0.58Cd 2.73 ± 0.68Bd 3.03 ± 0.15Ad 2.98 ± 0.21Ad
11 1.97 ± 0.21Be 2.10 ± 0.17Be 2.33 ± 0.15Ae 2.37 ± 0.15Ae
14 1.75 ± 0.35Ce 1.85 ± 0.21BCef 2.00 ± 0.14ABf 2.15 ± 0.07Ae
16 1.30 ± 0.42Bf 1.45 ± 0.49Bf 1.80 ± 0.28Af 1.85 ± 0.07Af
20 0.70 ± 0.18Cg 0.80 ± 0.23BCg 1.05 ± 0.24ABg 1.15 ± 0.26Ag
T
aş
ka
ya
et
al.
d S
ci
. T
ec
hn
ol, C
am
pin
as, 38(4): 711-718, O
ct.-D
ec. 2018
715/718
715
Storage Time (Day)
TVB-N (mg/100g) TMA-N (mg/100 g) TBA
K A B C K A B C K A B C
0 14.37±1.18Af 14.37 ± 1.18Ad 14.37 ± 1.18Ag 14.37 ± 1.18Ae 0.87 ± 0.07Af 0.87 ± 0.07Ah 0.87 ± 0.07Af 0.87 ± 0.07Af 1.40 ± 0.02Af 1.40 ± 0.02Ah 1.40 ± 0.02Ah 1.40 ± 0.02Ag
1 22.87±0.16Ad 20.06 ± 0.69Bc 19.63 ± 0.42Bf 22.21 ± 0.42Abcd 1.13 ± 0.37Af 1.14 ±0.03Ah 0.85 ± 0.12Af 0.82 ± 0.02Af 4.48 ± 0.07Ae 3.11 ± 0.03Bg 2.06 ± 0.07Dg 2.60 ± 0.02Ce
3 20.29±0.80Be 22.59 ± 0.38Ab 20.66 ± 0.73Bde 21.82 ± 0.72ABcd 2.20 ± 0.15Bde 2.84 ± 0.01Ade 1.96 ± 0.04Cde 2.29 ± 0.09Bc 5.21 ± 0.05Ad 4.09 ± 0.04Bf 2.88 ± 0.13Cf 2.92 ± 0.07Cd
5 22.01±0.49Ade 22.95 ± 0.10Ab 20.10 ± 0.62Bef 22.39 ± 0.65Abcd 2.11 ± 0.06Bde 2.63 ± 0.12Aef 1.85 ± 0.02Ce 1.90 ± 0.08Cd 7.82 ± 0.02Ac 7.41 ± 0.04Be 2.65 ± 0.05Cf 1.95 ± 0.04Df
7 23.01±0.50ABd 24.11 ± 1.57Ab 20.56 ± 0.27Bde 22.31 ± 1.09ABbcd 2.62 ± 0.36ABd 2.98 ± 0.07Acd 2.21 ± 0.08Bcd 2.45 ± 0.02Bbc 9.91 ± 0.08Ab 6.99 ± 0.01Bd 3.56 ± 0.02Ce 3.53 ± 0.03Cc
9 22.72±0.40Bd 24.90 ± 0.56Aab 20.70 ± 0.65Cde 21.75 ± 0.64BCd 1.87 ± 0.02Be 2.30 ± 0.06Ag 2.36 ± 0.07Ac 1.58 ± 0.07Ce 11.74 ± 0.14Aa 6.05 ± 0.03Bc 3.93 ± 0.08Cd 2.69 ± 0.15Dde
11 23.93±0.35ABcd 24.54 ± 0.85Ab 22.40 ± 0.70Bcd 22.27 ± 0.55Bbcd 2.14 ± 0.07ABde 2.40 ± 0.13Afg 2.10 ± 0.24ABcde 1.85 ± 0.18Bd * 9.58 ± 0.08Ab 6.27 ± 0.10Bc 5.62 ± 0.18Cb
14 25.43±0.58Ac 23.89 ± 0.40Bb 22.67 ± 0.38Cbc 23.87 ± 0.44Babc 3.37 ± 0.05Ac 3.11 ± 0.12Bc 2.87 ± 0.08Cb 2.90 ± 0.03Ca * 13.79 ± 0.09Aa 7.00 ± 0.11Bb 5.49 ± 0.07Cb
16 28.57±0.89Ab 27.08 ± 0.62Aa 24.40 ± 0.97Bab 24.07 ± 0.52Bab 4.55 ± 0.11Ab 3.51 ± 0.04Bb 3.58 ± 0.04Ba 3.13 ± 0.07Ca * * 8.35 ± 0.15Aa 6.01 ± 0.08Ba
20 32.00±0.80Aa 27.21 ± 0.06Ba 24.61 ± 0.70Ca 25.20 ± 0.45Ca 5.35 ± 0.06Aa 3.86 ± 0.07Ba 3.42 ± 0.04Ca 2.60 ± 0.06Db * * 8.36 ± 0.07Aa 6.05 ± 0.05Ca
Food Sci. Technol, Campinas, 38(4): 711-718, Oct.-Dec. 2018 716 716/718
Traditional food: hamsi kaygana
Kiermeier (1969) qualified the thiobarbituric acid (TBA) amount indicating the oxidation level to be “very good quality” for 3 mg malondialdehyde/kg, “good quality” for 5 mg malondialdehyde/kg, and “consumable limit values” for 7-8 mg malondialdehyde/kg. On our study, while the TBA value was initially 1.40 mg malondialdehyde/kg in the fresh fish, group K exceeded the consumable limit values on day 7, group A exceeded the consumable limit values on day 11, and group B exceeded the consumable limit values on day 16. The TBA value (6.05 mg malondialdehyde/kg) in group C did not exceed the limit value even on day 20. The effect of antioxidant effects between the groups draws an attention as the amount of lavender increases. Ot was determined that lavender has antioxidant properties and prevents the oxidation in lipids. Statistically significant differences were found among all groups. Kaba et al. (2012), in the study in which they produced anchovy pate, determined the TBA value to be 1.25 mg malondialdehyde/kg in fresh fish, in parallel with our study. At the end of the 8-day storage, the TBA value of the anchovy pate showed an increase but did not exceed the limit values due to the spices it contained. Duyar et al. (2010) determined the TBA value to be 1.09 mg malondialdehyde/ kg in fresh fish, similarly to the value obtained in our study. While Bensid et al. (2014) obtained the TBA value to be 3.08 in fresh anchovy, the TBA values in the groups in which thyme, marjoram, and clove extracts were applied to anchovy were determined to be 8.78 ± 0.60, 4.81 ± 2.0 and 9.73 ± 0.4 mg malondialdehyde/kg, respectively, at the end of the 12-day storage. While Köse et al. (2010) determined the TBA amount in fresh anchovy to be 0.81 ± 0.02 mg malondialdehyde/kg, in the “hamsi kuşu” which is also traditional food prepared from anchovy, they determined the TBA value to be 3.89 ± 0.20 mg malondialdehyde/kg on the 150th day of the storage. The obtained
TBA values are considerably lower than the values obtained during the storage in our study. This is thought to be due to the differences in storage temperatures.
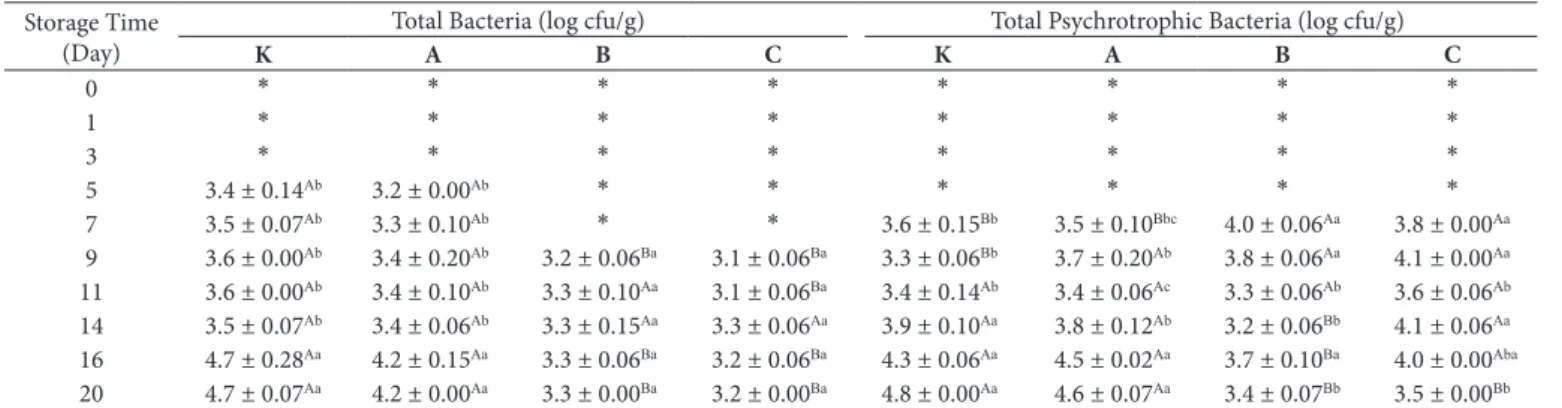
3.5 Microbiological analyses results
Microbiological analyses results were shown in Table 4 collectively. The initial total bacterial load in fresh anchovy fillets used in the study was found to be 4.0 log cfu/g and the
total psychrotrophic bacterial load was found to be 4.5 log cfu/g. Ot was observed that the total bacterial and psychrotrophic bacterial load in the dough prepared for the production of hamsi kaygana increased. The total bacterial and total psychrotrophic bacterial load in hamsi kaygana dough was determined to be 5.0 log cfu/g. This increase is thought to have been caused by the filleting and chopping of the small pieces of anchovies, the addition of other ingredients (green onion, breadcrumbs, egg, and olive oil), and the contamination formed during mixing the dough. However, after the cooking process, it was determined that both the total bacterial and the psychrotrophic bacterial loads fell below the countable values in all groups.
The decrease in the microorganism load arises from the cooking. On the study conducted with “hamsi kuşu” (stuffed and fried anchovies), a traditional food in the Black Sea Region, Köse et al. (2010) stated that the total bacterial and psychrophilic bacterial loads of the cooked samples were below 30 cfu/g. During our study, the microorganism load after the cooking process began to increase again on the later days of the storage. Developments were begun to be observed after the 3rd day in groups K and A; after the 5th day
in groups B and C in terms of the total bacteria, and after the 5th day in all groups in terms of the psychrotrophic bacteria.
Accordingly, it can be said that the high concentration of lavender has an inhibitory effect on the development of the total bacteria, but when we examine the results of the total psychrotrophic bacteria analysis, it can be also said that the effect of lavender is not as much as that on the total bacteria. On day 20, the last day of the storage, while the control group and group A, to which 0.1% lavender was added, got similar values to each other, with 4.7 log cfu/g and 4.2 log cfu/g in terms of the total bacterial load and with 4.8 log cfu/g and 4.6 log cfu/g in terms of the psychrotrophic bacterial load, the total bacteria and psychrotrophic bacteria amounts in groups B and C, to which 0.5% and 1% lavender was added, were found to be 3.3 log cfu/g and 3.2 log cfu/g and 3.4 log cfu/g and 3.5 log cfu/g respectively. During the storage, significant difference was found between control and group A, moreover between group B and group C in terms of total bacteria and psychrotrophic bacterial load (p > 0.05) statistically.
Table 4. Microbiological results of study groups during cold storage.
Storage Time (Day)
Total Bacteria (log cfu/g) Total Psychrotrophic Bacteria (log cfu/g)
K A B C K A B C
0 * * * * * * * *
1 * * * * * * * *
3 * * * * * * * *
5 3.4 ± 0.14Ab
3.2 ± 0.00Ab * * * * * *
7 3.5 ± 0.07Ab
3.3 ± 0.10Ab * *
3.6 ± 0.15Bb
3.5 ± 0.10Bbc
4.0 ± 0.06Aa
3.8 ± 0.00Aa
9 3.6 ± 0.00Ab
3.4 ± 0.20Ab
3.2 ± 0.06Ba
3.1 ± 0.06Ba
3.3 ± 0.06Bb
3.7 ± 0.20Ab
3.8 ± 0.06Aa
4.1 ± 0.00Aa
11 3.6 ± 0.00Ab
3.4 ± 0.10Ab
3.3 ± 0.10Aa
3.1 ± 0.06Ba
3.4 ± 0.14Ab
3.4 ± 0.06Ac
3.3 ± 0.06Ab
3.6 ± 0.06Ab
14 3.5 ± 0.07Ab
3.4 ± 0.06Ab
3.3 ± 0.15Aa
3.3 ± 0.06Aa
3.9 ± 0.10Aa
3.8 ± 0.12Ab
3.2 ± 0.06Bb
4.1 ± 0.06Aa
16 4.7 ± 0.28Aa
4.2 ± 0.15Aa
3.3 ± 0.06Ba
3.2 ± 0.06Ba
4.3 ± 0.06Aa
4.5 ± 0.02Aa
3.7 ± 0.10Ba
4.0 ± 0.00Aba
20 4.7 ± 0.07Aa
4.2 ± 0.00Aa
3.3 ± 0.00Ba
3.2 ± 0.00Ba
4.8 ± 0.00Aa
4.6 ± 0.07Aa
3.4 ± 0.07Bb
3.5 ± 0.00Bb
On another study with hamsi kaygana and different spices, the total bacterial results for control, cumin, rosemary and nettle groups were determined as 1.92 log cfu/g, 2.06 log cfu/g, 1.79 log cfu/g and 2.61 log cfu/g respectively. On the study, it was stated that with a rapid increase after 3th day, all the groups exceeded the consumable limit of the processed food in terms of TMAB in 8th day (> 6log-kob/g) (Emanet, 2010).
On the study of Kuş (2012) conducted using rainbow trout fillets treated with mistletoe and strawflower extracts, it was stated that the strawflower extract reached the limit value of 7 log cfu/g (Elliott et al., 1986) after 3 days, unlike the control and mistletoe, similarly to our study. On another study conducted, while the control and marjoram samples exceeded the limit value on day 6 in terms of the total bacteria and total psychrophilic in cleaned anchovies in the ice prepared with adding extractions obtained from thyme, marjoram and clove at different ratios to water, the thyme and clove groups were determined to last for 3 days more. On the same study, it was determined that the control group got unacceptable sensory values on day 9 and groups, to which thyme, marjoram, and clove were applied, got unacceptable sensory values on day 12 from the panelists. This suggests that the groups deteriorated more quickly in the microbiological than sensory aspect (Bensid et al., 2014).
On different studies conducted, the antimicrobial effects of
Lavandula stoechas plant have been demonstrated and it has been stated that it is especially effective on pathogenic bacteria such as Staphylococcus aureus, Yersinia enterocolitica, E. coli O157:H7
Listeria monocytogenes, Bacillus subtilis, Enterococcus calcium,
and Salmonella (Aydın Duman, 2008; Cherrat et al., 2014).
4 Conclusion
Oncreasing the recognition of locally made and appreciated foods from aquatic products and delivering these products to the people at different points of sales with natural preservatives and storage methods can enable both the spread of different tastes in our country and the increase in the consumption of aquatic products. On our study, it was aimed to reach a more common consumption by providing a pleasant odor and extending the shelf life of “hamsi kaygana”, which is unique to the Black Sea Region, with a natural preservative such as “lavender”. Upon evaluating the results obtained, it was determined that the shelf life of hamsi kaygana is extended by adding lavender. Upon examining the chemical analysis results, it was determined that lavender had a preservative effect on TBA, oxidation indicator and that it especially prevented the exceeding of the consumable limit value up to 11 days. Microbiological results showed that 0.5% and a higher concentration of lavender had a suppressive effect on the increase of the total bacteria and psychrotrophic bacteria load. Furthermore, in terms of the sensory aspect a nicer smelling product was obtained for people who avoid consuming aquatic products because of smell. At the end of the study, it has been revealed that lavender can be used as a natural preservative in aquatic products and that hamsi kaygana can be regarded as a convenience product rather than just being a traditional food.
On the further studies, use of different spices or natural ingredients together with lavender with different formulations,
moreover packaging and storage conditions, in the production of hamsi kaygana, should be evaluated.
Acknowledgements
This work was funded by Muğla Sıtkı Koçman University, Scientific Research Project Office (Project No: MSKU-BAP 13/57).
References
Antonacopoulos, N., & Vyncke, W. (1989). Determination of volatile basic nitrogen in fish: a third collaborative study by the West European Fish Technologists’ Association (WEFTA). Zeitschrift fur Lebensmittel-Untersuchung und -Forschung, 189(4), 309-316. http:// dx.doi.org/10.1007/BF01683206.
Association of Official Analytical Chemists – AOAC. (1984). Official Methods of Analysis of the Association of Official Analytic Chemist
(14th ed.). Washington, DC: AOAC.
Association of Official Analytical Chemists – AOAC. (1995). Official Methods of Analysis of the Association of Official Analytic Chemist
(16th ed., Vol. 2). Washington, DC: AOAC.
Aubourg, S. P. (2001). Damage detection in horse mackerel (Trachurus trachurus) during chilled storage. Journal of the American Oil Chemists’ Society, 78, 857-862. http://dx.doi.org/10.1007/s11746-001-0355-3. Aydın Duman, B. (2008). Bazı tıbbi bitki ve baharatların gıda patojenleri üzerine antibakteriyel etkisinin araştırılması. Kafkas Üniversitesi Veteriner Fakültesi Dergisi, 14(1), 83-87.
Bensid, A., Ucar, Y., Bendeddouche, B., & Özogul, F. (2014). Effect of the icing with thyme, oregano and clove extracts on quality parameters of gutted and beheaded anchovy (Engraulis encrasicolus) during chilled storage. Food Chemistry, 145, 681-686. PMid:24128531. http://dx.doi.org/10.1016/j.foodchem.2013.08.106.
Bligh, E. G., & Dyer, W. J. (1959). A rapid method of total lipit extraction and proficiation. Canadian Journal of Biochemistry and Physiology, 37(8), 911-917. PMid:13671378. http://dx.doi.org/10.1139/o59-099. Boland, F. E., & Paige, D. D. (1971). Collaborative study of a method for the determination of trimethylamine nitrogen in fish (Division of Food Chemistry and Technology, Food and Drug Administration).
Journal of AOAC International, 54(3), 725-727.
Boran, G., Boran, M., Karaçam, H. (2008). Seasonal changes in proximate composition of anchovy and storage stability of anchovy oil. Journal of Food Quality, 31(4), 503-513.
Brugiapaglia, A., Destefanis, G. (2012). Onfluence of the housing system on meat quality of double muscled Piemontese young bulls. Livestock Science, 145, 73-8.
Cherrat, L., Espina, L., Bakkali, M., Pagán, R., & Laglaoui, A. (2014). Chemical composition, antioxidant and antimicrobial properties of Mentha pulegium, Lavandula stoechas and Satureja calamintha
scheele essential oils and an evaluation of their bactericidal effect in combined processes. Innovative Food Science & Emerging Technologies, 22, 221-229. http://dx.doi.org/10.1016/j.ifset.2013.12.016. Duyar, H. A., Gargaci, A., & Keskin, O. (2010). Buzlanarak depolanan hamsi
baliginin (Engraulis engrasicolus L., 1758) buzdolabi kosullarinda (4±1°C) raf omrunun belirlenmesi. On 1. Ulusal Hamsi Calistayi: Surdurulebilir Balikcilik, Trabzon, Turkey.
Food Sci. Technol, Campinas, 38(4): 711-718, Oct.-Dec. 2018 718 718/718
Traditional food: hamsi kaygana
Köse, S., Gökoğlu, N., Tokay, S. M., Baygar, T., Özer, N. P., Çolakoğlu, F. A., Meriç, İ., & Alçiçek, Z. (2010). Current situation and problems of the sea product processing sector and solution recommendations. On VII Turkish Agricultural Engineering Technical, Ankara, Turkey. Kuş, B. (2012). Altınotu ve ökseotu bitki ekstrelerinin alabalık filetosu
üzerindeki antimikrobiyal ve antioksidan etkilerinin incelenmesi. Sarıçam: Çukurova Üniversitesi Fen Bilimleri Enstitüsü.
Manthey, M., Karnop, G., & Rehbein, H. (1988). Quality changes of European catfish (Silurus glanis) from warmwater aquaculture during storage on Oce. International Journal of Food Science & Technology, 23(1), 1-9. http://dx.doi.org/10.1111/j.1365-2621.1988.tb00543.x. Maturin, L. J., & Peeler, J. T. (1998). Aerobic plate count. U.S. Food and Drug Administration. Bacteriological analytical manual (chap. 3). Silver Spring: U.S. Food and Drug Administration.
McKee, L. H. (1995). Microbial contamination of spices and herbs.
Lebensmittel-Wissenschaft + Technologie, 28(1), 1-11. http://dx.doi. org/10.1016/S0023-6438(95)80004-2.
Nair, M. K. M., Vasudevan, P., & Venkitanarayanan, K. (2005). Antibacterial effect of black seed oil on Listeria monocytogenes.Food Control, 16(5), 395-398. http://dx.doi.org/10.1016/j.foodcont.2004.04.006. Ozpolat, E., & Duman, M. (2017). Effect of black cumin oil (Nigella
sativa L.) on fresh fish (Barbus grypus) fillets during storage at 2 ± 1 °C. Food Science and Technology (Campinas), 37(1), 148-152. Şengör, G. F., Kalafatoğlu, H., & Gün, H. (2004). The determination
of microbial flora, water activity and chemical analyses in smoked, canned mussels (Mytilus galloprovincialis, L.). Turkish Journal of Veterinary and Animal Sciences, 28, 793-797.
Shahidi, F., & Cadwallader, K. R. (1997). Flavor and lipid chemistry of seafoods. Washington, DC: American Chemical Society.
Sikorski, Z. E., Kolakowska, A., & Burt, J. R. (1989). Post harvest biochemical and microbial changes. seafood: resources, nutritional composition and preservation. Boca Raton: CRC Press.
Smichi, N., Abdelmalek, B. E., Kharrat, N., Sila, A., Bougatef, A., Gargouri, Y., & Fendri, A. (2017). The effects of storage on quality and nutritional aspects of farmed and wild sea bass (Dicentrachus labrax) muscle: On vitro oils digestibility evaluation. Fisheries Research, 188, 74-83. http://dx.doi.org/10.1016/j.fishres.2016.12.003. Tarladgis, B. G., Watts, B. M., Younathan, M. T., & Dugan, L. Jr. (1960).
Distillation method for the determination of malonaldehyde in rancid foods. Journal of the American Oil Chemists’ Society, 37(1), 44-48. http://dx.doi.org/10.1007/BF02630824.
Türkiye İstatistik Kurumu – TÜİK. (2013). Su Ürünleri İstatistikleri. Ankara: T.C. Gıda Tarım ve Hayvancılık Bakanlığı.
U.S. Food and Drug Administration – FDA. (1998). Bacteriological analytical manual. Silver Spring: U.S. Food and Drug Administration. Varlık, C., Erkan, N., Metin, S., Baygar, T., & Özden, Ö. (2000). Marine balık köftesinin raf ömrünün belirlenmesi. Turkish Journal of Veterinary and Animal Sciences, 24, 593-597.
Yerlikaya, P., & Gökoğlu, N. (2009). Effects of previous plant extract treatment on sensory and physical properties of frozen bonito (Sarda sarda) fillets. Turkish Journal of Fisheries and Aquatic Sciences, 10, 341-349.
Zuzarte, M., Goncalves, M. J., Cavaleiro, C., Cruz, M. T., Benzarti, A., Marongiud, B., Maxia, A., Piras, A., Salgueiroa, L. (2013). Antifungal and anti-inflammatory potential of Lavandula stoechas and Thymus herba-barona essential oils. Industrial Crops and Products, 44, 97-103. Emanet, G. (2010). Determination of microbiological quality of a local
dish ‘hamsi kaygana’ and the effects of dried herb and spices (Master’s thesis). Fisheries Faculty, Ege University, Bornova. (On Turkish). Ermiş, R. B., Temel, U. B., & Kam, Ö. (2007). Evaluation of the bleaching
treatment on fluorosed teeth with L*a*b* color space system: case report. Hacettepe Dişhekimliği Fakültesi Dergisi, 31(1), 36-41. European Commission – EC. (1995). Commission decision 95/149/
EC of 8 March 1995 fixing the total volatile basic nitrogen (TVB-N) limit values for certain categories of fishery products and specifying the analysis methods to be used. Official Journal of the European Communities, L097, 84-87.
Arias, M. T., Alvarez Pontes, E., Linares, M. C., Garcia-Fernandez, M. C., & Sanchez-Muniz, F. J. (2003). Grilling of sardine fillets. Effects of frozen and thawed modality on their protein quality.
Lebensmittel-Wissenschaft und -Technologie, 36, 763-769.
Gökoğlu, N. (2002). Su ürünleri işleme teknolojisi. Antalya: Su Vakfı Yayınları.
Gökoğlu, N., Topuz, O. K., & Yerlikaya, P. (2009). Effects of pomegranate sauce on quality of marinated anchovy during refrigerated storage.
Lebensmittel-Wissenschaft + Technologie, 42(1), 113-118. http:// dx.doi.org/10.1016/j.lwt.2008.04.007.
Gokoglu, N., Yerlikaya, P., & Cengiz, E. (2004). Effects of cooking methods on the proximate composition and mineral contents of rainbow trout (Oncorhynchus mykiss). Food Chemistry, 84(1), 19-22. http://dx.doi.org/10.1016/S0308-8146(03)00161-4.
Gullian-Klanian, M., Sánchez-Solís, M. J., Terrats-Preciat, M., Delgadillo-Díaz, M., & Aranda, J. (2016). Quality indicators and shelf life of red octopus (Octopus maya) in chilling storage. Food Science and Technology (Campinas), 36(2), 304-312. http://dx.doi. org/10.1590/1678-457X.0077.
Güner, S., Dinçer, B., Alemdağ, N., Çolak, A., & Tüfekçi, M. (1998). Proximate composition and selected mineral content of commercially important fish species from the Black Sea. Journal of the Science of Food and Agriculture, 78(3), 337-342. http://dx.doi.org/10.1002/ (SOCO)1097-0010(199811)78:3<337::AOD-JSFA122>3.0.CO;2-A. İnanlı, A. G., Karaton, N., & Çoban, Ö. E. (2011). Sensorial, chemical
and microbiological quality of anchovy cake. African Journal of Biotechnology, 10(48), 9870-9874.
Ozquierdo, P., Torres, G., Allara, M., Barros, J., Delgado, P., & Añez, J. (2001). Efecto de tres métodos de cocción en la composición proximal y el perfil de ácidos Grasos del atún (Thunnus thynnus).
Revista Cientifica - FCV-LUZ, 11, 367-372.
Kaba, N., Yücel, S., Çorapcı, B., Ozer, O., & Eryasar, K. (2012). Shelf life of anchovy (Engraulis engrasicolus, L.1758) patties stored at 4°C.
Akademik Gıda, 10(4), 19-23.
Kiermeier, F. (1969). Tierische Lebensmittel Eier, Fleisch, Fisch, Buttermilch. On J. Schormüller, Handbuch der lebensmittel chemie
(Band OOO/2 Teil, pp. 1341-1392). Berlin: Springer-Verlag.
Kinsella, J. E. (1987). Sea foods and fish in human health and disease. New York: Marcel Dekker.
Kocatepe, D., Hülya, T., Taşkaya, G., Kaya, Y., Erden, R., & Erdoğdu, F. (2011). Effects of cooking methods on the proximate composition of black sea anchovy (Engraulis encrasicolus Linnaeus 1758). GIDA, 36(2), 71-75.