Abstract
The concept of Precision Agriculture is usually associated with the usage of high-end technology equipment (hardware or software) to evaluate or monitor the conditions of a determined portion of land, adjusting afterwards the production factors, like seeds, fertilizers, pesticides, growing regulators, water, according to differential detected characteristics. This paper describes an algorithm developed to analyze and process images to recognize fruits, particularly peaches, and calculate it dimensions, like volume and weight. The recognition of peaches on their natural conditions on trees depends on several spatial- and time-variable parameters and requires complex segmentation algorithms. The proposed algorithm applies image segmentation for extraction of characteristics such as color and shape. These characteristics were used to train a classification method through a Support Vector Machine (SVM) to improve the recognition rate of fruits. The algorithm is designed to acquire images with a high-resolution camera installed in a drone that will fly between the tree lines. The production prediction of 29.3 tons per hectare was obtained based on volume and relation weight/volume calculated for the recognized peaches. An overall precision of 72% was achieved for the prediction rate of peaches in orchards (808 trees/ha). This is the first study regarding the application of these concepts under orchard trees aiming the production prediction along the fruit maturation. Other useful future applications are foreseen in orchard trees, related not only to production prediction, for this type of algorithm.
Fruit recognition and classification based on SVM
method for production prediction of peaches
–
Preliminary study
Tiago M. Pereira1, Pedro D. Gaspar1,2 *, Maria Paula Simões3,4
1 University of Beira Interior, Covilhã, Portugal;
2 C-MAST - Centre for Mechanical and Aerospace Science and Technologies, Covilhã, Portugal; 3 Polytechnic Institute of Castelo Branco/ School of Agriculture, Castelo Branco, Portugal; 4 CERNAS, Research Center for Natural Resources, Environment and Society
Keywords: Precision Agriculture; Support vector machine (SVM); Production prediction;
Fruit detection; Prunus persica.
INTRODUCTION
The concept of Precision Agriculture is usually associated with the usage of high-end technology equipment (hardware or software) to evaluate or control the conditions of a determined portion of land, applying afterwards factors of production according to the needs that can be seeds, fertilizers, phytopharmaceuticals, growing regulators, water, etc. Precision Agriculture is usually associated with two generic objectives: Revenue improvement for farmers and the environment impact caused by the farming process. The first objective can be reached by several distinct ways, which complement each other. The most common are i) the reduction of production cost; ii) productivity increase; iii) better quality; iv) better price. The accomplishment of the second objective is related to the rigorous control of production factors application (mainly chemicals, given the negative environmental externalities normally associated with them), that must be done accordingly to the needs of each plant (Coelho & Silva, 2009).
The fruit growers rely on production prediction to manage all aspects of harvesting, marketing, and most important, of supply contracts. Usually, fruits are visually count on a random number of selected trees. Sometimes, gauge measurements support the fruits count. The accuracy of the production estimate increases with the sample size, but requires a greater number of people and time, which translates into higher costs. After the conclusion of the supply contract, in case of the producer not being able to supply the contracted quantity, he/she may have to reimburse the distributor (additional cost), contributing to a deterioration of the relationship between Producer and Buyer. A more assertive production prediction can help to prevent these situations, develop support systems such as harvest
insurance, and even contribute to the development of integrated farm management systems and precision of technical management like fertilization, thinning and irrigation. In this sense, the work presented in this paper is part of a system capable of helping to overcome this problem. The objective is to create a system, equipped with an algorithm of analysis and image processing that characterizes the tree, distinguishes the fruits and determines their dimensions, volume and weight. The correct production prediction allows a better management of the load, being the fruit growers able to negotiate the weight and the quality (size) of the fruit in the supply contracts with greater confidence. Higher profitability of production can be achieved with this advantage. Additionally, it promotes the relationship between producer and buyer and contributes to the reduction of food waste, because the fruit can be used for another purpose, such as pulps and jams.
Several studies related to fruit recognition are available in the scientific literature. For instance, Jiménez et al. (1999), Zhao et al. (2005), Ji et al. (2012), Wei et al. (2014) and Maldonado & Barbosa (2016) describe image segmentation methods for fruit recognition. Jiménez et al. (1999) describes an automatic fruit recognition system that can recognize spherical fruits in natural conditions taking into account shadows, bright areas, occlusions and overlapping fruits. A laser rangefinder provides data concerning the range/attenuation of the sensed surface. The recognition system completes the results of the laser range-finder model with a dual color/shape analysis algorithm to locate the fruit. Afterwards, the three-dimensional position of the fruit, radius and the reflectance are obtained. However, the tests were not performed in real orchard trees. Additionally, the range of the image is very narrow, being able only to recognize a small percentage of the total number of fruits in a tree. Zhao et al. (2005) presents a vision-based algorithm to locate apples in a single image. Several colors situations were considered: on-tree contrast between red and green apples as well as green apples in tree with poor contrast. The features considered for edge detection were redness and texture. The location of apples in the image plane were determined by area thresholding followed by circle fitting. Laplacian filters were implemented to facilitate the separation of apples from the foliage. The detection tests were accurate for the clearly visible fruits. However, it must be stated that there are many apples in trees partially occluded. That situation, a usual one in real orchards, was not evaluated. Ji et al. (2012) describes an automatic recognition vision system to be used by apples harvesting robot. A CCD (charge-coupled device) color camera was used to capture the apple images. Then, an industrial computer was used to process the images for recognizing fruit. A vector median filter is applied to remove the noise of apples’ color images. An image segmentation method based on region growing and color feature is investigated. After extracting color and shape features of the image, a new classification algorithm based on support vector machine (SVM) for apple recognition is introduced to improve recognition accuracy and efficiency. Even though the good results provided by the algorithm, it must be stated that results were obtained with close range pictures. Wei et al. (2014) describes an automatic method of fruit object extraction under complex agricultural background to be used by vision system of fruit picking robots. The method is based on improving the Otsu threshold algorithm using a new feature in OHTA color space. Color features are extracted in OHTA color space and then used as input for the Otsu threshold algorithm, which calculates automatically the segmentation threshold value. Four kinds of fruit images are selected to validate the automatic extraction method. The fruit objects are automatically extracted with this method and output are shown as binary images. The accuracy rate of this algorithm is over 95%. However, the 80-fruit sample size uses close range pictures, mainly with no obstruction. Maldonado & Barbosa (2016) present a study of automatic counting system for green fruits in orange trees using digital images. Based on the known correlation between the number of visible fruits in a digital image and the total of fruits present in an orange tree, a new method for green fruit feature extraction was developed. It combines techniques such as color model conversion, thresholding, histogram equalization, spatial filtering with Laplace and Sobel operators and Gaussian blur. In addition, an algorithm to recognize and count the fruits was built and tested. A 3% detection rate of false positives was determined for images acquired in good conditions. However, in general, images captured in fruit trees and agriculture scenarios are not always associated with good conditions. Thus, tests of pictures collected under natural conditions were not performed.
The huge amount of applications allows other studies to be performed, for example, shape evaluation of fruit through neural networks (Morimoto et al., 2000) and fruit classification based on the external quality (Leemans et al., 2002). Other algorithms have been proposed to be implemented in real life robots. Bac et al. (2014) developed a robotic arm for fruit harvesting with collisions with vegetation avoidance. Wei et al. (2012) describes a real-time system, based on an SVM, for a Fuji apple-picking robot. The main objective was
to create a system insensible to lightning conditions change. The image is pre-processed to clear the background and enhance the foreground. In addition, an algorithm based on region growing is applied. Afterwards, shape and color features are extracted. Then, a new classification algorithm based on SVM for apple recognition is introduced to improve recognition accuracy and efficiency. Zhang & Wu (2012) present another example of SVM usage for fruit classification. Before the SVM usage, some processes are applied to the pictures, such as background removal, color, shape and texture characteristics extraction and principal component analysis. Finally, three different types of SVM where created, Winner-Takes-All SVM, Max-Wins-Voting SVM, and Directed Acyclic Graph SVM. A classification method based on an SVM is proposed in this study to improve the recognition of peaches in trees. A pre-processing process is applied to extract color and shape characteristics from the images. The color characteristics are extracted from the HSV color space. The shape characteristic is obtained with a Sobel operator. A roundness metric is used in order to characterize the segmented shapes. Afterwards, a binary classification SVM is applied to recognize peaches. Then, an estimation of production in tons by hectare is calculated using volume and density variables based on the recognized peaches.
MATERIALS AND METHODS Data collection
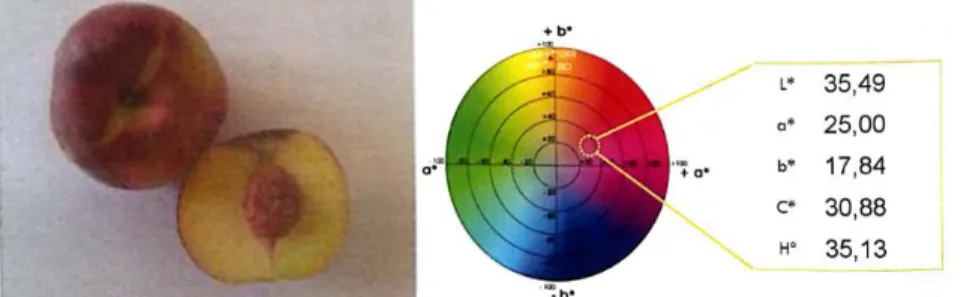
The pictures were collected under natural conditions using a 24-bit NIKON D3200 camera. The trees had a lot of foliage, which in turn, provided high levels of occlusion and shadows, hindering the process of image segmentation. The data (pictures) was collected in a conventional Sweet Dream orchard in the Beira Interior region (Portugal). This yellow-fleshed freestone cultivar has a very large size and features a low-acid sweet flavor. It has full skin color (bright red over yellow). The Sweet Dream peach is harvested by the end of July, beginning of August. Fig. 1 shows the visual and colorimetric analysis of this cultivar (Simões, 2016).
Figure 1. Visual and colorimetric analysis of Sweet Dream peach.
The Sweet Dream peaches have an average diameter of 9 cm and it weight ranges from 350 g to 400 g. The field tests were performed in two different days: July 5th, 2017 (Day #1) and July 20th, 2017 (Day #2). Thus, two SVM models were obtained, one for each case under study in order to obtain the most accurate results. Unlike most studies, conditions were not established to find only one set of peaches in this work. Other reduced set of samples were obtained from other orchard with Diamond Princess cultivar. These results were used to validate the model for other cultivars. As the main goal of this study is to obtain an approximate estimate of the production, no special conditions were applied for images segmentation. This means that all peaches were accounted, independently of color, shape and size.
Segmentation Process
An algorithm can be described as a group of needed processes to solve a problem. The proposed algorithm is based on that assumption, meaning that all the peach images go through various segmentation stages in order to extract the needed factures to reduce the influence of the adversities found in natural conditions. The software used to develop this algorithm was MATLAB. MATLAB is a high-performance language for technical computing. It features a family of add-on application-specific solutions called toolboxes that allow applying specialized technology (MATLAB, 2014a).
Color Threshold
Hot colors are related to peach fruit. Everything else (pictures background), tree, ground, leaves and even the sky is not associated to the same colors as the fruit. Thus, color is the main characteristic of segmentation.
The color threshold section of the algorithm was created using the MATLAB toolbox Color Threshold. This toolbox allows the user to work in various color spaces, such as RGB, HSV, YCbCr and L*a*b*. HSV, standing for Hue, Saturation and Value, was the chosen color space for the color segmentation, because it allows a more precise definition of the characteristics required for a more accurate threshold (MATLAB, 2014b). Fig. 3 shows the application of the MATLAB toolbox using the HSV plane. Even though color is the main segmentation characteristic, it does not allow a clear separation of the fruits from the background. Some non-fruit objects, such as branches, may be visible after segmentation due to similarities in color (MATLAB, 2014b).
Image Segmentation
A cleaner version of the image was obtained applying other segmentation processes, after extracting the color characteristics with the MATLAB toolbox (MATLAB, 2014b). Morphological operations of opening and closing were also applied to remove noises and small objects. Fig. 3 (a) shows a peach and a branch overlapping and within the same color spectrum. The algorithm detects the peach and the branch as a single object. However, the remainder image has run out of small objects or noise. The code excerpt used to make these transformations is shown below.
bw = bwareaopen(I2,3500); %remove objects < 3500 pixels;
se = strel('disk',1);
bw = imclose(bw,se); %fill small spaces;
bw = imdilate(bw,se);
bw = imfill(bw,'holes'); %fill space to use regionprops function;
Afterwards, a Sobel operator was used in the algorithm for edge detection. This operator has the advantage of providing, simultaneously, differentiation and smoothing effects (Gonzales & Woods, 2002; Pratt, 2007; Maldonado & Barbosa, 2016).
Roundness metric
The roundness metric, the probability of an object being round, is one of the characteristics used to train the SVM. As previously shown by the Sobel operator, it is possible to obtain contours of objects in the pictures, specifically in this case, fruits. MATLAB function, bwboundaries, similar to the Sobel operator, is used to calculate contours (Gonzalez et al., 2004). Therefore, a roundness metric for each object was determined using Equation 1 and the MATLAB function.
𝑀𝑒𝑡𝑟𝑖𝑐 = 4×𝜋×𝐴𝑟𝑒𝑎
𝑃𝑒𝑟𝑖𝑚𝑒𝑡𝑒𝑟2 (1)
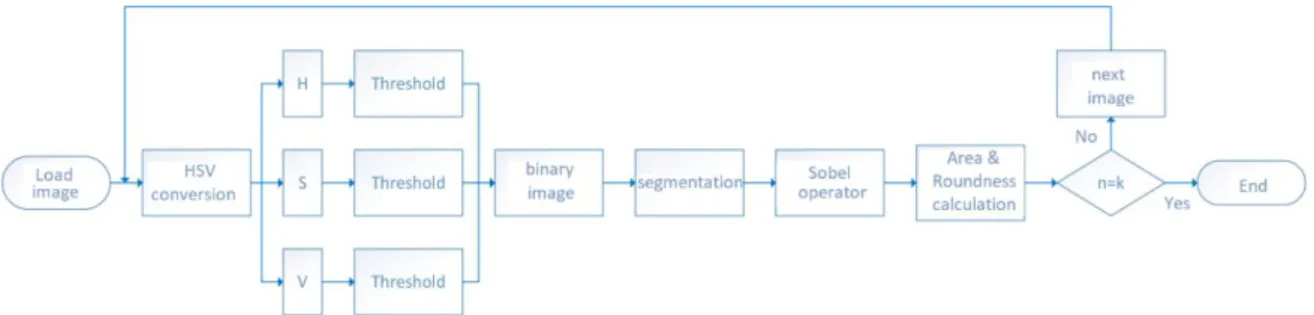
Figure 2 shows the flowchart of the algorithm described above. A conditional block was added, where k is the number of images in order to automate the process.
Figure 2. Flowchart of the algorithm of image transformations
Support vector machine (SVM) model
The support vector machine (SVM) is a generalization of another rather simple and intuitive classifier, the maximum margin classifier. This classifier searches for a hyperplane, which (in the two-dimensional case) corresponds to a line that better separates the observations of the different classes, dividing a space of any dimension greater than 1 into two regions. A hyperplane can easily be defined by equating to zero a linear equation with a weighting coefficient for each dimension. For any point located in this multidimensional space, it is easy to verify in which of the regions it is located, by just replacing the values of
their coordinates and factors, and check if the resulting value is higher or lower than zero. In addition, it is possible to estimate a degree of confidence, given the distance between the observation to be classified and the hyperplane, i.e. as the distance from the hyperplane increase, greater the confidence with which one can claim to belong to the corresponding region class (Casella et al., 2001). However, which should be the criterion to choose a hyperplane that satisfies an optimal separation of the data? An obvious choice is the maximum margin hyperplane, that is, the separator hyperplane that maximizes the distance between the hyperplane itself and the closest observations of each class. By definition, the margin is inversely proportional to the weighting factors of each dimension. So, by minimizing the weighting factors, the margin is maximized. Thus, the training of this classifier consists of a nonlinear optimization problem, typically solved through Karush-Kuhn-Tucker conditions using Lagrange multipliers (Hastie et al., 2001). In real classification problems, it is unusual to find a separator hyperplane, due to either noise or non-linearity of data. In cases where the data are not linearly separable, the concept of the maximum margin classifier can be adapted by adopting a "soft margin", tolerating the presence of some observations of a given class in the region associated with the opposite class. The SVM, which can be called the smooth margin classifier, adopts exactly this concept. The support vectors correspond to the observations closest to the decision boundary, directly influencing their location. The optimization problem is solved in the same way as for a maximum margin classifier, however, in addition to maximize the distance between the hyperplane and the observations, margin violation is penalized with a gap variable. The gap variable for each observation indicates how far it is from the margin or the hyperplane if it is located on the wrong side of the boundary. In addition, a maximum value is defined for the sum of the gap variables, and it is possible to control how tolerant of violations is the margin.
The roundness metric is a characteristic used to train the SVM. The area of the object was the other characteristic chosen to train the SVM. This characteristic is the best way to separate what color segmentation cannot. As shown in Fig. 3, a picture obtained in the fieldwork, there is an incredible excess of leaves in the peach tree. As expected, some of the leaves are within the color threshold chosen, which means they will not be segmented out of the picture. Area and roundness metric combined allows separating peaches from leaves more precisely, since leaves will usually have lower area values and in most cases, lower roundness metric values.
(a) Fieldwork picture. (b) Picture segmentation.
Figure 3. Example of a fieldwork picture and its segmentation.
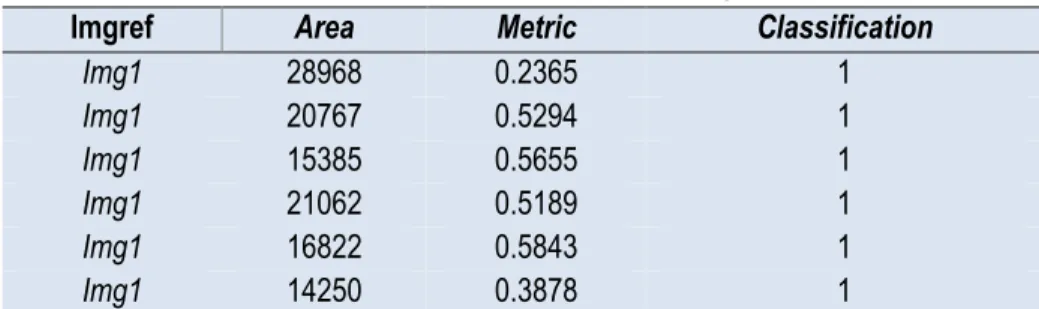
Table 1 shows the area and metric correspondence for the example shown in Fig. 3. Each row in Table 1 corresponds to a training image that can be classified as “Not peach” = 0, or “Peach” = 1. The column “Classification” is filled in manually. This column indicates the SVM, which training images correspond to peaches or non-peaches.
Table 1. Area and roundness metric correspondence for Figure. 5
Imgref Area Metric Classification
Img1 28968 0.2365 1 Img1 20767 0.5294 1 Img1 15385 0.5655 1 Img1 21062 0.5189 1 Img1 16822 0.5843 1 Img1 14250 0.3878 1
Area and roundness are normalized between minimum and maximum values in order to be limited to values between 0 and 1. After normalizing data and selecting the training and test sets, the SVM model was created and the production prediction was performed for later comparison of results. It was chosen a binary classification SVM due to the characteristics of the training sets and what each one can represent. The kernel function adopted for this SVM was a second-degree polynomial function, or quadratic, because it provided the best results for this case study. The flowchart of the final algorithm (image transformations + SVM) is shown in Fig. 4.
Figure 4. Flowchart of the final algorithm (image transformations + SVM).
RESULTS AND DISCUSSION
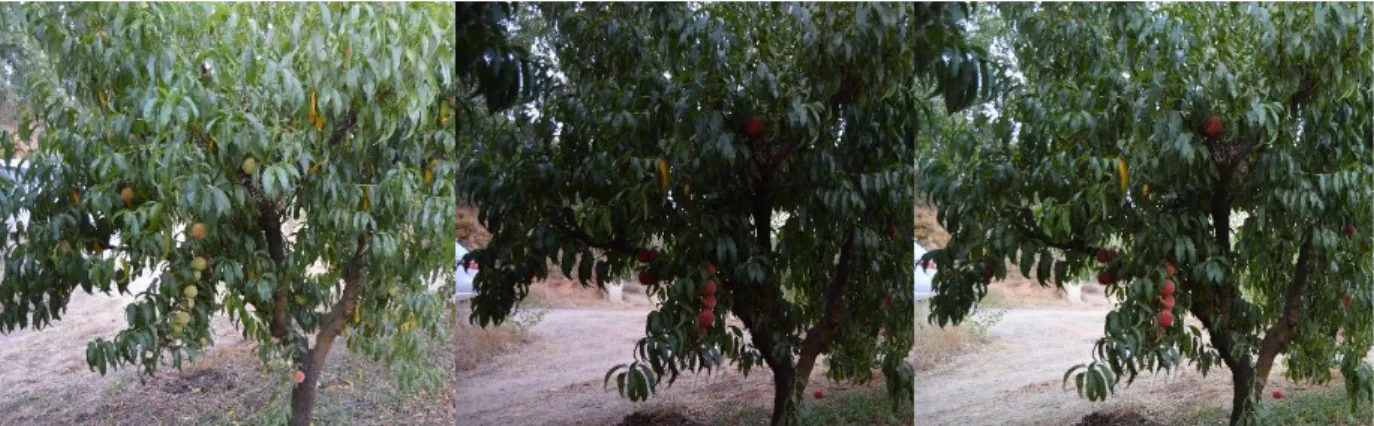
As stated above, two sets of images related to Sweet Dream peaches were analyzed. The studies use pictures obtained in two different days at dawn (Day #1: 2017 July 5th; Day #2: 2017 July 20th). To minimize these differences in brightness on both days, the pictures were taken before sunrise (around 7:00 am). Although, due to the change of the sunrise time and different cloud conditions in the sky, the luminosity was different. This variation of luminosity caused great difficulties during images segmentation. Figure 5 and Figure 6 show the luminosity variations and the differences obtained in the image segmentation.
(a) Image collected in Day #1. (b) Image collected in Day #2. (c) Brightness correction of b) Figure 5. Brightness variation in images of Cultivar #1.
a) Segmentation of Fig. 5 a) b) Segmentation of Fig. 5 b). c) Segmentation of Fig. 5 c). Figure 6. Variation of segmentation results for the images.
Production prediction
The Sweet Dream cultivar has very specific characteristics, mainly of size. It has a weight-to-diameter ratio that can easily reach 400 g and 9 cm respectively (Simões, 2016). For the calculation of the production prediction, 400 g/fruit, 9 cm of diameter and a density of 1.05 g/cm3 were used based on the average characteristics of this cultivar and also on the
weight-to-diameter ratio presented by Simões (2016). It was selected the upper limit of values for weight and diameter to balance the obstruction caused by excessive foliage.
corresponding to 100 plants, total area of the cultivar is 1237.5 m2. The reference interval for
the production predictions to be calculated is 20 tonnes/ha to 58 tonnes/ha, based on the historical orchard production data (Simões & Carvalho, 2008). Considering an average diameter of D = 9 cm for these peaches, its volume is V = 381.7 cm3. Additionally, considering
a weight of P = 400 g, the density of the peach is = 1.05 g/cm3. The predicted weight value
given by the SVM for 10% of the sample is 296,980 g. So, the prediction for the total sample is 2.97 tonnes. The previous prediction was obtained based on a calibration factor to attenuate the influence of the field depth. On the first day of data collection an object of known dimensions was attached to the bole of the tree. A mathematical equation was then applied to make a conversion of how many pixels corresponded to that object dimensions from that distance.
𝐶𝑎𝑙𝑖𝑏𝑟𝑎𝑡𝑖𝑜𝑛 𝐹𝑎𝑐𝑡𝑜𝑟 =𝐾𝑛𝑜𝑤𝑛 𝐷𝑖𝑚𝑒𝑛𝑠𝑖𝑜𝑛
𝑁𝑢𝑚𝑏𝑒𝑟 𝑜𝑓 𝑃𝑖𝑥𝑒𝑙𝑠 (2) As the collected photographs did not correspond to the total field of orchard, it was necessary to calculate the proportion of terrain photographed to later estimate the total area. 82 plants of the 100 plants were photographed. Thus, the area of the orchard can be calculated using the compass value: A = 1014.75 m2.
Finally, with all the necessary data calculated, it is possible to estimate the production prediction for one hectare: PPrediction = 29.3 tonnes/ha, within the range of values presented
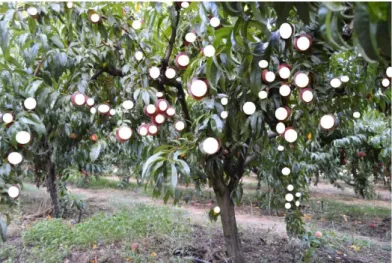
previously. The manual count of the peaches was performed in the image shown in Figure 7 to determine the theoretical production and verify the prediction.
Fig. 7. Manual counting of peaches.
Assuming that the number of peaches counted, 62 peaches, correspond only to one side of the tree, this number was multiplied by two to get a more accurate approximation of the real number of peaches produced by each plant. Considering the weight of 400 g/fruit, the weight of the fruits in each tree, Ptree, was determined and multiplied by the number of trees/ha
(808 plants/ha). The total theoretical production is given:
𝑃𝑡𝑜𝑡𝑎𝑙= 49.6 𝑘𝑔/𝑡𝑟𝑒𝑒 ∙ 808 𝑡𝑟𝑒𝑒/ℎ𝑎 ⇔ 𝑃𝑡𝑜𝑡𝑎𝑙= 40.1 tonnes/ha (3) The results obtained by the scientific studies presented in the literature review are like those obtained in the present study. However, as mentioned previously, the characteristics of the orchards where the fieldwork of these studies was performed are different from those presented in our study. In the studies exposed by different authors, the image segmentation is either applied to look for very specific characteristics, or fruits are placed on flat surfaces of solid background color (without unnecessary information), or photographs are taken with small amplitude in a much more localized way, looking for fruits unobstructed by leaves or branches. In our case study, the conditions are totally different.
The present study proposes a vector support machine for fruit localization in the tree. Fruits in tree imply natural conditions. All the collected images were captured under natural contrasts and luminosities, without focusing on a specific part of the plant, but trying to capture as many fruits as possible, in order to later use the SVM to identify all possible peaches. As result, the SVM range to classify as peach or not peach is much wider, causing a slight reduction in the recognition rate, which ranges from 60% to 72% between the different case studies. However, and considering all the conditions set forth herein, the
results are within the range expected for the followed approach and constraints.
The practical and theoretical predictions for the production of Sweet Dream cultivar were presented. The value of the prediction obtained by the SVM was 29.3 tonnes/ha. Considering the range of production values, between 20 and 58 tonnes/ha, the prediction obtained by the algorithm is validated.
CONCLUSIONS
The main goal of this study is to create an algorithm capable of recognize peaches in a natural environment to estimate a production prediction of an orchard. The main objective of the algorithm is to be able to distinguish fruits from every other element present in the picture. The pictures collected in natural environment of peach trees are subjected to various segmentation processes. In a first stage and pre-processing is applied using color threshold, mathematical morphologic operations and some contours detection. After the extraction of the needed characteristics, a classification method based on an SVM is applied to recognize the peaches in the tree. The results obtained with an average hit rate of 72% are considered valid, based on all the adversities found, such as poor lightning conditions, excess leaves causing greater obstruction and other constraints. The result obtained for production prediction was 29.3 tonnes/ha, which is within the historical values from 20 tonnes/ha to 58 tonnes/ha obtained by the fruit growers (Simões & Carvalho, 2008). The theoretical calculation of the production was 40.1 tonnes/ha.
ACKNOWLEDGEMENTS
This research work is part of project "PrunusBOT – Sistema robótico aéreo autónomo de pulverização controlada e previsão de produção frutícola", n.º PDR2020-101-031358, funded by Rural Development Program of the Portuguese Government - Programa de Desenvolvimento Rural (PDR 2020), Portugal 2020.
Literature cited
Bac, C.W., Hemming, J., &, Van Henten, E.J. (2014). Stem localization of sweet-pepper plants using the support wire as a visual cue. Computers and Electronics in Agriculture, 105, 111-120.
Coelho, J.P.C, &, Silva, J. R. M. (2009). Agricultura de Precisão, In Agricultura de Precisão, 1ª ed. Lisboa, Portugal: AJAP, 2009, pp. 2-9. (in Portugese)
Jiménez, A.R., Jain, A.K., Ceres, R., &, Pons, J.L. (1999). Automatic fruit recognition: a survey and new results using Range/Attenuation images. Pattern Recognition, 32, 1719-1736.
Leemans, V., Magein, H., &, Destain, M.-F. (2002). On-line Fruit Grading according to their External Quality using Machine Vision. Biosystems Engeneering, 83, 397-404.
Maldonado Jr, W., &, Barbosa, J. C. (2016). Automatic green fruit counting in Orange trees using digital images. Computers and Electronics in Agriculture, 127, 572-581.
Morimoto, T., Takeuchi, T., Miyata, H., &, Hashimoto, Y. (2000). Pattern recognition of fruit shape based on the concept of chaos and neural networks. Computers and Electronics in Agriculture, 26, 171-186.
Ji, W., Zhao, D., Cheng, F., Xu, B., Zhang, Y., &, Wang, J. (2012). Automatic recognition vision system guided for apple harvesting robot. Computers & Electrical Engineering, 38(5), 1186-1195.
Wei, X., Jia, K., Lan, J., Li, Y., Zeng, Y., &, Wang, C. (2014). Automatic method od fruit object extraction under complex agricultural background for vision system of fruit picking robot. Optik, 125(19), 5684-5689
Zhang, Y., &, Wu, L. (2012). Classification of fruits using computer vision and a multiclass support vector machine. Sensors, 12(9), 12489-12505.
Zhao, J., Tow, J., &, Katupitiya, J. (2005). On-tree fruit recognition using texture properties and color data. In 2005 IEEE/RSJ International Conference on Intelligent Robots and Systems (pp. 3993-3998).
Gonzalez, R. C., Woods, R. E., & Eddins, S. L. (2004). Digital Image Processing Using MATLAB, New Jersey, Pearson Prentice Hall.
Mathworks (2014). Getting Started with MATLAB: User's Guide (r2014b). Mathworks, Inc. MathWorks, (2014). Image Processing Toolbox: User's Guide (R2014b). Mathworks, Inc.
Leavline, E. J., & Singh, A. A. G. (2014). On Teaching Digital Image Processing with MATLAB. American Journal of Signal Processing 4(1): 7-15.
Gonzales, R. C., & Woods,R. E. (2002). Digital Image Processing, 2nd ed. Englewood Cliffs, NJ: Prentice-Hall. Pratt, W. K. (2007). Digital Image Processing: PIKS Scientific Inside, 4th Edition. New York: John Wiley & Sons. Casella, G., Fienberg, S., & Olkin, I. (2010). Springer Texts in Statistics, New York.
Hastie, T., Tibshirami, R., & Friedman, J. (2001). The Elements of Statistical Learning, Springer, New York.
Simões, M.P. (2016). +pêssego Guia Prático da Produção. Centro Operativo e Tecnológico Hortofrutícultura Nacional (COTHN). (in Portuguese)
Simões, M.P., & Carvalho, M.L. (2008). Relatório final do projecto Agro 452. Escola Superior Agrária de Castelo Branco – Instituto Politécnico de Castelo Branco, Castelo Branco, 28 pp (Anexos, 183 pp). (in Portuguese)