Revista
ISSN 2179-5037
CARROT CUPCAKES DEVELOPMENT ADDED FLAX FLOUR (Linum
Usitatissimum L.): PHYSICOCHEMICAL COMPOSITION, SENSORY
ACCEPTABILITY AMONG CHILDREN
AND RELATIONSHIPS WITH
NUTRITIONAL STATUS
Paôla Diovana Gomes1 Fabiane La Flor Ziegler Sanches2 Elisvânia Freitas Dos Santos3 Maria Raquel Manhani4 Daiana Novello5
ABSTRACT: Aimed to elaborate carrot cupcakes enriched with flax flour (FF), analyzing the
sensory acceptance by children, and the physicochemical composition of the standard product and one with a higher FF content and similar acceptance. Also, was performed the prevalence of nutritional diagnosis of children on taste attribute for the purpose of studying the nutritional status as interference factor in the acceptability. The following cupcakes formulations were done: standard (0%) and the other with 15, 18 and 21% FF. Participated in the sensory analysis 55 untrained tasters, both genders, between 4 and five years. The addition of 18% FF was the sample with the highest content, and similar to standard acceptance, especially in appearance, aroma and color attributes. There was no difference between the taste attribute notes related to nutritional diagnosis. The physicochemical analysis of the samples and standard with 18% FF was observed higher concentrations crude fiber, ashes, protein, fat and caloric value in the sample with FF, though observed in lower concentrations of moisture and carbohydrates. The food preparation of products showed an addition level up to 18% FF in cupcakes was well accepted by children, obtaining similar acceptance to the standard product.
Key-words: cereal; functional ingredient; sensory analysis.
1
Bacharel em Nutrição pela Universidade Estadual do Centro-Oeste – UNICENTRO. Brasil.
2
Doutora em Alimentos e Nutrição, Docente do Curso de Nutrição da Universidade Federal do Mato Grosso do Sul – UFMS. MS, Brasil. [email protected]
3
Doutora em Ciências da Cirurgia, Docente do Curso de Nutrição da Universidade Federal do Mato Grosso do Sul – UFMS. MS, Brasil. [email protected]
4
Doutora em Tecnologia de Alimentos, Docente dos Cursos de Farmácia e Nutrição da Universidade São Judas Tadeu – USJT. [email protected]
5
Doutora em Tecnologia de Alimentos, Docente do Curso de Nutrição da UNICENTRO e do Mestrado Interdisciplinar em Desenvolvimento Comunitário da UNICENTRO.
Revista UNIABEU Belford Roxo V.7 Número 17 setembro- dezembro de 2014
DESENVOLVIMENTO DE CUPCAKES DE CENOURA ADICIONADOS DE FARINHA DE LINHAÇA (LINUM USITATISSIMUM L.): COMPOSIÇÃO
FÍSICO-QUÍMICA, ACEITABILIDADE SENSORIAL ENTRE CRIANÇAS E RELAÇÕES COM O ESTADO NUTRICIONAL
RESUMO: Objetivou-se elaborar cupcakes de cenoura enriquecidos com farinha de linhaça
(FL), analisar a aceitação sensorial entre crianças, e determinar a composição físico-química da formulação tradicional e daquela contendo maior teor de FL e com aceitação sensorial semelhante à padrão. Também, foi realizada a avaliação da prevalência do diagnóstico nutricional das crianças sobre o atributo sabor, com a finalidade de estudar o estado nutricional como fator de interferência para aceitabilidade. Foram elaboradas as seguintes formulações de cupcakes: padrão (0%) e as demais com 15, 18 e 21% de FL. Participaram da análise sensorial 55 provadores não treinados, de ambos os gêneros, com idade entre 4 e 5 anos. Os resultados da análise sensorial mostraram que a adição de 18% de FL foi a amostra com maior teor e aceitação semelhante à padrão, principalmente nos atributos aparência, aroma e cor. Não houve diferença entre as notas do atributo sabor relacionadas ao diagnóstico nutricional. Na análise físico-química das amostras padrão e com 18% de FL foram verificados maiores teores de fibra bruta, cinzas, proteínas, lipídios e valor calórico na amostra com FL, entretanto observaram-se menores concentrações de umidade e carboidratos. A elaboração dos produtos comprovou que um nível de adição de até 18% de FL em cupcakes foi bem aceito pelas crianças, obtendo-se aceitação semelhante ao produto padrão.
Palavras-chave: cereal; ingrediente funcional; análise sensorial.
1. INTRODUCTION
Flax (Linum usitatissimum L.) is a functional food that provides health benefits, for being a source, especially α-linolenic acid (omega-3), lignans and dietary fiber. This food is related to a reduced risk of cardiovascular disease and anticarcinogenic properties (TRUCOM, 2006). Also thus, are considered as potential food for adding new ingredients to such products.
Children between 2 to 6 years are within the preschool period, which begins a bond phase between children and food, and the principle of the formation of habits. At this age it is considered that children are building their opinion, transmitting new knowledge to their parents (FAGIOLI; NASSER, 2006). Since childhood people accept or reject foods according to the sensation experienced when eating them or watching them, so, the option for sweeter foods that may be associated with weight gain. Thus, the knowledge of the food consumption determinant is an important tool for choosing healthy foods and change prevention of risky behaviors (BELLISLE, 2010). Regarding the children feeding, the school environment is favorable and
Revista UNIABEU Belford Roxo V.7 Número 17 setembro- dezembro de 2014
privileged to stimulate the healthy habits development, the importance of guidance on these habits occurs mainly because at this age children feel pressured to eat the same foods from colleagues, family members or other influential figures (JOMORI et
al., 2008).
The practices and eating behavior the family adopts the child's feeding provides important environmental aspects that build the food patterns of acceptance by the child. Therefore, the importance of varying the experiments with different flavors and textures to promote the transition into adulthood diet. During early childhood is necessary that changes about inadequate habits are achieved on time and under assistance, so the eating habits development must proceed gradually avoiding intolerances about food appearances helping to have a balanced diet (BLOSSFELD et al., 2007).
In Brazil, about 10 to 15% of preschoolers attending daycare center and stay 8-10 hours a day in this environment, receiving during that time about two-thirds of their daily nutritional needs, so it is important the food and care offered meets their needs favorably influencing their nutritional condition (BARBOSA et al., 2006). Highlight that children in preschool already know choosing foods to eat and have a tendency to lower intake of vegetables and fruits, preferring those with higher calorie and less nutritious. Thus, a useful strategy for increasing fiber intake and omega-3 for this age group would add derivatives of flax in bakery products such as cakes, which are foods that are widely consumed by children, thus improving the nutritional and sensory quality from the product (MORAES et al., 2010). However, the new products success depends on their performance with the consumer. Thus, the sensory tests are extremely important tools for the development, acceptance and preference of these foods (DUTCOSKY, 2011), as well as for children.
Sensory testing with children has become increasingly important to the food processing industry, due to the increased number of products directed to the children's market and the children’s power in purchase decisions. However, sensory studies have not been directed to this need. These tests are applied to a limited extent, however over the years it has become evident the importance of understanding the behavior of this special population (KROLL, 1990) through researches in this area.
Revista UNIABEU Belford Roxo V.7 Número 17 setembro- dezembro de 2014
Thus, the aimed of this study was to elaborate carrot cupcakes enriched with flax flour (FF), analyzing the sensory acceptance and physicochemical composition of the standard product and one with a higher FF content and similar acceptance. Also, was performed the prevalence of nutritional diagnosis of children on taste attribute for the purpose of studying the nutritional status as interference factor in the acceptability.
2. MATERIAL AND METHODS
2.1 Flax Flour obtainment
Were used ten kilograms of FL, brand marketed in the country, sold between January and July 2013, in a supermarket city Guarapuava, PR. Each package contained 200 g being wrapped in individual plastic packets. As observation criteria were observed the same lot number and expiration date longer than 12 months.
2.2 Cupcakes preparation
We prepared four different cupcakes formulations, weighing on average 60 g each: a standard mass containing only white wheat flour (F1) and other added different proportions of whole wheat flour and flax flour. However, for classification purposes, we considered only those added samples being FF: 15% (F2), 18% (F3) and 21% (F4). These percentages addition were selected after preliminary sensory tests conducted with the product. Besides the addition of linseed oil, the ingredients used in the formulations were: grated carrots (25.71%), brown sugar (22.85%), white flour (F1: 21.46%, F2: 1.46%, F3: 0.46% and F4: 0.23%), margarine (14.28%), eggs (12.85%), baking powder (2.85%), wholemeal (F1: 0%, F2: 5.00%, F3: 3.00% and F4: 0.23%).
All ingredients were weighed on a digital scale (Filizola®, Brazil) with a precision of 0.1 g and 15 kg maximum capacity, the Technique Dietetic Laboratory from UNICENTRO. The ingredients: carrots, eggs, brown sugar, margarine, baking powder, white flour, flax flour and whole meal were processed in a blender (Walita®, Brazil) for about 5 minutes, until get a homogeneous mass. After ready, the mass
Revista UNIABEU Belford Roxo V.7 Número 17 setembro- dezembro de 2014
was added to paper cake forms 5.0 x 7.0 x 3 cm, suitable for cupcakes and baked in the oven in 180 ºC temperature for 20 minutes.
2.3 Sensory analysis
Participated in this research 55 children not trained properly enrolled in a Municipal Center of Childhood Education in Palmeira City, PR, from both genders, between 4 and five years. The products were subjected to sensory analysis, in a proper room at school, being evaluated one student one at a time. Each test was performed in individual booths, ballot box type, and the tester was helped by the researchers to fill the answers. The sensory analysis evaluated attributes of appearance, aroma, taste and color. The samples were analyzed using a structured facial hedonic scale of 5 points, ranging from hated (score 1) to liked a lot (score 5) as Dutcosky (2011). It was also applied, a question about global acceptance analyzed from two specific points between "yes" liked the sample "no" did not like the sample, modified Moskowitz (1994). For each panelists was given a piece of each sample (approximately 10 g) in white plastic dishes, coded with three digit numbers, in randomized complete and balanced blocks, considering the addition of each ingredient, accompanied by a glass of water to carry the white. The samples were provided to judges in order sequential monadic (DUTCOSKY, 2011).
2.4 Acceptability Index Calculation (AI)
The index calculation for the acceptability of four formulations was performed according to the formula: AI (%): 100 x A / B (A = average score for the product obtained, B = maximum score given to the product) (MONTEIRO, 1984).
2.5 Physicochemical analyzes
The physicochemical analysis of the products was carried out in the Animal Nutrition Laboratory, Veterinary Medicine Department from UNICENTRO, Guarapuava, PR. The following determinations were performed in triplicate in standard formulation and on that with higher FF addition level and with sensory acceptability similar to the standard: Moisture Determination: Was performed according to AOAC (2011) which consists in drying 105 °C up to constant weight. Protein Determination: It was done by evaluating the total nitrogen in the sample by
Revista UNIABEU Belford Roxo V.7 Número 17 setembro- dezembro de 2014
the Kjeldahl method, given the level semi-micro (AOAC, 2011), was used the nitrogen conversion factor of 6.25 for protein. Lipids Determination: The samples were evaluated by the Bligh and Dyer (1959) method. Ash Determination: It was determined in oven at 550 °C, by AOAC (2011) method. Carbohydrate Determination: was carried through theoretical calculation (by difference) the samples results according to the formula, including fiber: % Carbohydrates = 100 - (% moisture + % protein + % fat + % ash). Crude Fiber Determination: Performed according to the methodology from AOAC (2011). Total Caloric Value Determination: Total Calories (kcal) was calculated using the next values: lipids 8.37 kcal/g, proteins 3.87 kcal/g, and carbohydrates 4.11 kcal/g (MERRIL; WATT, 1973).
2.6 Reference Daily Value Determination (DV)
The DV was calculated relatively to 50 g of the sample, according to the recommended values for children from 4 and five years (DRI, 2005). The nutrients were assessed by calculating average tasters, resulting in: 1.719 kcal/day, 244 g carbohydrates, 62.5 g protein and 65.4 g lipid.
2.7 Anthropometric evaluation
The weight and height measurement of children was performed to determine the nutritional status and subsequent comparison with the sensory acceptance. The anthropometric data on weight and height were collected in accordance with the recommendations of the National Food System and Nutrition Surveillance (FAGUNDES et al., 2004). Weight was measured on a digital scale (Wiso Ultra Slim®, Brazil) with 180 kg of capacity. The height was measured by an inelastic tape fixed to the wall, deducting 0.50 cm from the floor. Children were measured without shoes or hair adornments. The Body Mass Index (BMI) was calculated considering the value of the current weight (kg) divided by square of height (m2). Data analysis was performed using the rating scales and BMI tests for age: BMI/I (WHO, 1998), according to the following classification: slimness (BMI: percentile > 0.1 and < 3), normal weight (BMI: percentile > 3 and < 85), overweight risk (BMI: > percentile > 85 and < 97), overweight (BMI: percentile > 97 and < 99.9) and obesity (BMI: percentile > 99).
Revista UNIABEU Belford Roxo V.7 Número 17 setembro- dezembro de 2014
2.8 Statistical analysis
Was used analyzed descriptive statistics, besides the Chi-square test from Pearson and Fisher´s exact test. Numerical data were evaluated by variance analysis, using the Tukey test and McNemar's chi-square test for average comparison. All evaluations were performed in Statgraphics Plus® software, version 5.1 and Statistical Package for the Social Sciences®, version 18 (SPSS), with 5% significance level.
2.9 Ethical issues
This study was approved by the Ethics Research Committee from UNICENTRO, opinion number No. 49549/2012. As exclusion criteria were considered the following factors: having allergy to some ingredient used to manufacture the products, being older or younger than the age of interest in the study, not being student from Municipal Center for Early Childhood Education and studied children who do not presented the Consent Free and Informed Term signed by the legal guardian.
3. RESULTS AND DISCUSSION
In the present study, we evaluated 47.30% female (n=26) and 52.70% male (n=29) children, with mean 4.32±0.47 years.
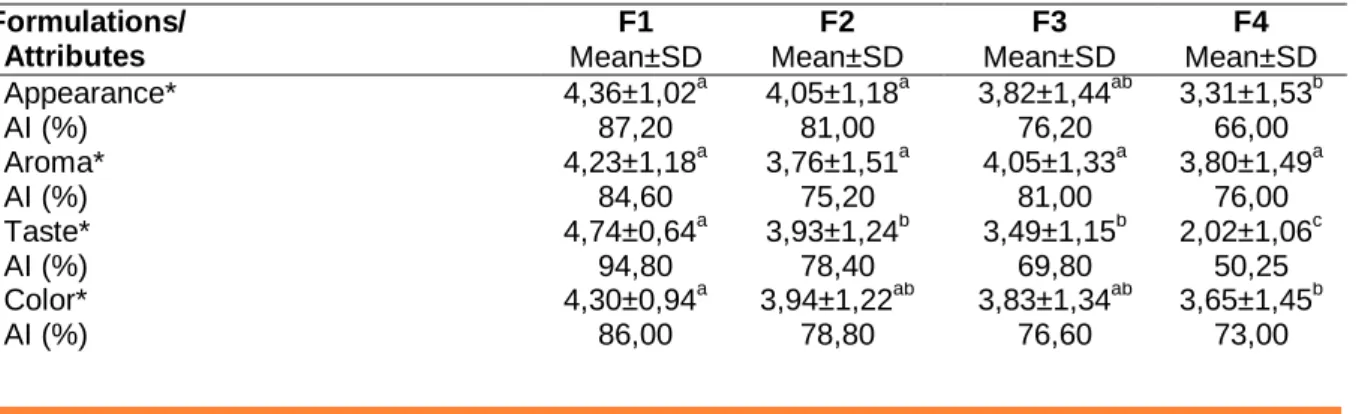
Table 1 shows the acceptability index and sensory evaluation of the standard cupcakes and enriched with flax flour.
Table 1. Acceptability Index (AI) and sensory affective testing means to standard cupcakes formulations and added 15, 18 and 21% flax flour
Formulations/ Attributes F1 Mean±SD F2 Mean±SD F3 Mean±SD F4 Mean±SD Appearance* 4,36±1,02a 4,05±1,18a 3,82±1,44ab 3,31±1,53b AI (%) 87,20 81,00 76,20 66,00 Aroma* 4,23±1,18a 3,76±1,51a 4,05±1,33a 3,80±1,49a AI (%) 84,60 75,20 81,00 76,00 Taste* 4,74±0,64a 3,93±1,24b 3,49±1,15b 2,02±1,06c AI (%) 94,80 78,40 69,80 50,25 Color* 4,30±0,94a 3,94±1,22ab 3,83±1,34ab 3,65±1,45b AI (%) 86,00 78,80 76,60 73,00
Revista UNIABEU Belford Roxo V.7 Número 17 setembro- dezembro de 2014
Positive (yes) overall acceptance (%)** 92,70a 76,40b 78,80b 50,90c *Different letters in the line indicate significant difference by Tukey's test (p<0.05); **Different letters in the line indicate significant difference by McNemar's chi-square test(p<0.05); SD: Standard deviation; F1: standard; F2: 15% flax flour; F3: 18% flax flour; F4: 21% flax flour.
The F1 and F2 formulations had higher scores for the appearance attribute than F4 (p<0.05). Corroborating these data, surveys from Maciel et al. (2008) studied the effect of adding FF (10, 15 and 20%) in adults with biscuit-type cracker also observed that the use of higher levels of this ingredient, promoting a reduction in the scores of products appearance (p<0.05). About the aroma attribute there was no meaningful difference between the samples, which was also verified by Lima (2007) in work with adults evaluating FF addition (4,7 and 10%) in bread samples.
Regarding the taste, the standard sample (F1) was the most accepted, knowing that F4 is the one that received the lowest scores (p<0.05). Ramcharitar et al. (2005) reported similar results with the addition of adult evaluating FF on muffins, where it was found that the standard formulation was preferred by tasters. Similarly to taste, in color attribute evaluation, can be noticed that F1 showed greater acceptance that F4 (p<0.05). This may be due to dark brown pigmentation of FF that probably interfered in cupcakes color. Data that corroborate with this study were observed by Borges et al. (2011) with adults in breads added 10 and 15% flax flour, showing up darker when compared to the standard. About the overall positive acceptance, it was found that the standard sample showed higher percentages of positive responses, followed by F3, and F4 showed the lowest percentage of acceptance (p<0.05). However, it is emphasized that all samples remained with results of global acceptance above 50%, being well accepted by the judges. Research Moraes et al. (2010) with adult tasters who assessed formulations added FF (5, 15, 30 and 45%) in ordinary cake, also found that higher levels of this ingredient decreased the overall products acceptability, but keeping up 50%.
In general, the FF addition in the products reduced the acceptability rate, especially in terms of taste. However, these four formulations, with the exception of F4 in appearance and taste attributes showed acceptance percentages above 70%, which considers products with good sensory acceptability, according to Dutcoski (2011). Corroborating these findings, Possamai (2005) evaluated the sensory acceptability (adults) honey bread added 20% wheat bran and 20% FF, also found
Revista UNIABEU Belford Roxo V.7 Número 17 setembro- dezembro de 2014
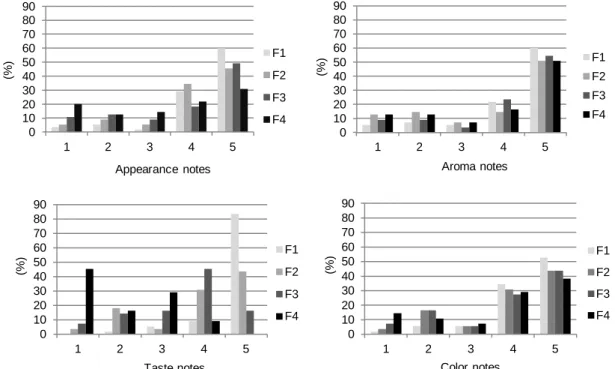
similar results for acceptability for both products (average of 89,3%). In Figure 1, we can observe the hedonic values distribution of tasters on each sensory attribute evaluated.
Figure 1. Tasters distributions by the hedonic values obtained in evaluation appearance, aroma, taste and color attributes of standard cupcakes formulations (F1) and added to 15% (F2), 18% (F3) and 21% (F4) flax flour.
In general, except for the taste attribute, all formulations were reported more frequently in score 5 ("liked a lot"), especially the standard formulation, demonstrating that products were well accepted by the tasters. Corroborating these results, Hussain et al. (2006) evaluated adult subjects on the sensory cookies acceptance containing FF (5 to 30%) also found that products with lower levels of this ingredient (10 and 15%) had the highest scores for taste. According Alamanou et al. (1996) attributes as aroma and taste are probably the most important features affecting sensory properties of food products added with different ingredients. Thus, the formulation containing 18% FF (F3) was selected to carry out the remaining analyzes, along with the standard for comparison, because it was the highest level of the ingredient and with good acceptability, being confirmed by AI > 70%.
0 10 20 30 40 50 60 70 80 90 1 2 3 4 5 (%) Appearance notes F1 F2 F3 F4 0 10 20 30 40 50 60 70 80 90 1 2 3 4 5 (%) Aroma notes F1 F2 F3 F4 0 10 20 30 40 50 60 70 80 90 1 2 3 4 5 (%) Taste notes F1 F2 F3 F4 0 10 20 30 40 50 60 70 80 90 1 2 3 4 5 (%) Color notes F1 F2 F3 F4
Revista UNIABEU Belford Roxo V.7 Número 17 setembro- dezembro de 2014
In Table 2 is possible to observe the physicochemical composition (F1) and daily values recommended from standard cupcakes (VD) and added of 18% FF (F3), compared to a reference product.
Table 2. Physico-chemical composition and daily recommended values - DV* (50 g middle portion) of a standard cupcake (F1) and added with 18% flax flour (F3), compared with a reference product**
Evaluation F1 Mean±SD DV (%)* F3 Mean±SD DV (%)* Reference** Moisture (%) 44,38±0,16a - 41,22±0,12b - 25,10 Ash (g.100g-1) 0,87±0,01b - 1,74±0,01a - 1,90 Proteins (g.100g-1) 6,95±0,29b 5,56 8,62±0,04a 6,89 5,30 Lipids (g.100g-1) 8,95±0,03b 6,85 11,49±0,10a 8,79 14,60 Carbohydrate (g.100g-1) 38,85±0,41a 7,96 36,93±0,28b 7,57 53,00
Calorie value (kcal.100g-1) 258,87±0,72b 7,53 280,99±0,15a 8,17 361,00
Crude fiber (g.100g-1) 9,27±0,05b - 15,51±0,07a - -
Different letters in the line indicate significant difference by student's test (p<0.05); *DV: nutrients evaluated by the mean of the Dietary Reference Intakes (2005) with base in a diet of 1.719 kcal/day; **Values compared with “simple yellow cake” (USDA, 2001); Results expressed in humid base; SD: Standard deviation.
Was possible to observe higher levels (p<0.05) of moisture and carbohydrates to the standard formulation, and both samples showed values of moisture above the reference product (USDA, 2001). According to what explain Oliveira et al. (2007), who found similar results in breads made with FF, reducing the moisture in the product containing this ingredient compared to standard can be explained by the fact that fibers present in large flax amount, have a higher water absorption power, resulting in a lower content of free water.
The FF addition (F3) increased the amount of ash, protein, fat, calories, and especially crude fiber in the products. Explained due to the fact that flax contains high levels of protein (24%), fiber (32%) and lipids (36%) in its composition (OOMAH; MAZZA, 1997). Corroborating these results, Oliveira et al. (2007), also reported higher levels of protein (8%), fiber (3.9%) and lipids (6%) with the addition of flax products (p<0.05) than in standard samples (6, 2 and 2%, respectively). Although there was an increase in the lipids amount containing FF cupcakes, it should be noted that this ingredient has a high level (19.8%) of omega-3 (n-3) (TACO, 2011) which is regarded as one of the functional components beneficial for health (TRUCOM, 2006; OLIVEIRA et al., 2007). Calculating the average content (theory) of n-3 samples (F1 and F3) there is a total of 0.25% and 3.81% respectively (TACO,
Revista UNIABEU Belford Roxo V.7 Número 17 setembro- dezembro de 2014
2011) and may therefore have an F3 increase of 1.424% compared to the standard product.
It stands out as the main result of this work the high fiber content found in F3 formulation (15.51 g.100g-1), expressing a significant increase of 67.31% compared to F1. This is due mainly to the high average content of soluble and insoluble fiber (8.5 and 19.5 g.100g-1, respectively) present in FF (MORRIS; VAISEY-GENSER, 2003). These results make the product an excellent choice for people with diabetes (DM), because the fibers help in delaying the carbohydrates absorption, leading to a blood glucose decrease (CARVALHO et al., 2012). Also, in the childhood obesity case, several studies suggest a reduction of 3 to 5% in cholesterol and LDL-c with use of soluble fiber due to its absorption capacity (FREITAS et al., 2005). According to Brazilian Legislation (BRASIL, 2001), food is considered as a source of dietary fiber when present between 3% and with high content in least 6%. Thus, knowing that the method of determining crude fiber used in this study underestimates the value of dietary fiber in the products (HERNÁNDEZ et al., 1995), can be considered both formulations with a high fiber content.
The following results were observed to mean anthropometric variables of children evaluated (mean±SD): 1.10 m±0.04 of stature, 17.80 kg ±2.29 of weight, 14.90 kg/m²±1.45 of BMI, 5.45% (n=3) of slimness, 85.45% (n=47) of normal weight, 7.27% (n=4) overweight risk, 1.81% (n=1) of obesity.
Of the total number of children assessed, the majority belonged to the male gender. The anthropometric assessment of the population, analyzed by BMI showed that, in general, the nutritional status was classified as normal weight, corroborating studies from Goes and Soares (2010) that assessed the nutritional status of 150 preschool children in Guarapuava, PR and found a total of 76% of normal children, with 7.2% overweight risk and about 1.8% with obesity (BMI/I).
It is noteworthy that regardless of the method used to assess nutritional status in scientific studies, it is possible to observe an increase in the prevalence of overweight risk and obesity, which increase the risk of chronic degenerative diseases. Observe clearly the nutrition transition of the global population, including children, where there is a progressive reduction of nutritional deficiencies and the increasing prevalence of overweight and obesity. Among the factors that may trigger the increased risk of obesity are the demographic, socioeconomic and
Revista UNIABEU Belford Roxo V.7 Número 17 setembro- dezembro de 2014
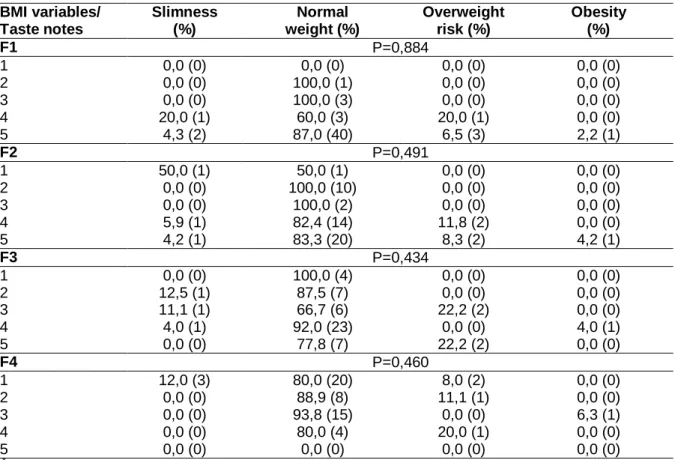
epidemiological. Thus, it is critical to efficient monitoring by municipal administrators, teachers, parents, universities and non-governmental organizations so that we can ensure proper nutritional status of these children (BATISTA; RISSIN, 2003). Table 3 presents data on the prevalence of scores about the attribute taste regarding nutritional assessment of the assessed children.
Table 3. Prevalence of taste notes attribute related to nutritional diagnosis (BMI) of the children in a kindergarten
BMI variables/ Taste notes Slimness (%) Normal weight (%) Overweight risk (%) Obesity (%) F1 P=0,884 1 0,0 (0) 0,0 (0) 0,0 (0) 0,0 (0) 2 0,0 (0) 100,0 (1) 0,0 (0) 0,0 (0) 3 0,0 (0) 100,0 (3) 0,0 (0) 0,0 (0) 4 20,0 (1) 60,0 (3) 20,0 (1) 0,0 (0) 5 4,3 (2) 87,0 (40) 6,5 (3) 2,2 (1) F2 P=0,491 1 50,0 (1) 50,0 (1) 0,0 (0) 0,0 (0) 2 0,0 (0) 100,0 (10) 0,0 (0) 0,0 (0) 3 0,0 (0) 100,0 (2) 0,0 (0) 0,0 (0) 4 5,9 (1) 82,4 (14) 11,8 (2) 0,0 (0) 5 4,2 (1) 83,3 (20) 8,3 (2) 4,2 (1) F3 P=0,434 1 0,0 (0) 100,0 (4) 0,0 (0) 0,0 (0) 2 12,5 (1) 87,5 (7) 0,0 (0) 0,0 (0) 3 11,1 (1) 66,7 (6) 22,2 (2) 0,0 (0) 4 4,0 (1) 92,0 (23) 0,0 (0) 4,0 (1) 5 0,0 (0) 77,8 (7) 22,2 (2) 0,0 (0) F4 P=0,460 1 12,0 (3) 80,0 (20) 8,0 (2) 0,0 (0) 2 0,0 (0) 88,9 (8) 11,1 (1) 0,0 (0) 3 0,0 (0) 93,8 (15) 0,0 (0) 6,3 (1) 4 0,0 (0) 80,0 (4) 20,0 (1) 0,0 (0) 5 0,0 (0) 0,0 (0) 0,0 (0) 0,0 (0) *
P value for Pearson's chi-squared test with significance p<0.05; F1: standard; F2: 15% flax flour; F3: 18% flax flour; F4: 21% flax flour; BMI: Body Mass Index; (n) total: 55 tasters.
As can be seen in Table 3, there was no significant difference in the prevalence of the attribute taste notes related to nutritional assessment of children (BMI). Similar results were reported by Hill et al. (2009), who studied the association of adiposity with a preference for fatty foods or sugary foods by children. Likewise, there was no statistical difference (Fisher's exact test, p>0.05) between female and male subjects, correlated with the attribute taste (likes and dislikes) of four formulations. Thus, both genders showed a similar preference for FF addition in the products.
Revista UNIABEU Belford Roxo V.7 Número 17 setembro- dezembro de 2014
However, according to Monneuse et al. (1991), who studied the impact of gender and age on sensory acceptability of different milk products added with different content of sugar and fat, children prefer foods with higher sucrose concentrations, decreasing in adulthood. In adolescence, there is a significant difference in preference for sweeter products, being higher for males.
4. CONCLUSION
The product development proved that an addition level up to 18% flax flour in cupcakes was well accepted by the tasters obtaining similar sensory acceptance to the standard product.
The physicochemical analysis of the product added 18% flax flour provided, in general, an increase in nutrient content, except for carbohydrate and moisture. It is noteworthy the substantial increase in crude fiber and n-3 in the added product of flax flour, which works as a strategy for the consumption of these nutrients among the children. The nutritional status of children and gender did not affect the acceptance of the attribute taste of cupcakes. Therefore, flax flour can be considered a potential ingredient with functional properties in addition to cookies and similar products, with good acceptance by children.
REFERENCES
ALAMANOU, S.; BLOUKAS, J. G.; PANERAS, E. D.; DOXASTAKIS, G. Influence of protein isolate from lupin seed (Lupinus albus. ssp. Graecus) on processing and quality characteristics of frankfurters. Meat Science, v. 42, n. 1, pp. 79-93, 1996. AOAC International. Official Methods of Analysis of AOAC International. 18 ed. 4ª rev. Gaithersburg: MD, USA, 2011.
BARBOSA, R. M. S. et al. Avaliação do consumo alimentar de crianças pertencentes a uma creche filantrópica na Ilha de Paquetá, Rio de Janeiro, Brasil. Revista
Brasileira de Saúde Materno Infantil, v. 6, n. 1, pp.127-134, 2006.
BATISTA, F. M.; RISSIN, A. A transição nutricional no Brasil: tendências regionais e temporais. Cadernos de Saúde Pública, v. 19, n. 1, pp. 181-191, 2003.
BELLISLE, F. How and why should we study ingestive behaviors in humans? Food
Revista UNIABEU Belford Roxo V.7 Número 17 setembro- dezembro de 2014
BLIGH, E. G.; DYER, W. J. A rapid method of total lipid extraction and purification.
Canadian Journal of Biochemestry and Physiology, v. 37, n. 8, pp. 911-917, 1959.
BLOSSFELD, I.; COLLINS, A.; KIELY, M.; DELAHUNTY, C. Texture preferences of 12-month-old infants and the role of early experiences. Food Quality and Preference, v. 18, n. 1, pp. 396–404, 2007.
BORGES, J.; PIROZI, M.; DE PAULA, C.; RAMOS, D.; CHAVES, J. Caracterização Físico-química e sensorial de pão de sal enriquecido com farinha integral de linhaça. Boletim do Centro de Pesquisa de Processamento de Alimentos, v. 29, n. 1, pp. 83-96, 2011.
BRASIL. Ministério da Saúde. Agência Nacional de Vigilância Sanitária (ANVISA).
Resolução nº 27, de 13 de janeiro de 1998. Estabelece normas para padronizar a
declaração de nutrientes na rotulagem nutricional obrigatória de alimentos e bebidas embalados. Diário Oficial da União 2001; 22 mar.
CARVALHO, F. C.; et al. Importância da orientação nutricional e do teor de fibras da dieta no controle glicêmico de pacientes diabéticos tipo 2 sob intervenção educacional intensiva. Arquivos Brasileiros de Endocrinologia & Metabologia, v. 56, n. 2, pp. 110-119, 2012.
DIETARY REFERENCE INTAKES (DRI). Institute of Medicine. National Academy of
Sciences. Dietary reference intakes for Energy, Carbohydrate, Fiber, Fat, Fatty, Acids, Cholesterol, Protein, and Amino Acids. Washington: National Academy Press,
2005.
DUTCOSKY, S. D. Análise sensorial de alimentos. 3 ed. Curitiba: Champagnat, 2011. 426p.
FAGIOLI, D.; NASSER, L. A. Educação Nutricional na infância e na adolescência:
planejamento, intervenção, avaliação e dinâmicas. São Paulo: Ed. RCN; 2006.
FAGUNDES, A. A.; et al. SISVAN. Sistema de Vigilância alimentar e nutricional: orientações básicas para a coleta, processamento, análise de dados e informação em serviços de saúde. Brasília: Ministério da Saúde. Série A. 120p., 2004.
FREITAS, A. S. S; COELHO, S. C.; RIBEIRO, R. L. Obesidade infantil: influência de hábitos alimentares inadequados. Revista Saúde & Ambiente, v. 4, n. 2, pp. 9-14, 2009.
GOES, V. F., SOARES, B. M. Avaliação do estado nutricional de pré-escolares e
Revista UNIABEU Belford Roxo V.7 Número 17 setembro- dezembro de 2014
de Guarapuava-Pr. 2010. 32 f. Trabalho de Conclusão de Curso - Universidade
Estadual do Centro-Oeste, Guarapuava. 2010.
HERNÁNDEZ, T.; HERNÁNDEZ, A.; MARTINEZ, C. Concepto, propriedades y metodos de analisis. Revista Alimentaria, v. 4, n. 261, pp. 19-30, 1995.
HILL, C.; WARDLE J.; COOKE, L. Adiposity is not associated with children’s reported liking for selected foods. Appetite, v. 52, n. 1, pp. 603-603, 2009.
HUSSAIN, S.; et al. Physical and sensory attributes of flaxseed flour supplemented cookies. Turkish Journal of Biology, v. 30, n. 2, pp. 87-92, 2006.
JOMORI, M. M.; PROENCA, R. P. C.; CALVO, M. C. M. Determinantes de escolha alimentar. Revista de Nutrição, v. 21, n. 1, pp. 63-73, 2008.
KROLL, B. J. Evaluating rating scales for sensory testing with children. Journal Food
and Technology, v. 44, n. 11, pp. 78-86, 1990.
LIMA, C. C. Aplicação das Farinhas de Linhaça (Linum usitatissimum L.) e Maracujá
(Passiflora edulis Sims f. flavicarpa Deg.) no Processamento de Pães com Propriedades Funcionais. 2007. 157f. Dissertação (Mestrado em Tecnologia de
Alimentos) - Universidade Federal do Ceará, Fortaleza. 2007.
MACIEL, L. M. B.; PONTES, D. S. F.; RODRIGUES, M. C. P. Efeito da adição de farinha de linhaça no processamento de biscoito tipo cracker. Revista Alimentos e
Nutrição, v. 19, n. 4, pp. 385-392, 2008.
MERRILL, A. L.; WATT, B. K. Energy values of foods: basis and derivation. Agricultural Handbook, n. 74, Washington, DC: USDA, 1973. 106p.
MONNEUSE, M. O.; BELLISLE, F.; SYLVESTRE, J. L. Impact of sex and age on sensory evaluation of sugar and fat in dairy products. Physiology & Behavior, v. 50, n. 6, pp. 1111-1117, 1991.
MONTEIRO, C. L. B. Técnicas de avaliação sensorial. 2. ed. Curitiba: CEPPA-UFPR, 1984. 101p.
MORAES, E. A.; et al. Sensory evaluation and nutritional value of cakes prepared with whole flaxseed flour. Ciência e Tecnologia de Alimentos, v. 30, n. 4, pp. 974-979, 2010.
MORRIS, D. H.; VAISEY-GENSER, M. Flaxseed. Encyclopedia of Food Sciences
and Nutrition, v. 10, n. 2, pp. 2525-2531, 2003.
MOSKOWITZ, H. Applied Sensory Analysis of Foods. Boca Raton: CRC Press, 1994. v. 1, 259p.
Revista UNIABEU Belford Roxo V.7 Número 17 setembro- dezembro de 2014
OLIVEIRA, T. M.; PIROZI, M. R.; BORGES, J. T. S. Elaboração de pão de sal utilizando farinha mista de trigo e linhaça. Revista Alimentos e Nutrição, v. 18, n. 2, pp. 141-150, 2007.
OOMAH, B. D.; MAZZA, G. Effect of dehulling on chemical composition and physical properties of flaxseed. Lebensmittel-Wissenschaft und-Technologie, v. 30, n. 2, pp. 135-140, 1997.
POSSAMAI, T. N. Elaboração do pão de mel com fibra alimentar proveniente de
diferentes grãos, sua caracterização físico-química, microbiológica e sensorial. 2005.
71p. Tese (Mestrado em Tecnologia de Alimentos) – Universidade Federal do Paraná, Curitiba. 2005.
RAMCHARITAR, A.; et al. Consumer acceptability of muffins with flaxseed (Linun usitatissimun). Journal of Food Science, v. 70, n. 7, pp. 504-507, 2005.
TACO. Tabela Brasileira de Composição dos alimentos. UNICAMP. 4. ed. Campinas: NEPA, 2011.161p.
TRUCOM, C. A importância da linhaça na saúde. 1 ed. São Paulo: Alaúde, 2006. 152p.
USDA - UNITED STATE DEPARTMENT OF AGRICULTURE. Nutrient Database for
Standard Reference, Release 14. Washington, Julho 2001.
WORLD HEALTH ORGANIZATION (WHO). Physical Status: the use and
interpretation of anthropometry. Technical Report Series. Geneva, Switzerland, 1998.
854p.
Recebido em 25 de abril de 2014. Aceito em 13 de dezembro de 2014.