aDapTaTioN STraiN iNDEX For ToUriSTS TraVELiNG
FroM CENTraL aND NorTHErN EUropE
To THE MEDiTErraNEaN
KrzySztof BłażejczyK1 Vera VinogradoVa2
abstract − One of the principal features of climate is its spatial variability. Long
distance travels are an essential part of life in contemporary societies. in 2012 tourism arri vals reached 1 billion people at the global scale. in a short time one can move to e xtremely different climatic conditions and one’s organism is under great pressure of a tmospheric stimuli which can be very different from those experienced at home. spatial differences in climate stimuli need various adaptation strategies in humans. the paper considers adap ta tion strain in tourists from seven central and northern european cities travelling to the Mediterranean regions of Barcelona, rome and athens for the period 1991-2000. the adap tation strain index (ASI) was applied for this purpose. seasonal and spatial patterns of bioclimatic contrasts are considered. summer was the season with greatest spatially differen tiated adaptation strain, but in winter the need for adaptation was the highest.
Keywords: Bioclimate, adaptation strain index (asi), tourism, europe, Mediterranean.
resumo – índicede adaptaçãocliMáticaeM turiStaSViaJandodocentro edo norteda europaparao Mediterrâneo. Uma das principais características do clima é a sua variabilidade espacial. as viagens de longo curso, para turismo de lazer ou de trabalho, são uma característica da sociedade contemporânea. em 2012, as “che-gadas” atingiram mil milhões a nível mundial. num curto espaço de tempo, o organismo humano pode ficar submetido a condições climáticas muito diversas das habituais, o que exige diversas estratégias de adaptação. estuda-se, neste artigo, a tensão a que ficam sujeitos os turistas que se deslocam de sete locais da europa Central e do norte em direc ção a três cidades no Mediterrâneos: atenas, Barcelona e roma, no período 1999-2000. Utiliza-se, para este propó sito, o Adaptation Strain Index (ASI). na análise, received: January 2014. accepted: June 2014.
1 institute of Geography and spatial Organization, Polish academy of sciences. twarda 51/55, 00-818 Warszawa, Poland. e-mail: k.blaz@twarda.pan.pl
2 institute of Geography, russian academy of sciences, 119017, staromonetniy pereulok 29, Moscow, russia. e-mail: vvvinog@yandex.ru
consideram-se contrastes estacionais e espaciais. O Verão é a estação com maiores contras tes de asi, mas no inverno é necessária uma maior adaptação para os turistas que chegam ao Mediterrâneo.
Palavras-chave: Bioclima, Adaptation Strain Index (asi), turismo, europa, Mediterrâneo.
résumé – indiced’adaptationcliMatiquepourleStouriSteSdu centre etdu norddel’europeVoyageantenrégionSMéditerranéenneS. Le climat est marqué par une forte variabilité spatiale. Or les voyages à longue distance, pour le tou-risme ou pour les affaires, sont un trait essentiel de la vie contemporaine ; en 2012, on a enregistré un total mondial d’un milliard d’ « arrivées ». L’organisme est donc soumis, en très peu de temps, à des conditions climatiques fort différentes de celles auxquelles il est habitué, ce qui exige de recourir à diverses stratégies d’adaptation. On étudie ici celles qui concernent la tension affectant les touristes de sept villes du Centre et du nord de l’europe voyageant en régions méditerranéennes (athènes, Barcelone et rome) pour la période 1991-2000. L’Adaptation Strain Index (asi) est utilisé, en considérant divers cas de contrastes bioclimatiques saisonniers et spatiaux. Les plus grands contrastes ont lieu en été, mais c’est en hiver que les touristes qui arrivent en Méditerranée doivent s’adapter le plus.
Mots-clés: Bioclimat, Adaptation Strain Index (asi), tourisme, europe, Méditerranée.
i. intrODUCtiOn
During the last decades tourism activity has increased all over the world. accor-ding to the United nation World tourism Organization, international arrivals have increased from 436 million in 1990 to 1095 million in 2012 (UnWtO tourism Highlights, 2013). the most frequently visited places are european countries (534 million in 2012). the Mediterranean region was visited by 191 million tourists arri-ving by aircraft and was the most popular arrivals destination not only in europe but also in the entire world (fig. 1).
for people travelling long distances, information about climate contrasts they are likely to experience is very important. their organisms must adapt to new clima te
stimuli especially in europe, where seasonal and spatial variability is one of the
fig. 1 – international arrivals of tourists in different regions (1995-2012).
Fig. 1 – Chegadas internacionais de turistas em diferentes regiões (1995-2012).
source: UnWtO tourism Highlights, 2013.
in general, increase in differences of climate intensifies the magnitude of adapta-tion processes in an organism (Koppe and Jendritzky 2005; Jendritzky and de Dear 2008). several research studies discuss adaptation strategies of the human orga nism to varied atmospheric stimuli (Givoni and Goldman 1973; le Blanc 1975; Clark and e dholm 1985; Kenney 1985; Parsons 2003). special attention is given to physiolo gical costs to keep homeothermy, i.e. constant core temperature (about 37ºC) in diffe rent ther-mal environments. Various important adaptation processes take place when the i ndividual is faced with a wide range of ambient temperatures (Bröde et al., 2012, table i).
table i – Physiological indicators of thermoregulatory processes in an organism in various thermal environments.
Quadro I – Indicadores fisiológicos de processos termo-regulatórios do organismo humano, em vários ambientes térmicos.
thermal
environment: extreme cold Cold Moderate Heat extreme heat
Physiological indicators - skin temperature - core temperature - shivering - skin temperature - shivering - skin temperature - blood flow - skin temperature - core temperature - blood flow - cardiac output - sweat rate - skin wettedness - core temperature - sweat rate source: Bröde et al., 2012.
0 100 200 300 400 500 600 1990 1995 2000 2005 2010 2011 2012
Europe Mediteranean Asia&Pacific Americas Africa Middle East
In te rn a tion a l a rr iv a ls ( m illi o n ) Years
in cold environments, all physiological efforts of an organism lead to minimi-sing heat loss from the body. the centre of thermoregulation reduces skin blood flow which results in decreasing skin temperature and increasing thermoinsulative pro-perties of the skin (le Blanc 1975; Clark and edholm, 1985). additionally, muscles produce heat by shivering thermogenesis (fiala et al., 1999, 2001). the autonomic mechanisms of temperature regulation are usually supported by behavioural thermo-regulation, mostly by well insulated clothing (Holmér 1988; isO/Dis 11079).
in hot conditions physiological processes lead to an intensification of the expen-diture of heat from the body. the most important is an increase of skin blood flow. this then results in the activation of sweat glands and in intensification of cardiac output (Beaumont and Bullard, 1965; Garden et al., 1966; elizondo and Bullard, 1971; Givoni and Goldman, 1973). evaporation of sweat reduces risk of body over-heating (Kenney, 1985). However, it also leads to disturbances in water and mineral balan ces of an organism (Błażejczyk and Szyguła, 2004).
While our knowledge of the mechanisms of thermal adaptation is relatively good (Hensel, 1981; Clark and edholm, 1985), there are, however, only few attempts to quantify assessments of bioclimatic contrasts between different sites. One of the first is the concept of Bioclimatic Distance (BD) index proposed by Mateeva and filipov (2003). the index is based on the comparison of effective clothing insulation index (ECI). it represents thermal insulation of clothing necessary for keeping the balance between heat gains and losses in the human body. ECI is calculated by sol-ving human heat balan ce model MeneX_2005 (BioKlima 2.6.) at constant skin tempe rature of 32ºC and meta bolic heat production of 135 W·m-2. the BD index is
calculated as follows:
BD = (ECI
h– ECI
d) / 13·100
(1)where: ECIh – effective clothing insulation at the home location (in clo units), ECId – effec tive clothing insulation at the destination (in clo). the numerical coefficient 13 is expressed in clo and it represents maximal difference in ECI. the authors suc-cessfully applied BD index for assessing bioclimatic differentiation of the Balkan Peninsula using mean monthly meteorological data.
two authors, de freitas and Grigorieva (2009) have proposed acclimatisation thermal strain index (ATSI) based on the rusanov (1989) concept of heat loss by respiration. Differences in respiratory heat loss were used to assess bioclimatic con-trasts in siberia. ATSI considers heat loss by respiration at the home location (Resh) and at the studied destination (Resd) and is calculated as follows:
ATSI = (Res
h– Res
d) / Res
h·100
(2)Błażejczyk (2011) has proposed the Bioclimatic Contrast Index (BCI) which consists of four parameters which are used for validation of bioclimatic conditions: Water Loss (SW) – as adaptation measure in hot environments, insulation Predicted
(Iclp) – as adaptation measure in cold conditions, Physiological subjective tempe-rature (PST) – as a measure of thermal sensations and Universal thermal Climate index (UTCI) – as an indicator of heat stress.
BCI = (dUTCI + dPST + dSW + dIclp) / 4
(3)where dUTCI, dPST, dSW and dIclp are differences of particular biothermal indices in compared sites.
BCI was applied to evaluate the spatial variability of bioclimate in Poland.
each of the previously developed indices has advantages and weaknesses, which are discussed by Blazejczyk (2011). While BD and ATSI are mostly appro-priate for cold climates, BCI can be used in a wide range of environmental condi-tions. However, as BCI was applied to non-normalized values of partial indices and in specific weather situations, it has unrealistic values.
the aim of the present research is to discuss the adaptation strain which tourists from central and northern european cities can be subject to when travelling by plane to the Mediterranean region. seasonal patterns of regional differences are discussed and validated. taking into consideration limitations of other indices the adaptation strain index (ASI) is used for this purpose.
ii. MetHODs anD MateriaLs
as shown in table i, every thermal environment triggers specific physiological reactions. several physiological and behavioural reactions are crucial for the adapta-tion to new thermal condiadapta-tions. in the present research, the direcadapta-tion and the inten-sity of these reactions are assessed by the adaptation strain index (ASI). the index includes three measures of adaptation processes of an organism to different ambient conditions. (i) the water loss index (SW, g·hour-1) is a measure of active adaptation
to hot conditions by altering sweating and evaporation of sweat from the skin (Błażejczyk, 2007). (ii) The Insulation Predicted index (Iclp, clo) is a practical mea-sure of adap tation to cold through changes of insulative properties of clothing (B urton and edholm, 1955; fourt and Hollies, 1970; Havenith et al., 2012). (iii) the Uni versal thermal Climate index (UTCI, ºC) is a complex measure of physiological responses to actual ambient conditions by activation of different adaptation pro-cesses listed in table I (Błażejczyk et al., 2010; Bröde et al., 2012).
the calculation of ASI includes several steps.
1) the values of partial indices (SW, Iclpi, and UTCI) are calculated based on
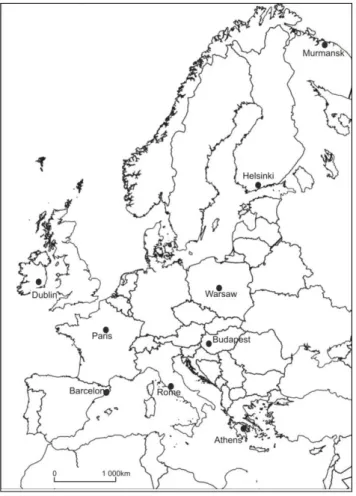
vapour pressure, wind speed and total cloud cover for 12 UtC were used. the mid-day meteorological observations of air temperature, vapour pressure, wind speed and total cloud cover were used because of their representativeness to day-time period of the most intensive tourism outdoor activity. the data cover the period 1991-2000. the meteorological stations of Barcelona, rome and athens represent the Mediterranean region and the seven stations of Paris, Dublin, Budapest, Warsaw, Moscow, Helsinki and Murmansk represent parts of central and northern europe (fig. 2)ii. Most of meteo rological data used in the research were obtained
from national meteorological services via european Commission PHeWe project. Only data for Moscow and Murmansk were obtained from russian Meteorological service.the partial indices were calculated with the use of BioKlima 2.6 software package (http://www.igipz.pan.pl/Bioklima-zgik.html).
fig. 2 – Meteorological stations used in this research.
2) as the partial indices applied in ASI represent different units and various ranges of values, the second step was to normalize them to the range from 0 to 1. the following equations were used in this purpose:
SW
n= SW/1500
(4)Iclp
n= Iclp/10
(5)UTCI
n= (UTCI+110)/170
(6)3) the differences of partial indices between home locations and tourism desti-nation sites were calculated for each day of the studied period. the calculations start from analysis of UTCI values. if UTCI in both sites: home (marked by h) and destina-tion (marked by d) are within the range of “no thermal stress” (i.e. between 9ºC and 26ºC) then dUTCIn is taken as 0, i.e. differences in heat stress are very slight and adaptation strain does not occur. in another cases dUTCIn is calculated as follows:
dUTCI
n= (UTCI
n_d– UTCI
n_h)·100
(7)adaptation strain related to differences in water loss due to sweating is assessed as follows:
dSW
n= (SW
n_d– SW
n_h)·100
(8)However, adaptation strain caused by the changes in predicted clothing insula-tion is calculated with the following equainsula-tion:
dIclp
n= (Iclp
n_h– Iclp
n_d)·100
(9)4) as mentioned above, different adaptation reactions are specific to particular ranges of ambient conditions (table i). the need to adapt to cold environments is indica ted by dUTCIn below 0. in case of adaptation to heat conditions the dUTCIn is above 0.
adaptation strain to cold is assessed by both the differences in UTCI and Iclp between compared sites. the ASI equation has the following mathematical form:
if dUTCI
n<0 ASI = (dUTCI
n+ dIclp
n)/2
(10)adaptation strain to heat is a function of differences in Universal thermal Cli-mate index (UTCI) and water loss due to sweating (SW). in this case ASI is cal-culated as follows:
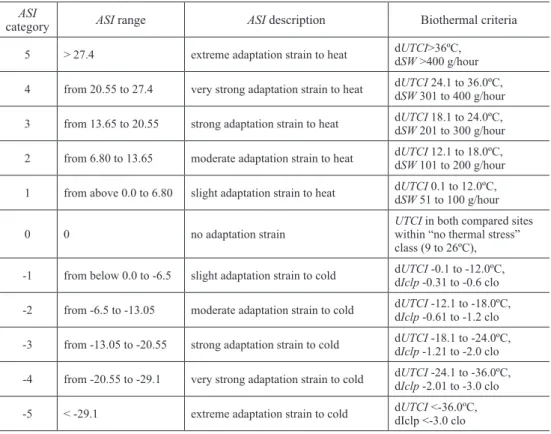
table ii – Categories of adaptation strain index (ASI) and their biothermal criteria.
Quadro II – Critérios biotérmicos para a delimitação de categorias de Adaptation Strain Index (ASI).
ASI
category ASI range ASI description Biothermal criteria 5 > 27.4 extreme adaptation strain to heat dUTCI>36ºC,dSW >400 g/hour
4 from 20.55 to 27.4 very strong adaptation strain to heat dUTCI 24.1 to 36.0ºC,dSW 301 to 400 g/hour
3 from 13.65 to 20.55 strong adaptation strain to heat dUTCI 18.1 to 24.0ºC,dSW 201 to 300 g/hour
2 from 6.80 to 13.65 moderate adaptation strain to heat dUTCI 12.1 to 18.0ºC,dSW 101 to 200 g/hour
1 from above 0.0 to 6.80 slight adaptation strain to heat dUTCI 0.1 to 12.0ºC,dSW 51 to 100 g/hour
0 0 no adaptation strain UTCI in both compared sites within “no thermal stress” class (9 to 26ºC),
-1 from below 0.0 to -6.5 slight adaptation strain to cold dUTCI -0.1 to -12.0ºC,dIclp -0.31 to -0.6 clo
-2 from -6.5 to -13.05 moderate adaptation strain to cold dUTCI -12.1 to -18.0ºC,dIclp -0.61 to -1.2 clo
-3 from -13.05 to -20.55 strong adaptation strain to cold dUTCI -18.1 to -24.0ºC,dIclp -1.21 to -2.0 clo
-4 from -20.55 to -29.1 very strong adaptation strain to cold dUTCI -24.1 to -36.0ºC,dIclp -2.01 to -3.0 clo
-5 < -29.1 extreme adaptation strain to cold dUTCI <-36.0ºC,diclp <-3.0 clo
Positive values of ASI indicate “warmer” and negative ASI illustrates “cooler” conditions at the chosen destination than at the home location. the values of adapta-tion strain index can be categorized in 11 classes, one neutral, five referring to adap-tation strain to heat and five representing adapadap-tation strain to cold (table ii). each strain category has specific biothermal criteria.
the adaptation strain index was calculated for each day of the studied period (1991-2000) and for every pair of compared stations. Mean ASI values and frequen-cies of its particular categories were used as characteristics for monthly periods and for seasons.
iii. resULts
1. General adaptation strain levels
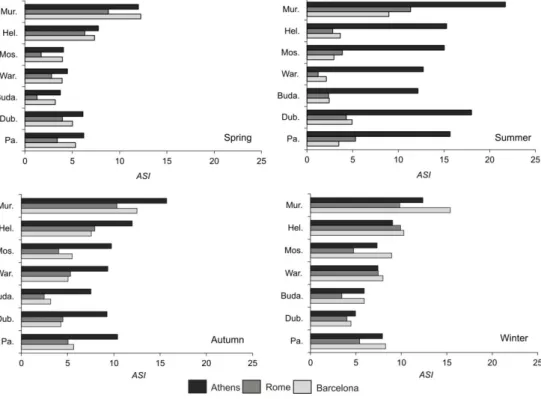
the analysis of mean ASI values in particular seasons show that the greatest intensities of adaptation strain occur in the summer months (fig. 3b). When tra velling
to athens the tourists from each studied central/northern european cities can experi-ence, on average, at least a strong adaptation strain to heat (for the citizens of Mur-mansk the average ASI values go up to very strong heat stress category, ASI=4, table ii and fig. 3b). travelling to rome and Barcelona in summer is less oppressive for tourists from central and northern europe than visiting athens. taking Murmansk as a starting point, the mean ASI values are within category 1, of slight adaptation strain to heat (table ii). travelling to athens in spring and autumn is more stressful than visiting rome and Barcelona (fig. 3a and c). However, mean seasonal ASI va lues for arrivals in each Mediterranean city are mostly within category 1– slight adap tation strain to heat (ASI range from 0 to 6.8, table ii). Only citizens from northern cities (Helsinki, Murmansk) will experience moderate intensity of adap tation to heat (cate-gory 2, ASI=6.8 to 13.65, table ii). in winter months (fig. 3d), travelling to Medi-terranean cities can lead to slight (for citizens of Dublin and Budapest), mode rate (for citizens of Paris, Warsaw, Moscow and Helsinki) or to strong (in case of visitors from Murmansk) adaptation strain to “hot” conditions (fig. 3).
fig. 3 – Mean seasonal values of adaptation strain index (ASI) for athens, Barcelona and rome (1991-2000) (see table ii to identify ASI categories and fig. 1 to locate tourists’ origin).
Fig. 3 – Valores médios estacionais de ASI para Atenas, Barcelona e Roma (1991-2000) (Ver quadro II para identificar as categorias de ASI e a fig. 1 para localização
the general information about mean adaptation strain levels are insufficient for a better understanding of the climatic risk related to a sudden change of ther-mal envi ronment. We should also know the possible range of adaptation strain and the frequencies of ASI categories which occur at particular destinations in europe.
When planning tourist visits we consider several factors, e.g. attractiveness, price, transportation facilities, possible weather. for many tourists weather plays a very important role in the choice of destination and time of the year for their holi-days. Many of us search for climates which differ from our domestic con ditions, being war mer or cooler than the climate we are living in. While young healthy people can adapt fairly easily to sudden changes of climate/weather con ditions, for children, elderly and unhealthy people adaptation to new ambient condition s can be very stressful, especially for the circulatory system. thus, for these groups of people, we must consider in detail which adaptation strain their organisms can be exposed to.
2. Spring
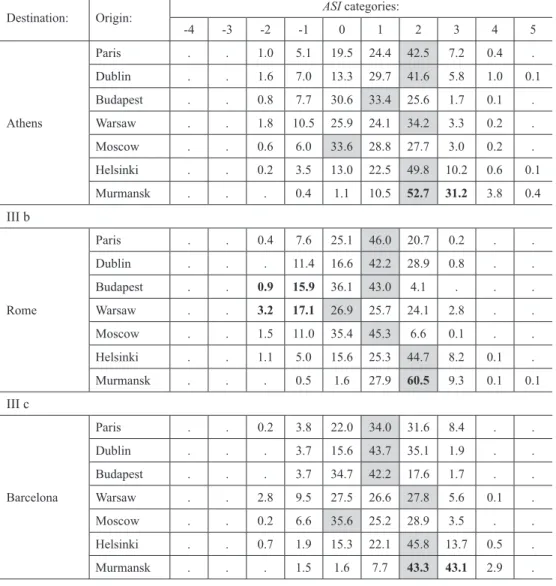
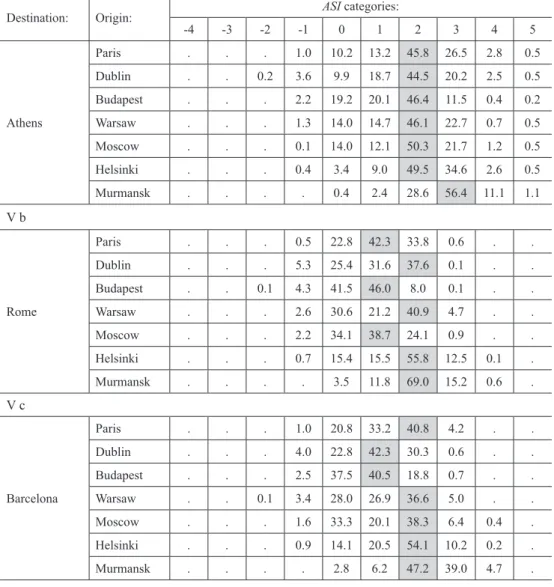
in spring months (March to May) travelling from the majority of the origin locations to Mediterranean destinations leads most frequently to slight or moderate adaptation strain (ASI categories 1 and 2). the “no adaptation strain” category is relatively frequent. this situation occurs during 13-20% of days when travelling from Dublin, Paris and Helsinki and during 26-34% of days in case of Warsaw, Budapest and Moscow. it is surprising that for some pairs of stations (Moscow-athens, Moscow-Barcelona and Warsaw-rome) “no thermal strain” category is the most frequent. to explain this phenomenon more detailed research is needed. spring travels to Mediterranean region from most northerly located sites in europe (e.g. Murmansk) lead to moderate (43.3% of days in case of Barcelona and 60.5% of days in case of rome) or strong (up to 43.1% of days in case of traveling to Barce lona) adaptation strain to hot conditions. Considering ASI values we can also find that there are not substantial differences in adaptation strain when comparing particular Mediterranean destinations (tables iii a, b and c). it is also interesting that thermal conditions in Mediterranean cities in spring are sometimes cooler than in some of the studied origin locations. for example in rome, citizens of Warsaw and Budapest can experience slight and moderate adaptation strain to cold during about 20% and 17% of spring days, respectively (figures in bold on table iii b). the smallest frequency of such “reverse” thermal situations is observed in the case of Barcelona (table iii d).
table iii – frequency of ASI categories in spring (March-May) for three Mediterranean tourist destinations in europe (%). Highest values in each line are highlighted; in bold:
figures referred to in the text.
Quadro III – Frequência de categorias de ASI na Primavera (Março a Maio) para três destinos turísticos no Mediterrâneo (%). A cinzento, valores mais altos em cada linha;
a negrito, alguns valores referidos no texto.
iii a
Destination: Origin: ASI categories:
-4 -3 -2 -1 0 1 2 3 4 5 athens Paris . . 1.0 5.1 19.5 24.4 42.5 7.2 0.4 . Dublin . . 1.6 7.0 13.3 29.7 41.6 5.8 1.0 0.1 Budapest . . 0.8 7.7 30.6 33.4 25.6 1.7 0.1 . Warsaw . . 1.8 10.5 25.9 24.1 34.2 3.3 0.2 . Moscow . . 0.6 6.0 33.6 28.8 27.7 3.0 0.2 . Helsinki . . 0.2 3.5 13.0 22.5 49.8 10.2 0.6 0.1 Murmansk . . . 0.4 1.1 10.5 52.7 31.2 3.8 0.4 iii b rome Paris . . 0.4 7.6 25.1 46.0 20.7 0.2 . . Dublin . . . 11.4 16.6 42.2 28.9 0.8 . . Budapest . . 0.9 15.9 36.1 43.0 4.1 . . . Warsaw . . 3.2 17.1 26.9 25.7 24.1 2.8 . . Moscow . . 1.5 11.0 35.4 45.3 6.6 0.1 . . Helsinki . . 1.1 5.0 15.6 25.3 44.7 8.2 0.1 . Murmansk . . . 0.5 1.6 27.9 60.5 9.3 0.1 0.1 iii c Barcelona Paris . . 0.2 3.8 22.0 34.0 31.6 8.4 . . Dublin . . . 3.7 15.6 43.7 35.1 1.9 . . Budapest . . . 3.7 34.7 42.2 17.6 1.7 . . Warsaw . . 2.8 9.5 27.5 26.6 27.8 5.6 0.1 . Moscow . . 0.2 6.6 35.6 25.2 28.9 3.5 . . Helsinki . . 0.7 1.9 15.3 22.1 45.8 13.7 0.5 . Murmansk . . . 1.5 1.6 7.7 43.3 43.1 2.9 .
table iV – frequency of ASI categories in summer (June-august) for three Mediterranean tourist destinations in europe (%). Highest values in each line are highlighted; in bold:
figures referred to in the text.
Quadro IV – Frequência de categorias de ASI no Verão (Junho a Agosto) para três destinos turísticos no Mediterrâneo (%). A cinzento, valores mais altos em cada linha;
a negrito, alguns valores referidos no texto.
iV a
Destination: Origin: ASI categories:
-4 -3 -2 -1 0 1 2 3 4 5 athens Paris . . . 1.6 4.7 5.0 29.0 38.3 14.7 6.8 Dublin . . . 0.1 4.9 1.1 21.2 40.0 21.4 11.3 Budapest . . . 3.0 6.3 10.9 41.7 27.8 6.8 3.5 Warsaw . . . 10.4 4.7 10.2 29.6 29.1 10.6 5.5 Moscow . . . 4.4 5.2 4.7 30.1 33.0 14.9 7.7 Helsinki . . . 2.2 5.8 8.2 28.2 30.0 16.8 8.8 Murmansk . . . . 2.1 0.9 7.3 37.9 32.3 19.6 iVb rome Paris . . . 5.0 34.8 18.7 34.1 7.3 0.2 . Dublin . . 0.1 1.0 37.2 23.0 38.2 0.5 . . Budapest . . 0.1 15.8 44.0 23.8 15.3 1.1 . . Warsaw . . 2.7 13.2 35.0 36.4 12.3 . . . Moscow . . 1.1 18.2 37.7 8.3 25.8 8.3 0.6 . Helsinki . . 1.6 5.9 38.9 29.0 24.3 0.2 . . Murmansk . . . 0.4 19.6 3.9 32.6 37.3 6.2 0.1 iVc Barcelona Paris . . 0.6 2.1 27.9 45.5 23.2 0.8 . . Dublin . . . 0.2 30.0 25.8 43.7 0.2 . . Budapest . . . 1.2 34.1 53.8 9.5 1.4 . . Warsaw . 0.7 1.7 9.2 28.6 42.6 16.8 0.2 . . Moscow . . 0.2 5.0 29.4 49.8 15.3 0.3 . . Helsinki . . 0.7 3.0 31.5 35.9 28.5 0.4 . . Murmansk . . . 0.1 15.3 9.8 53.7 21.1 . . 3. Summer
summer is the season with the most differentiated adaptation strain. the strongest adaptation is needed when travelling to athens. for most of the origin loca-tions, moderate (ASI category 2) and strong (category 3) adaptation strain to heat
occurs in more than 60% of days (table iV a). Murmansk citizens can expe rience strong (ASI category 3) and very strong (category 4) heat adaptation in 70.2% of sum-mer days (table iV a, bold figures). Moreover, during about 20% of days they can suffer even extreme adaptation strain to heat (ASI=5). Comparing thermal conditions found in rome and Barcelona by northern and Central european tourists (except from Murmansk) we find that they do not differ so significantly as in athens. While in athens “no thermal strain” category is very rare, in the other locations it is very fre-quent. a great number of summer days in Barcelona and rome (28-44%) are charac-terized by very similar thermal conditions (to other stations, except Murmansk) and adaptation is not needed (category 0). 16-19% of summer days in Warsaw, Buda pest and Moscow can be warmer than in rome (categories -1 and -2) and adaptation to cold is needed. However, in 40-49% of the days tra vellers from these cities to rome can experience slight (category 1) and moderate (category 2) adaptation strain to heat. for all other Mediterranean locations citizens from central and northern cities can expe rience slight to very strong adaptation to heat in 30-70% of the days (table iV).
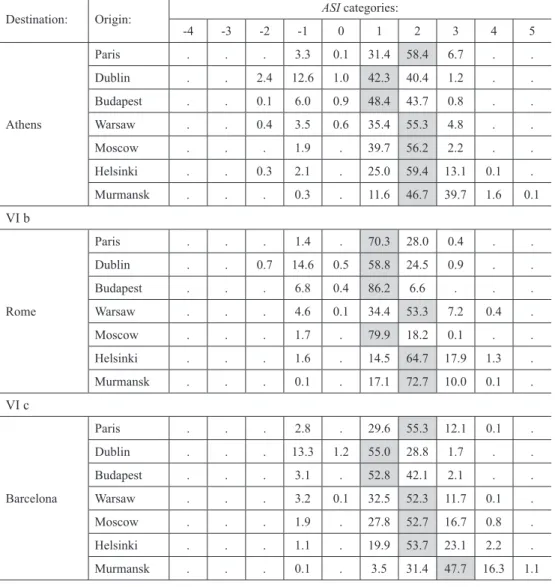
4. autumn
in autumn months (september-november) moderate adaptation to heat was the most frequently found ASI category (table ii and V a). When travelling to athens tourists must be prepared to meet this thermal contrast in 45-50% of days. for visi-tors from Murmansk the adaptation strain is even greater: about 97% of days are characterized by at least moderate adaptation strain to heat (56.4% of days with strong adaptation strain). thermal differences between studied origin locations and Barcelona are similar to those observed for athens. Only travellers from Dublin and Budapest can expect a little milder condition (40-42% of days with slight adap-tation strain, category 1) when traveling to Barcelona. in autumn, rome is the most favou rable Mediterranean city for tourists from central europe: 22.8-41.5% of days are characterised by “no adaptation strain” ASI category. Days with slight adaptation to heat are also very frequent (21.2-46%). However, travellers from northern scandi-navia to rome can experience very frequently moderate (55.8-69%) or strong (12.5-15.2%) adaptation strain to hot conditions (table V b).
5. Winter
Winter is the season with the highest temperature differences between Medi-terranean and other parts of europe. as a result neutral adaptation conditions (“no adaptation strain”) occur only occasionally. for all destinations slight or moderate adaptation strain to “hot” conditions (categories 1 and 2) can be experienced by the visitors from central european cities in the majority of days (80-98%). the travellers from northern origins (Murmansk) can suffer strong adaptation strain (category 3) during 10% of days in rome and 40-48% of days in athens and Barcelona. a sig-nificant frequency of ASI category 3 (12-17%) is also observed in case of Barcelona when travelling there from Paris, Warsaw and Moscow (table Vi).
table V – frequency of ASI categories in autumn (september-november) for three Mediterranean tourist destinations in europe (%). Highest values in each line
are highlighted; in bold: figures referred to in the text.
Quadro V – Frequência de categorias de ASI no Outono (Setembro-Novembro) para três destinos turísticos no Mediterrâneo (%). A cinzento, valores mais altos em cada linha;
a negrito, alguns valores referidos no texto.
V a
Destination: Origin: ASI categories:
-4 -3 -2 -1 0 1 2 3 4 5 athens Paris . . . 1.0 10.2 13.2 45.8 26.5 2.8 0.5 Dublin . . 0.2 3.6 9.9 18.7 44.5 20.2 2.5 0.5 Budapest . . . 2.2 19.2 20.1 46.4 11.5 0.4 0.2 Warsaw . . . 1.3 14.0 14.7 46.1 22.7 0.7 0.5 Moscow . . . 0.1 14.0 12.1 50.3 21.7 1.2 0.5 Helsinki . . . 0.4 3.4 9.0 49.5 34.6 2.6 0.5 Murmansk . . . . 0.4 2.4 28.6 56.4 11.1 1.1 V b rome Paris . . . 0.5 22.8 42.3 33.8 0.6 . . Dublin . . . 5.3 25.4 31.6 37.6 0.1 . . Budapest . . 0.1 4.3 41.5 46.0 8.0 0.1 . . Warsaw . . . 2.6 30.6 21.2 40.9 4.7 . . Moscow . . . 2.2 34.1 38.7 24.1 0.9 . . Helsinki . . . 0.7 15.4 15.5 55.8 12.5 0.1 . Murmansk . . . . 3.5 11.8 69.0 15.2 0.6 . V c Barcelona Paris . . . 1.0 20.8 33.2 40.8 4.2 . . Dublin . . . 4.0 22.8 42.3 30.3 0.6 . . Budapest . . . 2.5 37.5 40.5 18.8 0.7 . . Warsaw . . 0.1 3.4 28.0 26.9 36.6 5.0 . . Moscow . . . 1.6 33.3 20.1 38.3 6.4 0.4 . Helsinki . . . 0.9 14.1 20.5 54.1 10.2 0.2 . Murmansk . . . . 2.8 6.2 47.2 39.0 4.7 .
table Vi – frequency of ASI categories in winter (December-february) for three Mediterranean tourist destinations in europe (%). Highest values
in each line are highlighted.
Quadro VI – Frequência de categorias de ASI no Inverno (Dezembro a Fevereiro) para três destinos turísticos no Mediterrâneo (%). A cinzento, valores
mais altos em cada linha.
Vi a
Destination: Origin: ASI categories:
-4 -3 -2 -1 0 1 2 3 4 5 athens Paris . . . 3.3 0.1 31.4 58.4 6.7 . . Dublin . . 2.4 12.6 1.0 42.3 40.4 1.2 . . Budapest . . 0.1 6.0 0.9 48.4 43.7 0.8 . . Warsaw . . 0.4 3.5 0.6 35.4 55.3 4.8 . . Moscow . . . 1.9 . 39.7 56.2 2.2 . . Helsinki . . 0.3 2.1 . 25.0 59.4 13.1 0.1 . Murmansk . . . 0.3 . 11.6 46.7 39.7 1.6 0.1 Vi b rome Paris . . . 1.4 . 70.3 28.0 0.4 . . Dublin . . 0.7 14.6 0.5 58.8 24.5 0.9 . . Budapest . . . 6.8 0.4 86.2 6.6 . . . Warsaw . . . 4.6 0.1 34.4 53.3 7.2 0.4 . Moscow . . . 1.7 . 79.9 18.2 0.1 . . Helsinki . . . 1.6 . 14.5 64.7 17.9 1.3 . Murmansk . . . 0.1 . 17.1 72.7 10.0 0.1 . Vi c Barcelona Paris . . . 2.8 . 29.6 55.3 12.1 0.1 . Dublin . . . 13.3 1.2 55.0 28.8 1.7 . . Budapest . . . 3.1 . 52.8 42.1 2.1 . . Warsaw . . . 3.2 0.1 32.5 52.3 11.7 0.1 . Moscow . . . 1.9 . 27.8 52.7 16.7 0.8 . Helsinki . . . 1.1 . 19.9 53.7 23.1 2.2 . Murmansk . . . 0.1 . 3.5 31.4 47.7 16.3 1.1
iV. DisCUssiOn anD COnCLUsiOns
to our knowledge no in-depth comparative studies of bioclimatic contrasts in europe have been published. However, research by Matzarakis and Mayer (1991, 1997) indicate severe, hot bioclimatic conditions during the summer season in athens. the authors ascertain that extreme hot conditions in summer months in the eastern part of Mediterranean can be stressful for populations from Central and northern europe. the high heat load of the athens climate was also reported by Błażejczyk and Szyguła (2004) when assessing bioclimatic conditions during the 2004 athen’s Olympic Games.
also, the Jendritzky’s maps (personal communication) which display the frequen cy distribution of various heat/cold stress categories over europe, show the peculiarity of Mediterranean bioclimate. this is demonstrated by the frequent occurren ce of heat stress. for other locations the frequencies of extreme heat/cold stress were similar to each other.
Błażejczyk and Kunert (2010) have found significant regional differences of european climate in summer and winter seasons. When analysing the frequencies of particular ranges of Universal thermal Climate index (UTCI) they have noted the predominance of extreme heat stress in summer in the whole Mediterranean region. On the other hand, high cold stress was very frequently observed in Central europe and in the scandinavian region.
the present research confirms the results obtained by Matzarakis and Mayer (1991, 1997), Blazejczyk and Szyguła (2004), Nastos and Matzarakis (2013), Cohen
et al. (2013) as well as Bleta et al. (2013). the authors studied bioclimatic conditions
in various parts of Greece. they confirm the occurrence of high heat stress during summer months. such stress is a limiting factor for active recreation and tourism activity. similarly, loaded thermal conditions in summer were also reported for Lisbon by Oliveira and andrade (2007).
Lindner-Cendrowska (2013a, 2013b) compared thermal conditions in three euro pean cities: Madrid, Warsaw and stockholm. she has found that the summer months in Madrid can be unfavourable for physical activity, especially for foreign tourists. However, she also reported that in Warsaw tourists can meet stressing ther-mal conditions in summer, mainly in July.
the results of the present research show that the adaptation strain index (ASI) is a useful measure of bioclimatic contrasts between different locations. ASI provides practical recommendations regarding direction and intensity of adaptation processes in human organism.
When travelling to Mediterranean destinations the residents of central and northern europe must remember to pack appropriated clothing, usually lighter than used at home. However, in spring and in autumn, thermal conditions in Medi terranean cities are some-times cooler (15-20% of days) than in the studied origin locations and tourists should also have warm clothing. summer is the season when strong adaptation strain is experienced. Visitors must remember not only to wear light clothing but also to drink enough water to
protect themselves against dehydration (the strongest dehydration risk occurs in eastern part of Mediterranean). Winter is the season with relatively mild thermal condition in southern europe. However, in central and northern parts of the continent thermal condi-tions are rather severe and differ greatly with the Mediterranean climate. it causes slight or moderate adaptation strain to heat and the adaptation time can be longer (up to 5-6 days) than in other seasons.
aCKnOWLeDGeMents
the study was carried out in the frame of research co-operation between institute of Geography and spatial Organization, Polish academy of sciences and institute of Geography, russian academy of sciences within the project “assessment of the potential of european bioclimate for recreation and tourism”. Part of the data was obtained through the eU PHeWe project “assessment and Prevention of acute Health effects of Weather Conditions in europe” (QLK4-Ct-2001-00152).
BiBLiOGraPHy
Beaumont van W, Bullard rW (1965) sweating: Direct influence of skin temperature. Science, 147(3664): 1465-1467.
BioKlima 2.6, software package, www.igipz.pan.pl/ geoekoklimat/blaz/bioklima.htm
Blanc le J (1975) Man in the cold. ChC thomas Publ, springfield.
Błażejczyk K (2011) Assessment of regional biocli-matic contrasts in Poland. Miscellanea Geo-graphica, 15: 77-91.
Błażejczyk K (2007) Multiannual and seasonal weather fluctuations and tourism in Poland. In Amelung B, Błażejczyk K, Matzarakis A (eds.) Climate Change and Tourism Assess-ment and Copying Strategies, Maastricht– Warsaw–freiburg: 69-90.
Błażejczyk K, Broede P, Fiala D, Havenith G, Hol-mér i, Jendritzky G, Kampmann B, Kunert a (2010) Principles of the new Universal ther-mal Climate index (UtCi) and its application to bioclimatic research in european scale. Miscelanea Geographica, 14: 91-102. Błażejczyk K, Kunert A (2010) Warunki
biokli-matyczne wybranych aglomeracji Europy i Polski [Bioclimatic conditions of selected agglomerations in europe and in Poland]. In Bednorz e, Kolendowicz L (eds.) Klimat Polski na tle klimatu Europy, Zmiany i konsekwencje. Bogucki Wyd. naukowe, Poznań: 93106.
Błażejczyk K, Szyguła Z (2004) Wpływ gorącego otoczenia na zdolność wysiłkową sportowca. Jak przygotować zawodnika do startu w igrzyskach Olimpijskich w atenach? (the influen ce of hot environment on physical effec-tiveness at competitors of Olympic Games in athens). Sport Wyczynowy, 42(5/6):45-63. Bleta a, nastos Pt, Matzarakis a (2013)
assess-ment of bioclimatic conditions on Crete island, Greece. Reg Environ Change, DOi 10.1007/s10113-013-0530-7
Bröde P, fiala D, Blazejczyk K, Holmér i, Jendritzk y G, Kampmann B, tinz B, Havenith G (2012) Deriving the Operational Procedure for the Universal thermal Climate index UtCi. Int J Biometeorol, 56: 481-494.
Burton aC, edholm OG (1955) Man in a cold envi-ronment. e. arnold Publ., London.
Clark rP, edholm OG (1985) Man and his thermal environment. e. arnold Ltd., London. Cohen P, Potchter O, Matzarakis a (2013) Human
thermal perception of Coastal Mediterranean outdoor urban environments. Applied Geogra phy 37: 1-10.
elizondo rs, Bullard rW (1971) Local determination of sweating and the assessment of the “set point”. Int J Biometeorol, 15(2-4): 273-280. fiala D, Lomas KJ, stohrer M (2001) Computer
pre-diction of human thermoregulatory and tem-perature responses to a wide range of
environ-i Iclp index is mostly dedicated to cold conditions. thus, because of its mathematical formula-tion in warm and hot environments Iclp can be below 0. Before applying Iclp their values lower than 0.3 clo must be assumed as 0.3 clo (0.3 clo refers to very light beach clothing).
ii the authors intended to use the widest representation of stations in europe. However, they had only the listed stations at their disposal. some stations (as e.g. London) were excluded from com-parisons because of incompleteness of daily meteorological data.
mental conditions. Int J Biometeorol, 45: 143-159.
fiala D, Lomas KJ, stohrer M (1999) a computer model of human thermoregulation for a wide range of environmental conditions: the pas-sive system. J Appl Physiol, 87(5): 1957-1972. fourt J, Hollies nrs (1970) Clothing. Comfort and
function. M. Dekker inc., new york. de freitas Cr, Grigorieva ea (2009) the
acclimati-zation thermal strain index (atsi): a preli-minary study of the methodology applied to climatic conditions of the russian far east. Int J Biometeorol, 53: 307-315.
Garden JW, Wilson iD, rasch PJ (1966) acclima-tization of healthy young adult males to a hot-wet environment. J Appl Physiol, 21(2): 665-669.
Givoni B, Goldman rf (1973) Predicting effects of heat acclimatization on heart rate and rectal temperature. J Appl Physiol, 35(6): 875-879. Havenith G, fiala D, Blazejczyk K, richards M,
Bröde P, Holmer i, rintamaki H, Benshabat y, Jendritzky G (2012) the UtCi-Clothing Model. Int J Biometeorol, 56: 461-470. Hensel H (1981) Thermoreception and temperature
regulation. academic Press, London. Holmér i (1988) assessment of cold stress in terms
of required clothing insulation - ireQ. Int J Industrial Ergonomics, 3:159-166.
isO/Dis 11079, Evaluation of cold environments. Determination of required clothing insula-tion. international Organisation of standardi-zation, Geneva.
Jendritzky G, de Dear r (2008) adaptation and the thermal environment. In ebi KL, Burton i, McGregor G (eds.) Biometeorology for Adaptation to Climate Variability and Change: Research Frontiers and Perspec-tives. springer, Heidelberg: 9-32.
Kenney WL (1985) a review of comparative respon-ses of men and women to heat stress. Environ Res, 37(1): 1-11.
Koppe C, Jendritzky G (2005) inclusion of short-term adaptation to thermal stresses in a heat
load warning procedure. Meteorol Zeit, 14(2): 271-278.
Lindner-Cendrowska K (2013a) assessment of bio-climatic conditions in cities for tourism and recreational purposes (a Warsaw case study), Geographia Polonica, 86(1): 55-66.
Lindner-Cendrowska K (2013b) Evaluation of bio-climatic conditions for tourism and recrea-tion in selected European cities. PhD thesis (in Polish), University of Warsaw, faculty of Geography and regional studies.
Mateeva Z, filipov a (2003) Bioclimatic distance index in the Rila-and-Rhodopy area of Bul-garia. In Błażejczyk K, Krawczyk B, Kuchcik M (eds.) Postępy w badaniach kli-matycznych i bioklikli-matycznych. Prace Geogra ficzne iGiPZ Pan, 188: 295-302. Matzarakis a, Mayer H (1997) Heat stress in
Greece. Int J Biometeorol, 41:34-39. Matzarakis a, Mayer H (1991) the extreme heat
wave in athens in July 1987 from the point of view of Human Biometeorology. Atm Enviro n, 25B: 203-211.
nastos P, Matzarakis a (2013) Human Bioclimatic Conditions, trends, and Variability in the athens University Campus, Greece. Advan-ces in Meteorology, Vol. 2013, article iD 976510, 8 pages, http://dx.doi. org/10.1155/2013/976510. Hindawi Publi-shing Corporation.
Oliveira s, andrade H (2007) an initial assessment of the bioclimatic comfort in an outdoor public space in Lisbon. Int J Biometeorol, 52: 69-84. Parsons KC (2003) Human thermal environments:
the effects of hot, moderate, and cold environ-ments on human health, comfort and perfor-mance. taylor & francis, London, new york. rusanov V (1989) appraisal of Meteorological Con-ditions defining Human respiration. Bull. Rus. Academy of Medical Scien., 1: 7-60. UnWtO tourism Highlights (2013) Edition, avai
la-ble at http://mkt.unwto.org/publication/ unwt o-tourism-highlights-2013-edition (feb. 16, 2014)