Braz. J. of Develop.,Curitiba, v. 6, n.6, p.36755-36775 jun. 2020. ISSN 2525-8761
Different methodological approaches to natural vulnerability to erosion in
southeastern Brazil
Diferentes abordagens metodológicas da vulnerabilidade natural à erosão
no sudeste do Brasil
DOI:10.34117/bjdv6n6-276
Recebimento dos originais:08/05/2020 Aceitação para publicação:12/06/2020
Ana Claudia Pereira Carvalho
PhD student in Environmental Sciences from the Federal University of São Carlos Institution: Federal University of São Carlos, Center for Biological and Health Sciences,
Environmental Sciences Department
Address: Highway Washington Luís, Km 235 - São Carlos, SP - Brazil E-mail: [email protected]
Diego Peruchi Trevisan
PhD student in Environmental Sciences from the Federal University of São Carlos Institution: Federal University of São Carlos, Center for Biological and Health Sciences,
Environmental Sciences Department
Address: Highway Washington Luís, Km 235 - São Carlos, SP - Brazil E-mail: [email protected]
Ana Paula Jacó
Master in Environmental Sciences from the Federal University of São Carlos Institution: Federal University of São Carlos, Center for Biological and Health Sciences,
Environmental Sciences Department
Address: Highway Washington Luís, Km 235 - São Carlos, SP - Brazil E-mail: [email protected]
Naara Aline Tossani de Melo
Master in Environmental Sciences from the Federal University of São Carlos Institution: Federal University of São Carlos, Center for Biological and Health Sciences,
Environmental Sciences Department
Address: Highway Washington Luís, Km 235 - São Carlos, SP - Brazil E-mail: [email protected]
Polyanna da Conceição Bispo
PhD in Remote Sensing from the National Institute for Space Research
Institution: Leicester Institute for Space and Earth Observation, Centre for Landscape and Climate Research, School of Geography, Geology and the Environment, University of
Leicester,
Address: Bennett Building University Road, LE1 7RH, Leicester - United Kingdom E-mail: [email protected]
Braz. J. of Develop.,Curitiba, v. 6, n.6, p.36755-36775 jun. 2020. ISSN 2525-8761 Luciana Ruggiero Bachega
PhD in Environmental Sciences from the Federal University of São Carlos Institution: Federal University of São Carlos, Center for Biological and Health Sciences,
Environmental Sciences Department
Address: Highway Washington Luís, Km 235 - São Carlos, SP - Brazil E-mail: [email protected]
Junio da Silva Luiz
Master in Environmental Sciences from the Federal University of São Carlos Institution: Federal University of São Carlos, Center for Biological and Health Sciences,
Environmental Sciences Department
Address: Highway Washington Luís, Km 235 - São Carlos, SP - Brazil E-mail: [email protected]
José Augusto Di Lollo
PhD in Geotechnics from the São Carlos School of Engineering Institution: São Paulo State University, Department of Civil Engineering
Address: Brazil Avenue - Center - lha Solteira/SP - CEP 15385-000 E-mail: [email protected]
Luiz Eduardo Moschini
PhD in Ecology and Natural Resources from the Federal University of São Carlos Institution: Federal University of São Carlos, Center for Biological and Health Sciences,
Environmental Sciences Department
Address: Highway Washington Luís, Km 235 - São Carlos, SP - Brazil E-mail: [email protected]
Reinaldo Lorandi
PhD in Soil and Plant Nutrition from the University of São Paulo
Institution: Federal University of São Carlos, Center for Biological and Health Sciences, Environmental Sciences Department
Address: Highway Washington Luís, Km 235 - São Carlos, SP - Brazil E-mail: [email protected]
ABSTRACT
The natural vulnerability addresses the processes of morphogenesis and pedogenesis integrating information related to the rocky substrate, soils, geomorphology, vegetation. The study of natural variability is essential for understanding ecosystems in the face of change processes in the environment. This work aimed to analyze the natural vulnerability to the occurrence of erosion, adopting a method based on Crepani and Analysis Hierarchical Process (AHP) method in the Rio Claro Watershed - São Paulo - Brasil. Four information plans were used in the 1:50000 scale, being: geomorphology, pedology, geology and vegetation/anthropic intervention. The Natural Vulnerability to Erosion Chart is classified into five classes (Very Low, Low, Average, High, and Very High). Comparing the charts generated by the two methods based on Crepani et al. (2001) and Saaty (1980), there was a difference in the Very Low and High vulnerability classes. The most evident class in both charts is the average vulnerability, corresponding 94.55km² of the area in Crepani Method chart, and 93.34km² in AHP Method chart, followed by the “Low” class corresponding of 55.56km² and 76.67% respectively the Crepani and AHP methods. For the "High" class there was a decrease of
Braz. J. of Develop.,Curitiba, v. 6, n.6, p.36755-36775 jun. 2020. ISSN 2525-8761 48.28% when compared to the two cards, the "Very high" class suffered the least change (-0.09%), while the "Very low" class increased above 100%. The methods employed allowed the generation of results that show the reality of the study area, it is worth mentioning that the Crepani method is more generic because it considers the similarity of the information plans for the vulnerability analysis, whereas the AHP method presents the advantage of hierarchizing both information plans and their classes, highlighting the relative importance of natural vulnerability to erosion.
Keywords: AHP Method; Crepani Method; Natural Vulnerability; Anthropic Activity; GIS. RESUMO
A vulnerabilidade natural aborda os processos de morfogênese e pedogênese integrando informações relacionadas ao substrato rochoso, solos, geomorfologia, vegetação. O estudo da variabilidade natural é essencial para a compreensão dos ecossistemas frente aos processos de mudança no ambiente. Este trabalho teve como objetivo analisar a vulnerabilidade natural à ocorrência de erosão, adotando um método baseado no método Crepani e Processo Hierárquico de Análise (AHP) na Bacia Hidrográfica do Rio Claro - São Paulo - Brasil. Quatro planos de informação foram utilizados na escala de 1:50.000, sendo: geomorfologia, pedologia, geologia e vegetação/intervenção antrópica. A Carta de Vulnerabilidade Natural à Erosão é classificada em cinco classes (Muito Baixa, Baixa, Média, Alta e Muito Alta). Comparando-se as cartas geradas pelos dois métodos baseados em Crepani et al. (2001) e Saaty (1980), houve diferença nas classes de vulnerabilidade Muito Baixa e Alta. A classe mais evidente em ambas as cartas é a vulnerabilidade Média, correspondendo a 94,55km² da área na carta do Método Crepani, e 93,34km² na carta Método AHP, seguida pela classe “Baixa” correspondente de 55,56km² e 76,67%, respectivamente, os métodos Crepani e AHP. Para a classe "Alta", houve uma redução de 48,28% em relação às duas cartas, a classe "Muito Alta", sofreu a menor alteração (-0,09%), enquanto a classe "Muito Baixa" aumentou acima de 100%. Os métodos utilizados permitiram a geração de resultados que mostram a realidade da área de estudo, vale ressaltar que o método Crepani é mais genérico por considerar a similaridade dos planos de informação para a análise da vulnerabilidade, enquanto o método AHP apresenta a vantagem de hierarquizar tanto os planos de informação quanto suas classes, destacando a importância relativa da vulnerabilidade natural à erosão.
Palavras-chave: Método AHP; Método Crepani; Vulnerabilidade Natural; Atividade
Antrópica; SIG.
1 INTRODUCTION
The modernization of the productive processes along with the urbanization process and the population increase resulted in the appropriation and manipulation of the geographic space. Human actions for economic development increase negative impacts on the ecosystems functioning (CHAICHI; DAIM, 2018). In the various regions of the planet, the presence of natural areas replaced by urban areas is common. As a consequence, there are negative changes to natural ecosystems, compromising the services provided by them (TIESKENS et al., 2017). Erosion is severe in soil structure and productivity, in hydrological systems, as well as in habitats and their ecosystem services (YANG, et al., 2018).
Braz. J. of Develop.,Curitiba, v. 6, n.6, p.36755-36775 jun. 2020. ISSN 2525-8761 Ecological and environmental degradation are some of the impacts caused by erosion processes. The loss of agricultural and fishery productivity reduced tourist activities, increased costs to purify water, and damage to public health affect the economic costs of erosion. The total environmental, ecological and economic value that is provided by ecosystems surpasses the short-term costs for the execution of mitigating measures (CHICAS; OMINE; FORD, 2016).
It is fundamental to analyze the landscapes in local and regional context, as well as the study of typically urban ecological structures, aiming at the establishment of growth and density forms compatible with sustainable development goals (VAN ZANTEN et al., 2016).
In this context, environmental modeling has been established as an excellent method for obtaining knowledge and analyze the landscapes. Population issues, fragmentation effects, environmental vulnerability, the importance of corridors, changes in use and land cover, and landscape connectivity are among the themes most commonly addressed with models.
The indexes are important tools for characterizing landscapes, serving as indicators that provide information about the characteristics and conditions of a given geographic area, within a range of information directly linked to the objects of study (FAN; MYINT, 2014).
The ideal in the quantification of the structure of the landscape is the gathering of a variety of indexes, which allow obtaining, in a short time, the most important of the structure and pattern of a landscape in order to characterize and differentiate their spatial aspects (TURNER; SIMARD, 2017). In this paper, we present an overview of the different methodological approaches to natural vulnerability to erosion in southeastern Brazil.
In order for environmental planning to incorporate the analysis of environmental vulnerabilities, an integrated study of its elements is necessary, aiming to define the areas that require greater protection or that present greater restrictions and, above all, that require different actions for the management by the public bodies (TROMBETA, et al., 2014).
Several authors have developed indices and descriptive measures of landscapes spatial patterns (ZELLWEGER et al., 2014; TOPPING; DALBY; SKOV, 2016; AUFFRET et al., 2017; MALCOLM; LEHMAN, 2017; O’REILLY, 2018; HUMAGAIN et al., 2018). In this perspective, Geographic Information Systems (GIS) have been facilitated the activities related to characterization, diagnosis, and urban and environmental planning, assisting in tasks such as the simulation of geographic space and its natural processes, the integration of spatial information (MAVROMATIDI; BRICHE; CLAEYS, 2017).
Braz. J. of Develop.,Curitiba, v. 6, n.6, p.36755-36775 jun. 2020. ISSN 2525-8761 This work aimed to analyze the natural vulnerability to the occurrence of erosion, adopting the Crepani and Analysis Hierarchical Process (AHP) methods in the Rio Claro Watershed - São Paulo - Brazil.
2 MATERIALS AND METHODS
2.1 STUDY AREA
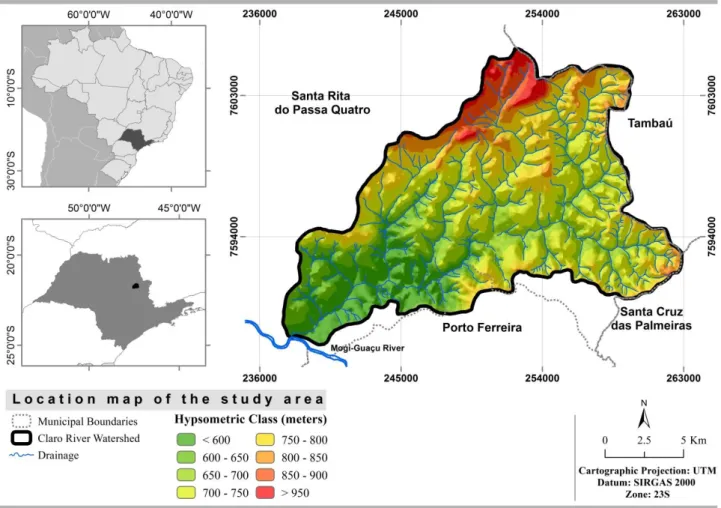
The Rio Claro Watershed (RCW) is located in the Santa Rita do Passa Quatro municipality between the coordinates 21,800682 and 21,632093 latitude south and 47,538946 and 47,292626 longitude west, with an area of 251.91km² (Figure 1). The Rio Claro River presents an average to high-density dendritic drainage (MARQUEZOLA et al., 2016) pattern and can be classified as a fifth-order watershed (STRAHLER, 1952).
Its main course is a tributary of the Guaçu River in the Paraná River Basin. Mogi-Guaçu Watershed is a Unit for Water Resources Management - UGRHI 9 (in Portuguese) defined in 1994 by the State Law No. 9.034 of 12/27/1994. This UGRHI is governed by the Mogi Guaçu River Basin Committee (CBH-MOGI), installed on June 05/04/1996.
The regional climate by Köppen is classified as Cwa with dry winter between October and April, and moist summer among May and September. The temperature ranges from 17.5ºC to 23.5ºC and the annual rainfall is 1.506mm (CEPAGRI-UNICAMP, 2017). The RCW is situated in one of the most important water source zones, the Guarani and the Serra Geral groundwater (DAEE-IG-IPT-CPRM, 2005).
Braz. J. of Develop.,Curitiba, v. 6, n.6, p.36755-36775 jun. 2020. ISSN 2525-8761
Figure 1- Study area geographic location.
Source: The authors.
Use and land cover of the studied area is mainly agribusiness activities like sugarcane, silviculture and cattle pastures. The development of these activities has replaced the natural land-cover, Brazilian semideciduous seasonal forests, Cerrado, which has been increased the deforestation rate (MARQUEZOLA et al., 2016).
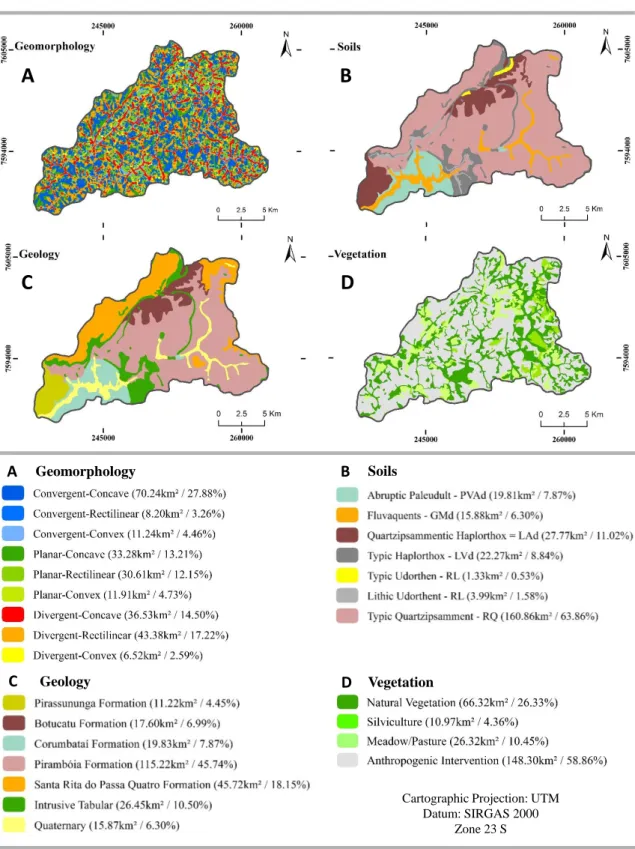
The RCW presents seven geological formations (Table 1), with the most evident evidence being Pirambóia and Santa Rita do Passa Quatro, occupying the area in 115.22 km² and 45.72 km², with a percentage of the area of 63, 89%. It is composed of hills with broad tabular tops, slope shapes average of 5 and 10% and dominant elevation between 500 e 650m.
Braz. J. of Develop.,Curitiba, v. 6, n.6, p.36755-36775 jun. 2020. ISSN 2525-8761
Table 1 - Geologic Formation in the River Claro Watershed.
Unit Era & Period Description
Quaternary Cenozoic; Holocene
Represented by broad plains that occur along the valley floor of Rio Claro River and its tributaries. They are constituted by alluvial and colluvial sediments of sandy texture due to the contribution of adjacent lithologies. The presence of organic matter on superficial layers is common.
Pirassununga
Formation Cenozoic; Tertiary
It is composed of light brown sandy-clayey sediments of the massive structure, poorly selected, with a line of quartz pebbles, quartzite, and limonite fragments at the base, overlapping in a discordant manner on the Corumbataí Formation. Santa Rita do Passa Quatro Formation Cenozoic; Tertiary
It consists of sands in a clayey matrix, friable, without sedimentary structures, or brown color, with a thickness of 5 to 15m, with basal gravel of predominantly quartz pebbles. In the area, these sediments present dispersed quartz granules.
Intrusive Tabular
Mesozoic;
Cretaceous
It consists of sequences of basaltic lavas spills and diabase dikes and sills, intensely fractured, of dense appearance and aphanitic texture. It is settled onto the sandstones of Botucatu Formation, with a maximum thickness of 80 meters.
Botucatu Formation
Mesozoic; Jura/ Cretaceous
Mainly constituted by aeolian sandstones attributed to deposits in desert environments, with fine to medium grain size, well-rounded particles and essentially Quartz composition (80%), thickness varies between 20 and 280 meters. It presents a large number of interconnected pores and high capacity to store and supply water. According to Iritani and Ezaki (2012), it is the main former of Guarani Aquifer.
Pirambóia Formation
Mesozoic; Triassic
This geological formation is comprised of fine sandstones that are regular to well sorted and are intercalated with clay layers and silty to sandy mudstones. The sandier units were deposited in a desert environment, as dune deposits, with interdune facies of silty sandstones, which contain aeolian ripples and bioturbation.
Corumbataí Formation
Paleozoic; Permian
Represented predominantly by clayey siltstones interbedded with sandy siltstones, consisting of illite, quartz, feldspars, carbonates, hematite, montmorillonite, chlorite and zeolites, of authigenic and/or detrital origin.
Braz. J. of Develop.,Curitiba, v. 6, n.6, p.36755-36775 jun. 2020. ISSN 2525-8761 2.2. METHODS
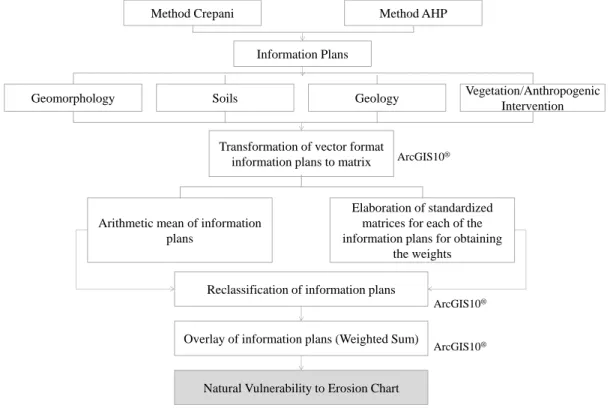
The method used to prepare the Natural Vulnerability to Erosion Chart was based on the application of the Crepani and Analysis Hierarchical Process (AHP) methods. Figure 3 shows the steps developed for the elaboration of the cartographic document where four information plans were used in the 1:50000 scale, being: geomorphology, pedology, geology and vegetation/anthropic intervention (Figure 2).
Table 2 presents the sources of information plans. The environmental attribute "Vegetation" includes natural vegetation (forest), country (field and pasture) and silviculture, while other uses of land were considered as the anthropic intervention. The anthropic intervention and vegetacion map was elaborated in ArcGIS10.5® software based on Landsat 8 image dated February 2017.
Braz. J. of Develop.,Curitiba, v. 6, n.6, p.36755-36775 jun. 2020. ISSN 2525-8761
Figure 2 - Information plans for the Natural Vulnerability to Erosion Chart generation.
Source: The authors.
A
B
C
D
B D A CCartographic Projection: UTM Datum: SIRGAS 2000
Zone 23 S
Geomorphology Soils
Braz. J. of Develop.,Curitiba, v. 6, n.6, p.36755-36775 jun. 2020. ISSN 2525-8761
Figure 3 - Steps developed for the cartographic document elaboration.
Source: The authors.
Table 2 - Source used for the information plans.
Information Plans Source Scale
Geomorphometry TOPODATA INPE (2015)
1:50.000
Soils LORANDI; LOLLO
(2016)
Geology SÃO PAULO (2014)
Vegetation/ Anthropogenic
Intervention AUTHORS
Source: The authors.
2.2.1 Crepani Method
The generation of the Natural Vulnerability to Erosion Chart for RCW was performed based on a simple average considering the four information plans presented previously. The Crepani method maintains a similar influence to all information plans for vulnerability analysis (CREPANI et al., 2001).
𝑁𝑉𝐸 = (𝐺+𝑅+𝑆+𝑉𝑔𝐴𝑖)
4
Method Crepani Method AHP
Information Plans
Geology Soils
Geomorphology Vegetation/Anthropogenic Intervention
Transformation of vector format information plans to matrix
Elaboration of standardized matrices for each of the information plans for obtaining
the weights Arithmetic mean of information
plans
Reclassification of information plans
Overlay of information plans (Weighted Sum)
Natural Vulnerability to Erosion Chart
ArcGIS10®
ArcGIS10®
Braz. J. of Develop.,Curitiba, v. 6, n.6, p.36755-36775 jun. 2020. ISSN 2525-8761 Where:
NVE: Natural Vulnerability to Erosion;
G: Vulnerability to the Geology environmental attribute;
R: Vulnerability to the Geomorphology environmental attribute; S: Vulnerability to the Pedology environmental attribute;
VgAi: Vulnerability to the Vegetation/Anthropogenic Interventions environmental attribute.
2.2.2 AHP Method
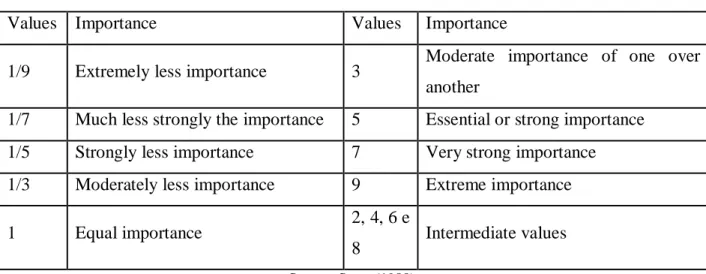
In order to assign weights to the environmental attributes, comparison matrices were elaborated for each information class and a general matrix considering the hierarchy information for the analysis of the natural vulnerability. The adoption of relative importance levels was established by Saaty (1980) as presented in Table 3.
Table 3 - Hierarchical Values Scale. Hierarchical Values Scale
Values Importance Values Importance
1/9 Extremely less importance 3 Moderate importance of one over another
1/7 Much less strongly the importance 5 Essential or strong importance 1/5 Strongly less importance 7 Very strong importance 1/3 Moderately less importance 9 Extreme importance
1 Equal importance 2, 4, 6 e
8 Intermediate values
Source: Saaty (1980).
Subsequently, the autovectors were calculated for each environmental attribute and its respective classes. Then, a consistency analysis of the adopted weights was performed, where the Consistency Ratio (CR) and the Consistency Index (CI), proposed by Saaty (1980) (Table 4), were defined. Table 5 presents consistency values for CR, CI, and max (maximum eigenvalue) calculations.
Braz. J. of Develop.,Curitiba, v. 6, n.6, p.36755-36775 jun. 2020. ISSN 2525-8761
Table 4 - Equations for analysis of the weights assigned.
Equations Equation Variables Description
𝑅𝐶 =𝐼𝐶 𝐼𝑅
RC = Consistency Ratio
IR = Random Consistency Index 𝐼𝐶 = (𝜆𝑚á𝑥 − 𝑛)
÷ (𝑛 − 1)
n = number representing the array order
máx = maximum auto value
λmáx = 𝑇 × 𝑊
T = normalized autovector
W = sum of the columns of the array of compared for each attribute
Source: Saaty (1980).
Table 5- Random consistency index as a function of the matrix order.
(n)* 1 2 3 4 5 6 7 8 9 10 11 12 13 14 (IR)* 0,0 0 0,0 0 0,5 8 0,9 0 1,1 2 1,2 4 1,3 2 1,4 1 1,4 5 1,4 9 1,5 1 1,4 8 1,5 6 1,5 7
Source: Saaty (1980). * n: Array Order; IR: Random Consistency Values.
After the attribution of weights, the information plans were reclassified in a GIS environment (ArcGIS10.5®). Weighted Sum tool was used for final charts generation,
performing the product referring to the importance of each class of information plans (Weight) by the eigenvector of the respective information plane. The weights of each of the classes assigned to the information plans are presented in Table 6.
It should be noted that the Crepani method performs an arithmetic mean in which it adopts the same importance to information plans, while the AHP method defines a level of specific importance among the classes of the information plans, in addition to prioritizing the importance of own information plans.
Braz. J. of Develop.,Curitiba, v. 6, n.6, p.36755-36775 jun. 2020. ISSN 2525-8761
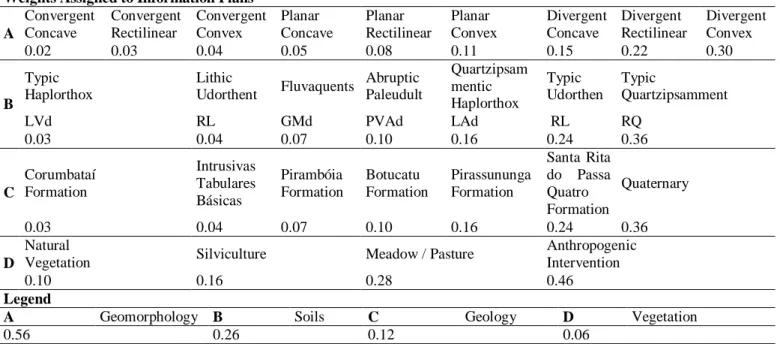
Table 6 - Weights Assigned to Information Plans.
Weights Assigned to Information Plans A Convergent Concave Convergent Rectilinear Convergent Convex Planar Concave Planar Rectilinear Planar Convex Divergent Concave Divergent Rectilinear Divergent Convex 0.02 0.03 0.04 0.05 0.08 0.11 0.15 0.22 0.30 B Typic Haplorthox Lithic Udorthent Fluvaquents Abruptic Paleudult Quartzipsam mentic Haplorthox Typic Udorthen Typic Quartzipsamment LVd RL GMd PVAd LAd RL RQ 0.03 0.04 0.07 0.10 0.16 0.24 0.36 C Corumbataí Formation Intrusivas Tabulares Básicas Pirambóia Formation Botucatu Formation Pirassununga Formation Santa Rita do Passa Quatro Formation Quaternary 0.03 0.04 0.07 0.10 0.16 0.24 0.36 D Natural
Vegetation Silviculture Meadow / Pasture
Anthropogenic Intervention
0.10 0.16 0.28 0.46
Legend
A Geomorphology B Soils C Geology D Vegetation
0.56 0.26 0.12 0.06
Source: The authors.
The attribution of weight to each environmental attribute considered was based on the natural vulnerability of the terrain to the occurrence of erosive processes. The information plane that received the greatest weight is the geomorphology that shows influence on the amplitude of relief, slope, and degree of dissection of landscape unit.
The pedology received the second largest weight, this attribute indicates the gradual scale of the ecodynamics that is the maturity of the soils understood as the product of the balance between morphogenesis and pedogenesis, this allows to identify if there is prevalence of erosive processes of the morphogenesis that originate young and the presence of mature, leached and well-developed soils due to the stability conditions that allow the processes of pedogenesis (CREPANI et al., 2001).
The third environmental attribute that received weight is the geology that corresponds to the information regarding the geological evolution of the environment, as well as the degree of cohesion of the rocks that constitute it, because in rocks with little cohesion predominates morphogenetic processes, while the rocks well-formed processes allow for the formation of soils.
The vegetation was the environmental attribute in which the lowest weight was attributed because the density of the vegetation cover is a protection against the monogenetic processes that manifest in the form of erosion (CREPANI et al., 2001).
Braz. J. of Develop.,Curitiba, v. 6, n.6, p.36755-36775 jun. 2020. ISSN 2525-8761
3 RESULTS AND DISCUSSIONS
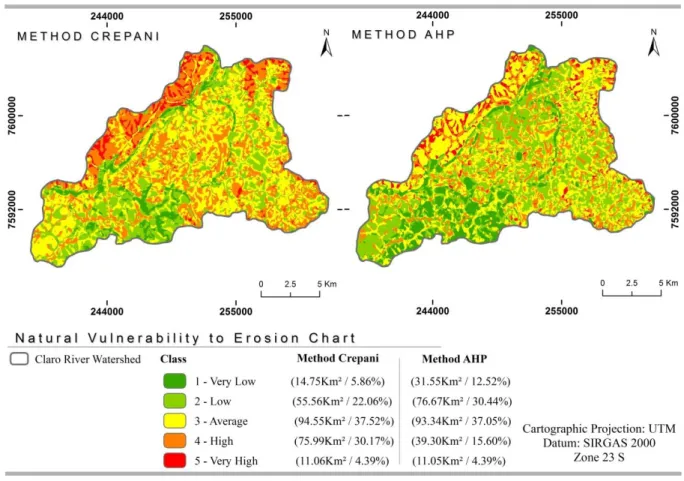
The Natural Vulnerability to Erosion Chart is classified into five classes (Very Low, Low, Average, High, and Very High) (Figure 4). Comparing the charts generated by the two methods (Crepani and AHP), there was a difference in the Very Low and High vulnerability classes (Table 7).
Figure 4 - Natural Vulnerability to Erosion Chart.
Source: The authors.
The most evident class in both charts is the average vulnerability, corresponding 94.55km² of the Crepani Method chart and 93.34km² of AHP Method chart, followed by the low-class corresponding of 55.56km² and 76.67% respectively the Crepani and AHP methods. For the "High" class there was a decrease of 48.28% when compared to the two cards, the "Very high" class suffered the least change (-0.09%), while the "Very low" class increased above 100%.
Braz. J. of Develop.,Curitiba, v. 6, n.6, p.36755-36775 jun. 2020. ISSN 2525-8761
Table 7 - Variation in the percentage of vulnerability classes related to Crepani and AHP methods.
Class Method Crepani Method AHP Variation (%) Area (km²) Area (km²) Very Low 14.75 31.55 113.90 Low 55.56 76.67 37.99 Average 94.55 93.34 -1.28 High 75.99 39.30 -48.28 Very High 11.06 11.05 -0.09
Source: The authors.
For better understanding each class of natural vulnerability to erosion was described separately as presented below:
- Very Low: The concentration of this class occurs in both results, but with different intensity. The AHP chart exceeded twice the percentage of this class area when compared to the Crepani method, in the range of 5.86% to 12.52%. It should be pointed out that lower altitude areas present a more stable geomorphology, characterizing a flat relief, thus, soil erosion loss is slower when compared to rough terrain relief (LOPES; SALDANHA, 2016).
This class is justified because the geomorphology is represented by convergent slopes (concave, rectilinear and convex) and concave planar. The soils of the region are classified as Abruptic Paleudult and Quartzipsammentic Haplorthox presenting texture that varies from medium to clayey and Lithic Udorthent and Typic Haplorthox soils that present clayey texture (35-60% of the clay fraction). The geology in this region is represented by the Corumbataí and Intrusive Basic Tabular Formations. In this area, there is a greater concentration of natural and country vegetation acting as a protection of the soil to the emergence of erosive processes.
- Low: Regarding the AHP method, the low class presented an increase from 55.56 to 76.67km², which corresponds to a variation of 37.99%. The low vulnerability is related to concave convergent slopes distributed throughout the basin. The soil in this region are Typic Quartzipsamment with sandy texture (less than 15% clay) are well spatialized in the basin while in the north and west there is a predominance of Quartzipsammentic Haplorthox soil with a medium texture (15-35% clay).
Braz. J. of Develop.,Curitiba, v. 6, n.6, p.36755-36775 jun. 2020. ISSN 2525-8761 The predominant geological formations in this area are Pirambóia, Botucatu, and Pirassununga. The basin presents an area of 30.78km² preserved by natural vegetation, country, silviculture, corresponding respectively in area 18.45km², 7.33km², 5.00km².
- Average: Comparing the two cards, there was a decrease of 1.28% of this class. The predominance of this class is related to the forms of planar relief (rectilinear and concave) and divergent concave. The pedology is characterized by Typic Quartzipsamment (sandy texture), occupying an area of 75.33km², coming from the Pirambóia and Santa Rita do Passa Quatro geological formations. The natural vegetation is distributed throughout the study area and occupies 27.36km².
- High: this class is distributed throughout the basin, although its greater evidence appears in the northeast and northwest ends of the basin considering the two methods used to generate the chart. When considering the result elaborated by means of the AHP method, it is observed that the percentage of area decreases from 30.17% to 15.60%, presenting a variation of 48.28% for the class.
The occurrence is directly related to the sites that present slopes divergent rectilinear (23.66km2) and divergent concave (11.44km2). The soils of this region are classified Typic Quartzipsamment with a sandy texture, originating from the geological formations Pirambóia and Santa Rita do Passa Quatro.
- Very High: It is the only class that presented the lowest variation (-0.09%) considering the preparation of the letter by the two methods. The "Very High" class is concentrated in the extreme north-east and northwest of the basin. It is associated with regions where the relief forms have divergent rectilinear and convex slopes. The pedology is characterized by Typic Quartzipsamment soils (sandy texture), whose geology is represented by the Santa Rita Formations of Passa Quatro and Pirambóia.
In geology the degree of cohesion of the rocks considers the level of the bond between the minerals and particles that compose them, corresponding to resistance to weathering, besides the capacity of resistance to the disaggregation between the minerals. In this context, the less cohesive rocks correspond to a greater tendency to the vulnerability to erosive processes, transformers of the relief forms and the more cohesive rocks, point the forming processes of soils (LOPES, SALDANHA, 2016).
This class represents places where there are only 1.18km² occupied by natural vegetation. It is important to highlight that the vegetation cover protects the soil, reducing water erosion (CARDOSO et al., 2012), through the interception of raindrops by the
Braz. J. of Develop.,Curitiba, v. 6, n.6, p.36755-36775 jun. 2020. ISSN 2525-8761 vegetation structure (GALETI, 1987), which allows reducing the intensity of the splash effect (GUERRA, 2012). In addition, vegetation allows soil structuring through the dissemination of its roots, which increases the infiltration capacity, as well as the intensity of the runoff and the erosions resulting from it.
4 CONCLUSIONS
The methods employed allowed the generation of results that show the reality of the study area, it is worth mentioning that the Crepani method is more generic because it considers the similarity of the information plans for the vulnerability analysis, whereas the AHP method presents the advantage of hierarchizing both information plans and their classes, highlighting the relative importance of natural vulnerability to erosion.
When applying the AHP method, it is observed that the classification of the highest percentage of the area is in the lower (very low to average) levels of vulnerability, when compared to the Crepani method.
The methodology can be replicated for the other hydrographic basins, emphasizing the AHP model, with greater precision and reality, according to the specificities of each of the independent areas of the place where it is applied.
ACKNOWLEDGES
The authors thank the Foundation for Research Support of the State of São Paulo (FAPESP), for Process no. 2013 / 03699-5, which provided financial resources for the elaboration of laboratory results essential for the accomplishment of this study and report that "this study was carried out with the support of the Coordination of Improvement of Higher Education Personnel - Brazil (CAPES) - Financing Code 001 ".
REFERENCES
AUFFRET, G. A.; RICO, Y.; BULLOCK, J. M.; HOOFTMAN, D. A. P.; PAKEMAN, R. J.; SOONS, M. B.; ESTEBAN, A. S.; TRAVESET, A.; WAGNER, H. H.; COUSINS, S. A. Plant functional connectivity - integrating landscape structure and effective dispersal. Journal of
Braz. J. of Develop.,Curitiba, v. 6, n.6, p.36755-36775 jun. 2020. ISSN 2525-8761 BRASIL. CNRH. Resolução n. 32, de 15 de outubro de 2003. Anexo I. Conselho Nacional
de Recursos Hídricos. Brasília, DF: Ministério do Meio Ambiente, 2003.
CARDOSO, D. P.; SILVA, M. L. N.; CARVALHO, G. J.; FREITAS, D. A. F.; AVANZI, J. C. Plantas de Cobertura no Controle das Perdas de Solo, Água e Nutrientes por Erosão Hídrica.
Revista Brasileira de Engenharia Agrícola e Ambiental, Campina Grande, v. 16, p.
632-638, 2012.
CEPAGRI - Centro de Pesquisas Meteorológicas e Climáticas Aplicadas a Agricultura, da UNICAMP. Disponível em <http://www.cpa.unicamp.br/outras-informacoes/clima_muni_531.html>. Acesso em 26 de maio de 2017.
CHAICHI, N.; DAIM, T. U. Landscape Analysis: Connected Lighting System.
Infrastructure and Technology Management, p.45-65, 2018.
CHICAS, S. D.; OMINE, K.; FORD, J. B. Identifying erosion hotspots and assessing communities’ perspectives on the drivers, underlying causes and impacts of soil erosion in Toledo’s Rio Grande Watershed: Belize. Applied Geography, v. 68, p. 57-67, 2016.
CPRM. Serviço Geológico do Brasil. Sistema de Informações de Águas Subterrâneas
(SIAGAS). Disponível em: <http://siagasweb.cprm.gov.br/layout/pesquisa_complexa.php>.
Acesso em: 22 mai. 2017.
CREPANI, E.; MEDEIROS, J. S.; HERNANDEZ, P.F.; FLORENZANO, T. G.; DUARTE, V.; BARBOSA, C. C. F. Sensoriamento remote e geoprocessamento aplicados ao zoneamento ecológico-econômico e ao ordenamento territorial. 1. Ed. São José dos Campos/SP: INPE, 2001. 124p.
DEPARTAMENTO DE ÁGUAS E ENERGIA ELÉTRICA (DAEE); INSTITUTO GEOLÓGICO (IG); INSTITUTO DE PESQUISAS TECNOLÓGICAS DO ESTADO DE SÃO PAULO (IPT); SERVIÇO GEOLÓGICO DO BRASIL (CPRM). 2005. Mapa de águas
subterrâneas do Estado de São Paulo - Escala 1:1.000.000. Governo do Estado de São
Braz. J. of Develop.,Curitiba, v. 6, n.6, p.36755-36775 jun. 2020. ISSN 2525-8761 FAN, C.; MYINT, S. A comparison of spatial autocorrelation indices and landscape metrics in measuring urban landscape fragmentation. Landscape and Urban Planning, v.121, p.117-128, 2014.
GALETI, P. A. Práticas de Conservação à Erosão. Campinas: Instituto Campineiro de Ensino Agrícola, 1987. 278 p.
GUERRA, A. J. T. O Início do Processo Erosivo. In: GUERRA, A. J. T.; SILVA, A. S. da; BOTELHO, R. G. M. (Org.). Erosão e Conservação dos Solos: Conceitos, temas e aplicações. 7. ed. Rio de Janeiro: Bertrand Brasil, 2012. Cap. 1. p. 17-50.
HUMAGAIN, K.; PONTILHO-QUINTEIRO, C.; COX, R. D.; CAIN, J. W. Estimating forest canopy cover dynamics in Valles Caldera National Preserve, New Mexico, using LiDAR and Landsat data. Applied Geography, p.120-132, 2018.
INSTITUTO BRASILEIRO DE GEOGRAFIA E ESTATÍSTICA - IBGE. Brazilian Institute of Geography and Statistics. Topografic Charts - Rio Claro - IV-2, SF-23-V-C-V-1, SF-23-V-C-IV-4 and SF-23-V-C-V-3, 1971.
INSTITUTO NACIONAL DE PESQUISAS ESPACIAIS - INPE. TOPODATA, banco de
dados geomorfométricos do Brasil. Disponível em:
<http://www.dsr.inpe.br/topodata/index.php>. Acesso em: 03 de julho de 2017.
LOPES, M. S.; SALDANHA, D. L. Análise de Vulnerabilidade Natural à Erosão como subsídio ao planejamento ambiental do oeste da Bacia Hidrográfica do Camaquã-RS. Revista
Brasileira de Cartografia, v.68, n.9, p. 1689-1708, 2016.
LORANDI, R.; LOLLO, J.A. Carta de Unidades Aquíferas Aplicada ao Zoneamento GeoAmbiental, 2016.
MALCOLM, J. R.; LEHMAN, S. M. Edge effects in tropical dry forests of Madagascar: additivity or synergy? Landscape Ecology. v.32, n.2, p.327-341, 2017.
Braz. J. of Develop.,Curitiba, v. 6, n.6, p.36755-36775 jun. 2020. ISSN 2525-8761 MARQUEZOLA, D. S.; SERIKAWA, V. S.; LOLLO, J. A.; LORANDI, R. Emprego das unidades de relevo no planejamento territorial da bacia do Rio Claro (SP), na escala 1:50.000. In: SIMPÓSIO DE GEOTECNOLOGIAS NO PANTANAL, n° 6. 22 a 26 out. 2016, Cuiabá-MT. Anais. Cuiabá: Embrapa Informática Agropecuária/INPE, 2016. p. 255 -264.
MAVROMATIDI, A.; BRICHE, E.; CLAEYS. Mapping and analyzing socio-environmental vulnerability to coastal hazards induced by climate change: An application to coastal Mediterranean cities in France. Cities. V. 72, P. 189-200. 2017.
O'REILLY, K. The influence of land use changes on open defecation in rural India. Applied
Geography. V. 99, p.133-139, 2018.
SAATY, T L. The Analytic Hierarchy Process. New York: Mcgraw-hil, 1980.
SÃO PAULO. Unidades Básicas de Compartimentação do Meio Físico (UBC) do Estado de São Paulo. INSTITUTO GEOLÓGICO/COORDENADORIA DE PLANEJAMENTO AMBIENTAL, SECRETARIA DO MEIO AMBIENTE DO ESTADO DE SÃO PAULO, 2014.
STRAHLER, A. N. Hypsometric (area-altitude) - analysis of erosion al topography.
Geological Society of America Bulletin, v.63, n.10, p.1117-1142, 1952.
TIESKENS, K. F.; SCHULP, C. J. E; LEVERS, C.; LIESKOVSKY, J.; KUEMMERLE, T.; PILENINGER, T.; VERBURG, P. H. Characterizing European cultural landscapes: Accounting for structure, management intensity and value of agricultural and forest landscapes. Land Use Policy, v.62, p.29-39, 2017.
TOPPING, C. J.; DALBY, L.; SKOV, F. Landscape structure and management alter the outcome of a pesticide ERA: Evaluating impacts of endocrine disruption using the ALMaSS European Brown Hare model. Science of The Total Environment, v.541, n.15, p.1477-1488, 2016.
Braz. J. of Develop.,Curitiba, v. 6, n.6, p.36755-36775 jun. 2020. ISSN 2525-8761 TROMBETA, L.R.; GARCIA, R.M.; NUNES, R.S.; GOUVEIA, I.C.M.C.; LEAL, A.C. Análise da fragilidade potencial e emergente do relevo da unidade de gerenciamento de recursos hídricos pontal do Paranapanema, São Paulo, Brasil. Caderno de prudentino de
geografia, nº36, Volume especial, p.159-173, 2014.
TURNER, M.; SIMARD, M. Using Spatial Statistics and Landscape Metrics to Compare Disturbance Mosaics, p.175-190. In: GERGEL, S. E.; TURNER, M. G. Learning Landscape
Ecology: A Practical Guide to Concepts and Techniques, 1srt ed, 2017, 300p.
USGS. United States Geological Survey. LandSat 8 - sensor OLI/TIRS, bands 6,5,4. Orbit/point 220/75 - 23 de february de 2017.
VAN ZANTEN, B. T.; VAN BERKEL, D. B.; MEENTEMEYER, R. K.; SMITH, J. W.; TIESKENS, K. F.; VERBURG, P. H. Continental scale quantification of landscape values using social media data. Proceedings of the National Academy of Sciences in the United
States of America, v.113.46, p.12974-12979, 2016.
YANG, Y. et al. Integrating multi-source data to improve water erosion mapping in Tibet, China. Catena, v. 169, n. May, p. 31-45, 2018.
ZELLWEGER, F.; MORSDORF, F.; PURVES, R. S.; BRAUNISCH, V.; BOLLMANN, K. Improved methods for measuring forest landscape structure: LiDAR complements field-based habitat assessment. Biodiversity and Conservation, v.23, n.2, p.289-307, 2014.