Bachelor of Science in Biomedical Engineering
Personality assessment based on biosignals
during a decision-making task
Dissertation submitted in partial fulfillment of the requirements for the degree of
Master of Science in Biomedical Engineering
Adviser: Prof. Doctor Hugo Gamboa, Auxiliar Professor, NOVA University of Lisbon
Copyright © Beatriz Gonçalves Crisóstomo Esteves, Faculdade de Ciências e Tecnologia, Universidade NOVA de Lisboa.
A Faculty of Sciences and Technology e a NOVA University of Lisbon têm o direito, per-pétuo e sem limites geográficos, de arquivar e publicar esta dissertação através de exem-plares impressos reproduzidos em papel ou de forma digital, ou por qualquer outro meio conhecido ou que venha a ser inventado, e de a divulgar através de repositórios científicos e de admitir a sua cópia e distribuição com objetivos educacionais ou de investigação, não comerciais, desde que seja dado crédito ao autor e editor.
Primeiro gostaria de agradecer ao Professor Hugo Gamboa, pela oportunidade que me deu em poder participar num projecto tão desafiante e que se revelou ao longo destes meses cada vez mais interessante. Os seus constantes conselhos e desafios foram muito importantes para o desenvolvimento do meu trabalho. Também tenho de agradecer ao Professor Marcus Cheetham, pela motivação e disponibilidade para discutir temas de psicologia e os resultados que fomos obtendo ao longo desta tese. Gostaria também de agradecer ao Departamento de Psicologia da Universidade de Zurique pela disponibiliza-ção dos dados. Não posso deixar de agradecer à Cátia Cepeda por todos os conselhos que me deu ao longo da realização da tese e por estar sempre disponível para esclarecer as minhas dúvidas e para discutir novos resultados.
Estou também agradecida à minha família por terem investido em mim e por me terem dado a oportunidade de estudar este curso. Agradeço aos meus pais, irmão e avós por acreditarem em mim e pela força que me deram em todas as etapas. À minha madrinha por estar sempre presente na minha vida, me ter dado a oportunidade de fazer parte da vida dos meus dois meninos, Guilherme e Afonso, e muito, muito mais. Obrigada por todo o apoio.
Por fim, agradeço a todas as amizades que passaram na minha vida nestes últimos 6 anos e que tornaram todo o estudo muito mais fácil com os momentos de diversão. À minha equipa que me proporcionou momentos de descontração e de orgulho que nunca esquecerei. À minhapersonal assistentCarina Figueiredo por estar sempre lá para mim e
Due to the emergence of novel acquisition devices and signal processing techniques, the study of electrophysiology and its applications has assumed an important role on the Biomedical Engineering community. Recently, research on this area has expanded to several domains, with the psychophysiology being a proeminent one, more specifically in the field of personality psychology.
In this thesis, participants were asked to perform a wildly known decision-making task, the Iowa Gambling Task (IGT), and their biosignals were recorded during this perfor-mance with the objective of determining whether changes in biosignals could be related to personality. This project was composed by 71 participants and their biosignals were used to extract meaningful features that together could create a predictive model of per-sonality. For this, all biosignals were processed prior to the feature extraction step and the features were extracted from the entire signals, recorded during the performance of the IGT, and also dividing the task in five blocks. After the extraction, a machine learning algorithm was used to compute the best predictive models for the Five Factor Model (FFM) personality dimensions and for the Maximization and Regret scales, using each biosignal individually and in the end all features from all biosignals.
The results showed that the predictive models which use features from all biosignals perform better than the models which use only one biosignal. The Openness to Expe-rience, Agreeableness and Maximization scales are well predicted with features from Electrocardiogram (ECG), the Agreeableness, Maximization and Extraversion scales with Electrodermal Activity (EDA) features and the Extraversion and Openness to Experience scales with features from Blood Volume Pulse (BVP). The hypothesis that personality traits is more expressed in the start of IGT was confirmed since the highest number of features is extracted from the Block 1 of the IGT. The results should be further validated for other populations.
Keywords: Biosignals, Signal Processing, Feature Selection, Machine Learning, Iowa
Devido ao aparecimento de novos dispositivos de aquisição e técnicas de processa-mento de sinais, o estudo da eletrofisiologia e das suas aplicações assumiu um papel importante na comunidade de Engenharia Biomédica. Recentemente, a pesquisa nesta área expandiu-se para várias áreas, sendo uma das mais proeminentes a psicofisiologia, mais especificamente na área da psicologia da personalidade.
Nesta tese, os participantes foram convidados a realizar uma tarefa de tomada de decisão extremamente conhecida, o IGT, e os seus biosinais foram registados durante esta performance com o objetivo de determinar se mudanças nas características dos biosinais poderiam estar relacionadas com a personalidade. Este projeto teve a participação de 71 participantes e os seus biosinais foram utilizados para extrair características significativas que em conjunto poderiam criar um modelo preditivo de personalidade. Para isso, todos os biosinais foram processados antes de se proceder à extração de parâmetros dos sinais e os parâmetros foram extraídos dos sinais completos, registados durante a performance do IGT, assim como da divisão do jogo em cinco blocos. Após a extração, um algoritmo de aprendizagem automática foi utilizado para determinar os melhores modelos predi-tivos para as dimensões da personalidade do modelo dos cinco fatores e para as escalas de Maximização e Arrependimento, usando cada biosinal individualmente e por fim a combinação de todos os parâmetros de todos os biosinais.
Os resultados mostraram que os modelos preditivos que utilizam características de todos os biosinais são melhores do que os modelos que utilizam apenas um biosinal. As escalasAbertura à Experiência,AmabilidadeeMaximizaçãosão bem previstas através de
pa-râmetros do eletrocardiograma (ECG), as escalasAmabilidade,MaximizaçãoeExtroversão
através do atividade eletrodérmica (EDA) e as escalasExtroversãoeAbertura à Experiência
através do volume de pulso sanguíneo (BVP). A hipótese de que a personalidade é mais expressa no início do IGT foi confirmada uma vez que o maior número de parâmetros dos sinais é extraído do primeiro bloco do IGT. Estes resultados devem ser validados para outras populações.
Palavras-chave: Biosinais, Processamento de Sinais, Seleção de parâmetros,
List of Figures xiii
List of Tables xvii
Acronyms xix
1 Introduction 1
1.1 Context . . . 1
1.2 Theoretical Concepts . . . 3
1.2.1 Nervous System . . . 3
1.2.2 Biosignals . . . 5
1.2.3 Human-Computer Interaction . . . 11
1.2.4 Personality . . . 12
1.2.5 Decision Making . . . 14
1.3 Objectives . . . 16
1.4 Thesis Overview . . . 18
2 State of the Art 19 2.1 Biosignal Monitoring . . . 19
2.2 Personality Assessment . . . 19
2.3 Assessment of Decision Making Behaviour . . . 20
3 Methods 23 3.1 Technological Materials . . . 23
3.2 Biosignals Processing . . . 25
3.2.1 Electrocardiogram . . . 25
3.2.2 Electrodermal Activity . . . 27
3.2.3 Blood Volume Pulse . . . 30
3.2.4 Pupillometry . . . 32
3.3 Features Calculation . . . 34
3.3.1 ECG Features . . . 34
3.3.2 EDA Features . . . 38
3.3.4 Pupillometry Features . . . 44
3.4 Features Selection and Classification . . . 45
3.5 Personality Questionnaires . . . 47
4 Experiment 49 4.1 Experiment Description . . . 49
4.2 Participants . . . 51
4.3 Data Acquisition . . . 51
5 Results and Discussion 53 5.1 Description of the Population . . . 53
5.2 Biosignals Processing and Feature Extraction . . . 56
5.2.1 ECG . . . 56
5.2.2 EDA . . . 58
5.2.3 BVP . . . 60
5.2.4 Pupillometry . . . 61
5.3 Analysis of Predictive Models . . . 62
5.3.1 ECG Model . . . 64
5.3.2 EDA Model . . . 68
5.3.3 BVP Model . . . 72
5.3.4 Pupillometry Model . . . 76
5.3.5 Biosignals Model . . . 80
5.3.6 General Discussion . . . 84
6 Conclusions 87 6.1 General Results . . . 87
6.2 Future Work . . . 88
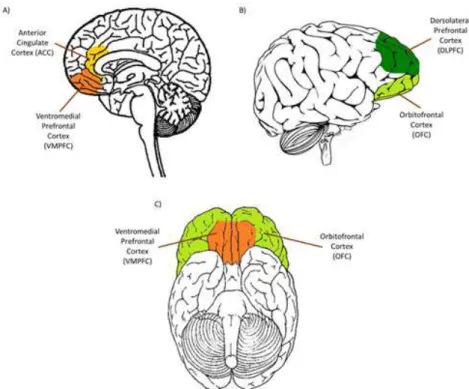
1.1 Brain regions involved in decision making. Yellow represents the ACC, orange the VMPFC, green the OFC and dark green the DLPFC. Different views of the
brain are represented: A) Sagittal slice; B) Side view; C) Bottom view. . . 4
1.2 ECG signal with one cardiac cycle showing the P, Q, R, S, T and U waves and the segments between waves, from [34]. . . 6
1.3 HRV signal, adapted from [12]. . . 7
1.4 (a) Example of an EDA signal, extracted from [38]; (b) Morphology of a SCR, extracted from [13]. . . 8
1.5 Example of a BVP waveform, adapted from [42]. . . 9
1.6 Pupil diameter variation, in arbitrary units, during the presentation of am-biguous visual stimulus, adapted from [46]. . . 10
1.7 Steps of the decision making process. . . 14
1.8 Schematic representation of the developed work. . . 17
3.1 Processing tools for ECG and final outputs. . . 26
3.2 SCR morphology and respective first and second derivatives, from [38]. . . . 27
3.3 Processing tools for EDA and final outputs. . . 29
3.4 Processing tools for BVP and final outputs. . . 31
3.5 Processing tools for the pupillometry data and final outputs. . . 33
3.6 Examples adapted from [19]: (a) HRV histogram with the triangular inter-polation marked with black dashed lines to compute the TINN; (b) Poincaré plot. . . 35
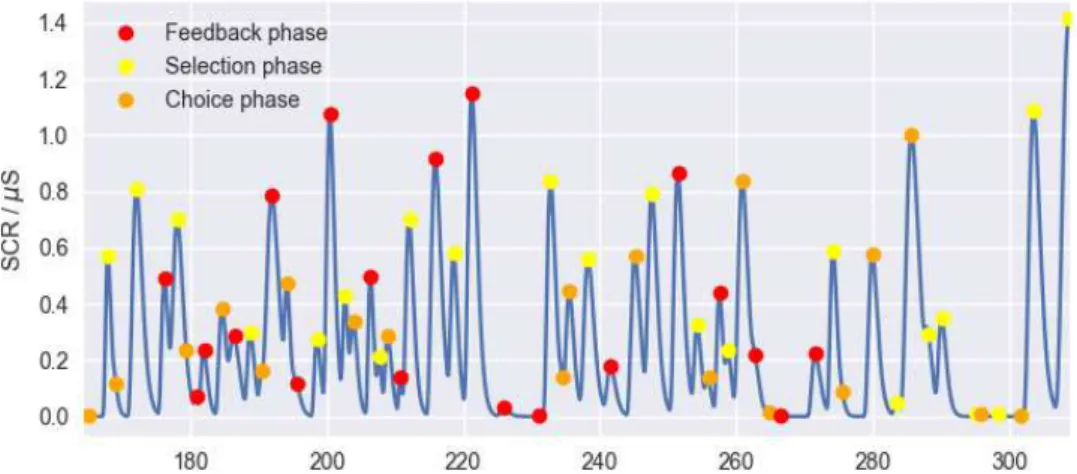
3.7 SCR component of the EDA signal. The detected peaks are marked according to the IGT phase in which they are detected. . . 39
3.8 The first plot of each subfigure has marked in red the moments where the subject loses money and in green the moments where he wins. The second and third plots are the loss wave and the EDA based function ’Average of the SCR component’ for the 1st block. In (a) are presented the results for thelosswidth wave and in (b) for thelossheight wave. . . 42
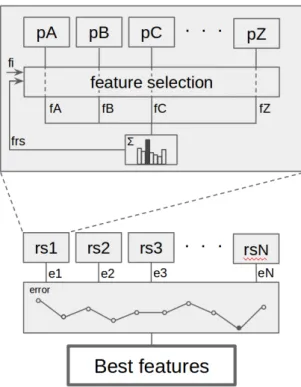
3.9 Steps involved in feature selection and classification to define the predictive model of personality and decision making behavior. . . 46
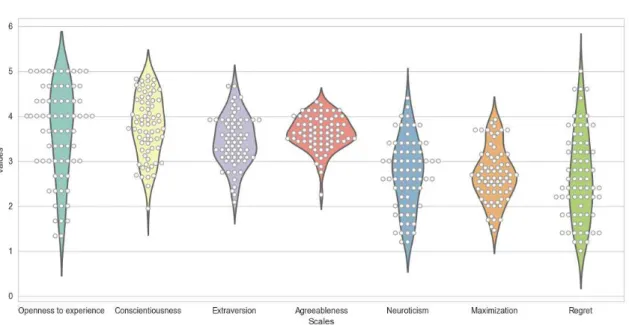
5.1 Violin plot with the results of the personality questionnaires. The white dots represent the precise result of each person. . . 54 5.2 In the first plot is presented the ECG signal from a subject of the study. The
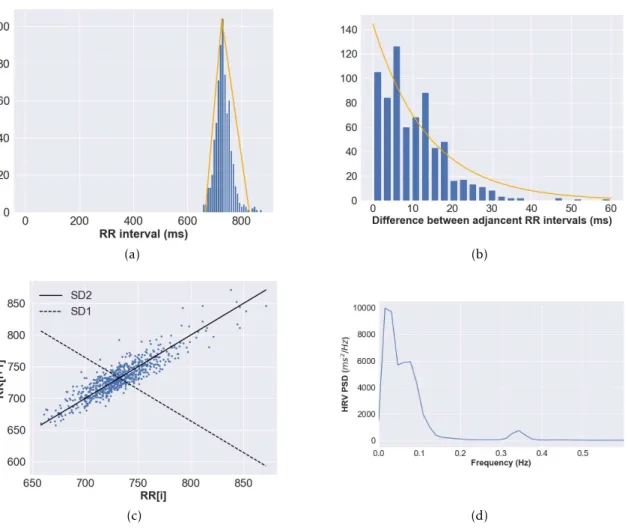
detected QRS complexes are marked with a black dot in the ECG plot. The HRV, for the same time interval, is presented in the second plot. . . 56 5.3 All data presented in this plots belongs to a subject of this study. (a) HRV
histogram with its triangular interpolation marked with the orange lines; (b) Histogram of the sucessive differences of HRV with the exponential curve
marked with a orange line; (c) Poincaré plot with SD1 marked with a black dashed line and SD2 marked with a black line; (d) PSD estimation plotted in function of the frequencies. . . 57 5.4 EDA signal and respetive components: the SCR are presented in the second
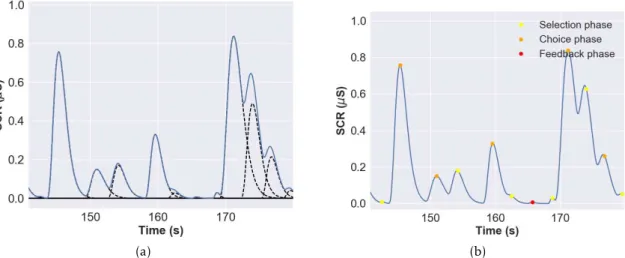
plot and the SCL in the third plot. . . 58 5.5 Segment of the SCR component of the EDA signal of a subject from the study:
(a) in blue is the sum of the detected SCR and in black dashed lines are marked each individual event detected by the model; (b) through SCR component and the synchronization with the IGT, it is possible to identify in which phase each peak occured. . . 58 5.6 BVP signal from a subject of the study: the SSF signal with the peaks onset and
maximum marked with green and orange dots is in the top plot. In the bottom plot, the filtered BVP signal is shown with its peaks onset and maximum, computed through the SSF signal, marked with green and red dots. . . 60 5.7 Pupil diameter during the first trial of IGT, measured in mm, of a subject of
the study: in the first plot, the pupil diameter during the selection phase is presented, in the second is the diameter during the choice phase and the last plot has the pupil diameter during feedback. . . 61 5.8 Barplot with the number of features extracted from each signal and the total
of features from the four used biosignals, in blue bars, and the number of features after the feature selection with the Pearson correlation, in orange bars. 62 5.9 Predictive model result for the Conscientiousness scale, obtained with features
from ECG. . . 64 5.10 Predictive model results for Agreeableness (A), Extraversion (E), Maximization
(Max), Neuroticism (N), Openness to Experience (O) and Regret (R), obtained with features from ECG. . . 64 5.11 Predictive model result for the Conscientiousness scale, obtained with features
from EDA. . . 68 5.12 Predictive model results for Agreeableness (A), Extraversion (E), Maximization
(Max), Neuroticism (N), Openness to Experience (O) and Regret (R), obtained with features from EDA. . . 68 5.13 Predictive model result for the Conscientiousness scale, obtained with features
5.14 Predictive model results for Agreeableness (A), Extraversion (E), Maximization (Max), Neuroticism (N), Openness to Experience (O) and Regret (R), obtained with features from BVP. . . 72 5.15 Predictive model result for the Conscientiousness scale, obtained with features
from the pupillometry data. . . 76 5.16 Predictive model results for Agreeableness (A), Extraversion (E), Maximization
(Max), Neuroticism (N), Openness to Experience (O) and Regret (R), obtained with features from the pupillometry data. . . 76 5.17 Predictive model result for the Conscientiousness scale, obtained with features
from all biosignals used in this thesis. . . 80 5.18 Predictive model results for Agreeableness (A), Extraversion (E), Maximization
1.1 ECG features, corresponding cardiac cycle’s phase and duration time [37, 62]. 6 1.2 EDA features and respective definitions and typical ranges [37]. . . 8 1.3 Basic dimensions according to the FFM by Costa and McCrae, their meanings,
facets and a list of adjectives attributed to people with high or low scores in them. . . 13
3.1 Statistical and geometrical features extracted from ECG signal. From the fea-tures marked with *, statistical parameters are computed. All other feafea-tures are computed from HRV. . . 36 3.2 Frequency domain and non linear features extracted from ECG signal. All
features are computed from HRV. . . 37 3.3 Features extracted from EDA signal. From the features marked with *,
statis-tical parameters are computed. . . 38 3.4 Features extracted from BVP signal. From the features marked with *,
statisti-cal parameters are computed. . . 43 3.5 Features extracted from pupillometry signal. From the features marked with *,
mean and standard deviation parameters are computed. Each of these features are computed for the selection, choice and feedback phases of the IGT. . . 44
5.1 Physiological data used in the study. Subjects whom no physiological signals were used were omitted. The data marked with a X is available. . . 55 5.2 Results of the performance of the predictive model with ECG features: for
each scale is presented the number of features used by the classifier, the best five features of each model, the model error and the mean error of the absolute differences between the predicted and the observed values. . . 65
5.3 Number of features per block used by the classifier to predict each scale, with features extracted from ECG. . . 67 5.4 Results of the performance of the predictive model with EDA features: for
each scale is presented the number of features used by the classifier, the best five features of each model, the model error and the mean error of the absolute differences between the predicted and the observed values. . . 70
5.6 Results of the performance of the predictive model with BVP features: for each scale is presented the number of features used by the classifier, the best five features of each model, the model error and the mean error of the absolute differences between the predicted and the observed values. . . 74
5.7 Number of features per block used by the classifier to predict each scale, with features extracted from BVP. . . 75 5.8 Results of the performance of the predictive model with pupillometry features:
for each scale is presented the number of features used by the classifier, the best five features of each model, the model error and the mean error of the absolute differences between the predicted and the observed values. . . . 78
5.9 Number of features per block used by the classifier to predict each scale, with features extracted from pupillometry. . . 79 5.10 Results of the performance of the predictive model with all biosignals: for
each scale is presented the number of features used by the classifier, the best five features of each model, the model error and the mean error of the absolute differences between the predicted and the observed values. . . . 82
5.11 Number of features per block used by the classifier to predict each scale, with features from all biosignals. . . 83 5.12 Number of features per biosignal used by the classifier to predict each
ACC Anterior Cingulate Cortex.
ADC Analog-to-Digital Converter.
ANS Autonomic Nervous System.
ApEn Approximate Entropy.
AUC Area Under the Curve.
BAV BVP peak-to-peak Amplitude Variation.
bpm beats per minute.
BVP Blood Volume Pulse.
CD Correlation dimension.
CNS Central Nervous System.
DFA Detrended Fluctuation Analysis.
DLPFC Dorsolateral Prefrontal Cortex.
ECG Electrocardiogram.
EDA Electrodermal Activity.
ER-SCR Event Related Skin Conductance Responses.
ETG Eye Tracking Glasses.
FD Fractal Dimension.
FFM Five Factor Model.
fs sampling frequency.
HCI Human–Computer Interaction.
HF Power in High Frequencies.
HR Heart Rate.
HRV Heart Rate Variability.
Hurst Hurst Exponent.
IBI Interbeat Interval.
IGT Iowa Gambling Task.
LF Power in Low Frequencies.
LF/HF Ratio between Low and High Frequencies.
LLE Largest Lyapunov Exponent.
M Mean.
MEG Magnetoencephalogram.
NEO-FFI NEO Five-Factor Inventory.
NEO-PI-R Revised NEO Personality Inventory.
NN50 Number of pairs of successive NN intervals that differ by more than 50
ms.
NS-SCR Non-Specific Skin Conductance Responses.
OFC Orbitofrontal Cortex.
OLS Ordinary Least Squares.
PG pathological gamblers.
pNN50 Percentage of NN differences greater than 50 ms.
PNS Peripheral Nervous System.
PPG Photoplethysmographic.
PS physiological signals.
PSD Power Spectrum Density.
PSNS Parasympathetic Nervous System.
RED Remote Eye tracking Devices.
RMSD Root Mean Squared Deviation.
RMSSD Root Mean Square of Successive period Differences.
SampEn Sample Entropy.
SCR Skin Conductance Responses.
SD Standard Deviation.
SD1 Standard Deviation of instantaneous beat-to-beat variability.
SD1/SD2 Ratio of short interval variation to long interval variation.
SD2 Long-term Standard Deviation of continuous NN intervals.
SDNN Standard Deviation of the NN interval (beat to beat interval).
SMI SensoMotoric Instruments.
SNS Sympathetic Nervous System.
SoNS Somatic Nervous System.
SSF Slope Sum Function.
TINN Triangular Interpolation of the NN intervals.
C
h
a
p
t
e
1
I n t r o d u c t i o n
1.1 Context
Whether in the field of biomechanics, tissue engineering or biosignal processing, biomed-ical engineering research has brought powerful and important tools that connect technol-ogy with bioltechnol-ogy and medicine.
The emergence of new signal processing techniques and more sophisticated acquisi-tion devices and sensors has improved knowledge about electrophysiological signals and their applications, for example in the diagnosis of diseases or in the improvement of ath-letes’ performance. Recently the field of psychophysiology has been extensively explored and biomedical engineering can offer an important support in this area, especially in the
study of the physiological changes.
With the development of this thesis, the acquirement of biosignals, such as ECG, BVP, pupillometry and EDA, during the performance of a gambling task that simulates real life decision making, will be correlated with the FFM personality traits and the Maximization and Regret scales to test a possible correlation between the latter and features extracted from the biosignals. For this study, the IGT will be used to simulate real-life decision making. This task is a card game that simulates decision making in a environment where the player receives feedback after each round and in the long run they should conclude that the card decks associated with a high gain are associated with a high loss and the card decks with low gain are associated with a low loss, so the latter are more advantageous.
problem or the selection of the best alternative to solve it.
This could also be an improvement in the field of psychology since if we could corre-late features extracted from biosignals with personality traits, we could start to classify a subject as a neurotic person based on their biosignals instead of using the standard personality questionnaires. This classification based on the biosignals can avoid the cases where the subjects are not truthful when answering the questions.
In this way, this work can help individuals to understand the impact of their person-ality on their decision making performance. For example, this can have a big impact on manage doctors and human resources since hospitals generally prefer individuals who are quick and efficient to decide on the diagnosis and treatment of patients.
The main goal of this thesis is to find a relation between specific personality traits and the behaviour expressed during the performance of the IGT. These patterns of decision making behaviour will be collected, along with physiological signals, and will be classified by a machine learning algorithm. To do this, after being acquired, the biosignals will be processed with the goal of extracting significant features that can be used to construct a prediction model that with the extracted features can predict personality and decision making behavior results given by well known and validated questionnaires.
1.2 Theoretical Concepts
In this section some theoretical concepts, essential for the understanding of this work, are introduced. Firstly it is given an introduction to the nervous system and also to the biosignals that will be measured while the participant is performing the IGT and then are processed to extract different features. Then an explanation about human-computer
interaction and its importance in today’s world is given. Next there is a definition of personality and the FFM theory is explored. And, finally, it is introduced one of the key concepts of this work, the decision making behaviour explained by the theory of maximizers and satisficers.
1.2.1 Nervous System
The way we act, behave and even the way our body works depends on two complex and organized regulatory systems, the nervous system and the endocrine system. The nervous system is composed by a network of neurons that works sending electrical signals that control the responses of our body. This system comprises the Central Nervous System (CNS), that is made up by the brain and the spinal cord, and the Peripheral Nervous System (PNS), that is made up by nerves that communicate with the other parts of the body. The PNS is then splitted in the afferent and efferent divisions. The efferent nervous
system is further divided into the Somatic Nervous System (SoNS) and the Autonomic Nervous System (ANS). The first is responsible to innervate the skeletal muscles that con-trol body movements. The ANS concon-trols, largely in an unconscious way, bodily functions such as body temperature, blood pressure, heart rate variability, sweat glands activity, respiratory rate or pupillary response. Thus, the ANS innervates smooth muscle, cardiac muscle and glands to maintain the homeostasis and to respond rapidly to external stimuli. This predisposition to react is modulated by both branches of the ANS, the Sympathetic Nervous System (SNS) and the Parasympathetic Nervous System (PSNS). All these diff
er-ent systems have distinct functions, but all are interrelated and contribute to the proper functioning of the body [28, 37].
The biosignals studied in this work are from organs that are innervated by the ANS. Both ANS branches function in such a way as to exert opposing effects on the organs. The
SNS is predominant in situations of arousal or stress where it increases the activity of the organs and the PSNS dominates in situations where the body is relaxing or needs to conserve resources. For example, sympathetic activity is responsible for the increase of Heart Rate (HR) and for the pupil dilation, while parasympathetic activity acts decreasing HR and contracting the pupil [21, 28, 29, 37].
Several studies have been conducted in order to identify the brain regions associated with decision making.
encodes the evaluation of the response according to the state of the environment. The Ven-tromedial Prefrontal Cortex (VMPFC) is activated during decisions made in an uncertain situation [35, 71]. The Orbitofrontal Cortex (OFC) is linked to adaptive capacity when a previously correct decision ceases to be [41]. The Anterior Cingulate Cortex (ACC) en-ables the individual to adapt its decisions according to the outcome of its previous action, for example after making a mistake [40, 71]. Theparietal cortexis thought to be involved in the evaluation of gain or loss magnitude, for example when decisions are made under risk situations [71].
Other regions, such as theamygdala, are also involved in decision making, so that a complex neural network is involved in the decision-making process. Through the re-search already done it is possible to conclude that different regions are implicated in
different decision making behaviours, although the regions and their function are highly
interrelated [71].
The regions in the frontal and the anterior cingulate cortex, involved in the decision making process, are represented in Figure 1.1.
Figure 1.1: Brain regions involved in decision making. Yellow represents the ACC, orange the VMPFC, green the OFC and dark green the DLPFC. Different views of the brain are
1.2.2 Biosignals
Every biological event, such as a beating heart, gives rise to physiological changes that can be measured, analysed and processed - the called biosignals. The record of these biosignals can be used to comprehend and explain a variety of physiological mechanisms. Through the diversity of these mechanisms, it is possible to conclude that the number of existing biosignals will be very high [68].
Biosignals can be classified based on their physiological origin [16], so there are:
• Bioelectric signals - measure of the electric field that is propagated by the cells, for example the ECG;
• Biomagnetic signals - measure of the magnetic fields, for example the Magnetoen-cephalogram (MEG) is used to obtain additional information about brain cells that the Electroencephalogram (EEG) can not give;
• Biochemical signals - give information about the levels of chemical substances in the body, for example the partial pressure ofO2in our blood;
• Biomechanical signals - measure of mechanical functions such as motion, force or pressure, for example the mechanorespirogram detects changes in the diameter of the chest and gives information about respiration;
• Bioacoustic signals - measure of biological events that produce sounds, for example listening to the heart can help to diagnose heart valve’s malfunctions;
• Other signals.
In this work, we will measure and process ECG, EDA, BVP and pupillometry.
1.2.2.1 Electrocardiogram
The ECG measures the electric activity of the heart. This activity is coordinated by a group of specialized heart cells that generate and conduct an electrical signal that maintains the heart beating in the right way. Thus, the ECG allows the evaluation of depolarization and repolarization of these cells that coordinate the mechanical pumping of the blood. This mechanical pumping is made of two important phases: the diastole, where the heart rests and its chambers fill with blood, and the systole, where the heart pumps the blood. These series of events between each pump are called cardiac cycle and can be distinguished in the ECG [5]. The ECG measurement is made using three electrodes usually laced on the chest, one serving as ground and the other two recording the electric activity of the cardiac muscle.
Figure 1.2: ECG signal with one cardiac cycle showing the P, Q, R, S, T and U waves and the segments between waves, from [34].
Table 1.1: ECG features, corresponding cardiac cycle’s phase and duration time [37, 62].
ECG feature Cardiac cycle’s phase Duration time / ms
P wave Depolarization of the atrial chambers < 110
PR interval Atrial systole 120-200
QRS complex Depolarization of the ventricular chambers < 120 T wave Repolarization of the ventricular chambers 100 QT interval Ventricular systole and beginning of diastole 250–500
which depend of the propagation direction of the signal. In Table 1.1 is presented the meaning of the most important features of the ECG signal and its duration time.
Thus, the importance of the ECG lies in the fact that anomalies can be detected, such as the absence of the P wave or a QRS complex that is wider than normal, which allow the diagnosis of various pathologies [37]. Factors such as the decision-making process or the personality can also have an impact on HR. Crone and colleagues measured HR (and EDA) from subjects playing the IGT. Good performers HR decreased prior to a dis-advantageous choice in relation to an dis-advantageous choice. All participants experienced HR decreasing after a loss [26]. There are also studies that connect Heart Rate Variability (HRV) parameters with FFM personality traits [84].
The HRV reflects the change in cardiac activity since the HR changes quickly respond-ing to the situation in which the person is. For example in a stressful situation, the SNS is stimulated causing an increase of the number of heartbeats. The PSNS, for example, in a trauma situation decreases the HR [12, 29]. In Figure 1.3 is shown an example of the HRV signal.
Figure 1.3: HRV signal, adapted from [12].
From the HRV signal, it is possible to extract linear (statistical, geometrical and fre-quency domain) and non linear features that are proven psychophysiological measures. The Standard Deviation of the NN interval (beat to beat interval) (SDNN), the HRV tri-angular index and the Ratio between Low and High Frequencies (LF/HF), are frequently used [12, 19, 29].
1.2.2.2 Electrodermal Activity
The skin is the largest organ of the human body and performs a wide variety of functions. It is composed by a large number of sweat glands that are densely innervated by the SNS. Through the glands secretion, changes in skin conductance can be measured after the application of a small current - this biosignal is called EDA. This measurement is made through a pair of electrodes that are positioned in the hands or feet. Since the applied current is constant throughout the measurement, it is possible to measure the electric potential difference between the electrodes and with this calculate skin resistance. The
skin conductance is the inverse of the skin resistance [37].
As the sweat glands are directly related to the SNS, EDA is an extremely useful mea-sure in the field of psychology because it allows a meamea-surement of the physiological response to a stimulus [21, 54]. This conclusion was reached in several studies [3, 10], in which the number of active sweat glands, which are correlated to the electrodermal events, are related to SNS activation.
two electrodes. These responses could be directly related to stimuli, Event Related Skin Conductance Responses (ER-SCR), or Non-Specific Skin Conductance Responses (NS-SCR) that are present without the registration of external stimuli [59]. Both SCL and SCR can vary from person to person.
In Figure 1.4a is represented an example of an EDA signal and in Figure 1.4b is showed the morphology of a SCR.
The maximum amplitude of the SCR is the most extracted feature in EDA, specially in psychophysiology, since it is considered an index of sympathetic activity [50, 54]. In the Table 1.2, the typical values of some EDA parameters are presented.
(a) (b)
Figure 1.4: (a) Example of an EDA signal, extracted from [38]; (b) Morphology of a SCR, extracted from [13].
Table 1.2: EDA features and respective definitions and typical ranges [37].
EDA feature Definition Typical range
SCL Skin conductance level 2-20µS
SCR latency Time interval between stimuli and SCR be-ginning 1–3 s SCR amplitude Maximum amplitude of the SCR 0.1-1µS SCR rise time Time interval taken to reach the peak 1–3 s SCR half recovery
time
Time interval between the SCR peak and the point where SCR amplitude reaches half its peak height
1.2.2.3 Blood Volume Pulse
The BVP measures the blood flow that passes through the tissues. In every heartbeat, a certain volume of blood is pushed through the body’s arteries reaching its extremities and then returns to the heart through the veins. To measure this signal a Photoplethysmo-graphic (PPG) sensor is used: this sensor emits an infra-red light that can be transmitted, absorbed or reflected by the tissue and it detects how much light returns to the sensor. This amount corresponds to the average of blood volume in the tissue where the light travelled [42, 63]. In Figure 1.5 is presented an example of a BVP waveform from one heartbeat.
Figure 1.5: Example of a BVP waveform, adapted from [42].
The envelope of the BVP signal represents the relative constriction and dilation of the vessels and its directly correlated with the sympathetic activity of the ANS: in situations of fear or pain vasoconstriction occurs, as opposed to vasodilation that happens in relaxing states. HR (and HRV) can be extracted from the BVP since its signal reaches its peak in the ventricular systole, so the time between peaks corresponds to the time interval between heartbeats [42, 78]. More researchers are using this signal as a method to measure HRV since the PPG sensor is more comfortable to the user than the sensors used in medical settings to measure ECG. This signal is also useful on its own since the shape of the BVP wave is an indicative variable of cardiac health and its amplitude is correlated with the sympathetic and parasympathetic balance present in cognitive or emotional activity. For example, the BVP amplitude decreases in the presence of a stimuli that triggers the SNS or the BVP amplitude of a person more driven by their emotions takes longer to return to the their usual baseline level [42, 78, 94].
The usual features extracted from this signal are the SDNN, Root Mean Square of Successive period Differences (RMSSD), Number of pairs of successive NN intervals that
differ by more than 50 ms (NN50) and other time and frequency domain features that
1.2.2.4 Pupillometry
Pupillometry is the study of the pupil diameter variation and its an research area that has been increasingly studied in the psychophysiological field since pupil dilation is a marker of ANS activity, more specifically of sympathetic activation [77]. The most important physiological function of the pupil is to adapt to the ambient light [45]. The pupil increases slowly its size after the occurence of a stimulus, approximately 1s, and, because of that, its acquisition is more common in tasks where events are separeted by a bigger time interval [72].
The process of pupil diameter acquisition is made using an eye-tracker device, which provides information not only about the pupil but also measures the point where the person is gazing. Nowadays the eye-tracker devices rely on a video-camera that tracks one or both eyes and records their moviment using the pupil.
In several studies [46, 52, 55], it is mentioned that the dilation of the pupil is connected with the decision making process, more specifically with the moments after the decision is made and consolidated. Due to this fact, the study of the pupil as a measure in the field of psychophysiological has been increasing. Pupil variation is also present during cognitive tasks processing [11, 47] and affective information processing [24].
In Figure 1.6 is represented the variation of the pupil diameter after the presentation of a visual stimuli.
Figure 1.6: Pupil diameter variation, in arbitrary units, during the presentation of am-biguous visual stimulus, adapted from [46].
Common features extracted from this signal are the average pupil diameter, number of peaks and the Area Under the Curve (AUC) [24, 90].
1.2.2.5 Biosignal Monitoring
The sensors used to acquire the biosignals have a series of pre-processing tools that allow more user-friendly results. Initially, the acquired analogical signal is amplified and filtered to remove background noise and other sources of interference. Then, the signal is discretized in amplitude and time so it can be digitally processed. In this step there is some loss of information but with advanced sensors this loss is minimized by a high sampling frequency (fs). This processing differs for each signal but common processing
tools are filters and spectral estimators [30].
1.2.3 Human-Computer Interaction
Human–Computer Interaction (HCI) is a term that encompasses the influence of com-puter technology and its impact in human life. In the age we live in, this technology is present in almost everything from mobile phones, tablets, television, cars navigation systems and even in smart homes. So, HCI measures our interaction with these devises and allows the improvement of technology to make it more easy and appealing [51].
1.2.4 Personality
In our daily lives, we have the constant need to classify people that surround us in an attempt to know how a certain person will react in a certain situation. That’s why the term personality is used since Ancient history. There are various definitions given by different personality psychologists but all of them have a set of central ideas: personality
can be described as an inner force that leads a person to act, to think or to feel in a certain, consistent way; it is not a set of different parts but, instead, an organization which gives
us our singularity in relation to others; and it is not part of a specific organ, it is an active and dynamic process that occurs inside each individual [23].
Therefore, the aim of personality psychology is to find a theory that describes, explains and predicts human behaviour. To achieve this goal, there is an important distinction to be made, the difference betweenpersonality traitsandpersonality typesordimensions.
The consistent, permanent way in which a person responds to different situations
is called a personality trait. Common traits are impulsiveness, modesty, assertiveness or anxiety. The degree to which a person presents a particular trait is variable, so it can be said that these traits are dimensions of personal differences. All traits can be
represented by a two-pole scale, in which the higher the score the greater the tendency of the individual to behave according to the trait in question. Consequently, the traits are found in all people but in a different degree, which has a normal distribution meaning
that most people are in the middle of the scale and only a few are in the extremities. Lastly, traits are called sub-dimensions of personality [14, 23].
Thus, to a set of several traits corresponds a personality dimension or personality type. For example, according to Costa and McCrae [6], the dimension Agreeableness
is linked to traits like trust, straightforwardness, altruism, compliance, modesty and tender-mindedness.
There are several personality theories and the greatest disagreement between them lies in the number of personality dimensions. In the 1980’s and 1990’s, personality psychology research expanded to different cultures, with assessment tools being adapted
to different languages. Most researchers came to the conclusion that personality was
divided into five basic dimensions, but the name of these dimensions was not always consensual. One of the theories that meets the most universal consensus is that of Costa and McCrae - the FFM - due to numerous validations [23].
Table 1.3: Basic dimensions according to the FFM by Costa and McCrae, their meanings, facets and a list of adjectives attributed to people with high or low scores in them.
Dimensions Meanings Facets High
Scores Low Scores
Neuroticism Assesses adjustment versus instability; identifies individuals prone to disturbances Anxiety; Hostility; Depression; Self-consciousness; Impulsiveness; Vulnerability Depressed; Frustrated; Guilty; Low self-esteem; Insecure Calm; Relaxed; Confident; Self-satisfied; Emotionally strong Agreeableness Involves human aspects of humanity Trust; Straightfor-wardness; Altruism; Compliance; Modesty; Tender-mindedness Unselfish; Caring; Emotion-ally supportive; Modest Hostile; Indifferent to
others; Self-centered; Jealous Conscientiousness Evaluates the organization, motivation and persistence to achieve objectives Competence; Order; Dutifulness; Achievement striving; Self-discipline; Deliberation Thorough; Neat; Well-organized; Ambitious Disorganized; Undepend-able; Negligent; Lazy Extraversion Measures interpersonal interactions, activity level, need for stimulation Warmth; Gregariousness; Assertiveness; Activity; Excitement seeking; Positive emotions Dominant; Talkative; Sociable; Warm Quiet; Reserved; Shy;
Indifferent
Openness to Experience Assesses the appreciation of new experiences; exploration of
1.2.5 Decision Making
Decision making plays a central role in our daily lives. It can be as simple as deciding to act or not to act or can involve much more difficult decisions with an array of different
outcomes depending on the way which we choose to behave.
According to Balleine [35], decision making "refers to the ability of humans and other animals to choose between competing courses of action based on their relative value of consequences". So, in order to assess the decision making behaviour, the most common tasks involve choosing between several options. These tasks also help to study the influence of factors such as personality and stress on decision making. Stress has a well known influence at every stage of the decision-making process [71, 86], unlike personality which has not yet been studied profusely.
Thus, decision making is a complex and dynamic process that includes multiple steps that are interrelated with each other (Figure 1.7). The decision making process starts with the recognition of a problem, followed by the search of information for alternative ways of action. After this the different alternatives are evaluated to make the choice and the
selected action course is implemented [86].
Figure 1.7: Steps of the decision making process.
1.2.5.1 Maximization Theory
Several researchers, mainly in the second part of the 20th century, have proven that the theory that humans are rational choosers is wrong. According to Simon [1], the goal of maximization is almost impossible to achieve given the human cognitive limitations. So he proposed that in the face of a decision-making situation people tend to "satisfice".
Satisficers evaluate their options until one of them is good enough. Maximizerssearch
until the best option is found [22].
Since then, this theory has been studied by many. Schwartz gained prominence in his research that relates maximizer’s behaviour and happiness. He argued that a big-ger number of options to choose from is worse for maximizers, because more alterna-tives to examine causes more uncertainty in relation to the made decision. To satisficers more options may not have impact in their choice because their decision is already good enough. Through his research, he concluded that maximizers experience more regret, are more prone to be depressed and present a higher perfectionism index. On the contrary, satisficers are happier and more optimistic and have a higher self-esteem and higher life-satisfaction level [17, 22].
Thus, Schwartz developed questionnaires to measure regret and maximization be-haviour, the MaximizationandRegret Scalesquestionnaires [22]. These questionnaires
1.3 Objectives
The main objectives of this work are:
• Acquire and process biosignals (ECG, BVP, EDA, and pupillometry) during the realization of a human-computer interaction task;
• Implement a novel EDA processing method;
• Extract features from the biosignals;
• Find a correlation between events occuring on the IGT and events on the EDA signal;
• Predict specific personality traits, assessed through a HCI survey, through models constructed from the extracted features from all biosignals.
A schematic representation of this thesis work is presented in Figure 1.8.
Thus, this work started by looking for participants who fulfilled the necessary re-quirements for the objectives of this work. Their biosignals were recorded during the performance of IGT and after personality baseline data was gathered through the applied personality and decision making behavior questionnaires.
Other aim of this work is to implement and validate a novel mathematical model for the processing of the EDA signal that is based on a morphological analysis of the signal and that is able to detect and quantify single isolated events and overlapping and small amplitude events. After this, the objective was to develop a feature that is based on the SCR component of the EDA signal but that takes also into account the synchronization with IGT.
1.4 Thesis Overview
The thesis basis is described in the chapter 1 and 2. In the first chapter is given an introduction to the motivation and contextualization of this thesis development, as well as a section with theoretical concepts that explain and describe topics that are essential to the comprehension of this project. The main objectives are covered in this chapter as well. Chapter 2 gives information about the state of the art in the areas covered by this thesis.
The experiment and the methodologies used to apply it are described in the chapters 3 and 4. Chapter 3 describes the experiment, as well as the population that takes part of the study and the conditions in which the data was collected. Chapter 4 describes the software and hardware material used throughout this thesis, as well as the methods applied to process the biosignals and extract features from them. The machine learning algorithm used for feature selection and classification is also explained in detail.
C
h
a
p
t
e
2
S t a t e o f t h e A rt
2.1 Biosignal Monitoring
The development of equipments to measure biosignals is an area of extensive research in the biomedical engineering field. The conventional devices for physiological signals (PS) monitoring, still used in most hospitals, rely on infrared technology and rigid multi-electrode pressure sensors that limit their portability and wearability [82]. The recent technological development in miniature biosensing devices, smart textiles, microelec-tronics and wireless communications associated with the need to monitor PS out of the hospital environment has led to the development of wearable sensor-based systems with small sensors that can monitor PS at any time or place [58].
The PS monitors used in this work are theBiosignalsplux and the SensoMotoric
In-struments (SMI). The Biosignalsplux is a wearable, wireless device that provides a much
comfortable method to record biosignals such as EEG, ECG or BVP, for extensive periods of time [95]. The SMI company provides eye tracking solutions such as mobile Eye Track-ing Glasses (ETG) and Remote Eye trackTrack-ing Devices (RED). Their technology, through video-camera, tracks the pupils and computes the gazing direction, the eyes movements and also points of regard, using sampling frequencies ranging from 30 Hz to kHz [96].
2.2 Personality Assessment
Due to its universal acceptance, the FFM questionnaires have been translated and vali-dated to several languages. The NEO-FFI, a short version of the NEO-PI-R, has 60 items and measures the five basic dimensions. Its original version, written in USA English lan-guage by McCrae and Costa, has aCronbach’s alpha, used to measure internal consistency,
been validated with better results, 0.75 to 0.82 [27]. The German-language version of the NEO-FFI, developed by Borkenau and Ostendorf [8], was validated and presented values
ofCronbach’s alpharanging from 0.71 to 0.85 [20].
There are research being done that correlates personality traits with HRV. Results show a high negative correlation between Neuroticism and Power in High Frequencies (HF) and a high positive correlation with LF/HF. A negative correlation between HF and Openness to Experience was also noted [84].
Liza and colleagues (2016) analysed the influence of personality dimensions in con-cealing guilt. They were asked to commit a mock theft and after were tested in the Guilty Actions polygraph Test. Individuals with a low score on the Extraversion dimension showed larger SCR [87].
ASCERTAIN is a database that correlates the FFM personality scales to emotional states [88]. This relationship is measured through EEG, ECG, EDA and facial activity data features, linear and non-linear. These data is collected during affective movie clips
visualization. The conducted analysis in this study suggests that non-linear statistics explain better the relation between emotion and personality dimensions.
In 2017, researchers collected and gathered in a database, AMIGOS, research on affect, social context, personality and mood of individuals and groups of four people. The
physiological data, EEG, ECG and EDA, is recorded during the visualization of short and long videos and is used to correlate affective responses to personality and mood. The EDA
features recorded during the long videos were the best predictors of personality traits, PANAS (self-report questionnaire that measures positive and negative affect) and social
context, while EEG was the best predictor of valence and arousal affective states [92].
There are not many studies that directly correlate FFM personality dimensions with biosignals, specially with the combination of ECG, EDA, BVP and pupil diameter signals, so the work that will be done in this thesis can further develop this field.
2.3 Assessment of Decision Making Behaviour
Through the years several gambling tasks were developed in order to evaluate decision making behaviour. Most of them, like the IGT [9] or the Cambridge Gambling Task [15] were used to simulate decision making situations with a degree of uncertainty or risk.
The IGT was developed by Bechara and colleagues in 1994 [9]. This task is a card game that simulates decision making in a environment where the person receives feedback to evaluate the probability of gaining a reward or getting punished. With the feedback of the money lost or won, given after each round, the player should conclude that the card decks associated with a high gain are associated with a high loss and the card decks with low gain are associated with a low loss, so the latter are more advantageous in the long run [9, 75].
Performance on IGT can be measured through the difference between the total sum of
or the number of cards chosen from the advantageous and disadvantageous decks during the five consecutive blocks of the task, which allows the tracking of the learning evolution of the players [31, 36, 75].
The performance in the IGT can be correlated with the level of maximization of the person. The original versions of the Maximization and Regret Scales, developed by Schwartz et al. [22], have an Cronbach’s alphavalue of 0.71 and 0.67, respectively. The German-language version [32], used in this study, also had good results of internal consistency with a Cronbach’s alpha of 0.67 and 0.77 for the Maximization and Regret
Scales.
Goudriaan and colleagues (2006) conducted an experiment where they compared the performance on the IGT of a pathological gamblers (PG) group with a normal control (NC) group while recording ECG and EDA. The PG group showed lower SCR and a decrease in HR while they were pondering about what to choose. After both loosing and winning the PG presented a decrease in HR, while the NC group presented an increase after winning and a decrease after loosing [31].
Claudio Lavín and colleagues (2014) studied pupil dilation during the performance of IGT. Their results showed that the pupil diameter increased during the presentation of positive feedback, when in a learned uncertain situation, and in the negative feedback presentation as weel, influenced by surprise [79].
In 2017, HRV and EDA signals were monitored during the IGT, and other gambling tasks, in order to measure the influence of anxiety and depression in decision making behaviour. The results showed that anxiety and sympathetic reaction to losses are strong predictors of good scores in the task. Depressed participants with low tonic HRV predict worse IGT performance [93].
C
h
a
p
t
e
3
M e t h o d s
In this chapter are described the methologies used throughout the development of this thesis. First there is a description of the used software and hardware materials; then it is given an explanation about the personality assessment questionnaires and the last sections present the computational methods used for the biosignals processing, the ex-traction of features and the machine learning algorithm developed to find the best com-bination of features to predict the FFM and Maximization and Regret scales.
3.1 Technological Materials
TheLimeSurveyweb application was used to conduct the web surveys and the collected
data was extracted through acsvfile to be processed later.
To acquire the ECG, EDA and BVP signals, theBiosignalsplux, a wearable device with 8
analogue channels and bluetooth connection, was used [95]. This device has the following sensors:
• Electromyography;
• Electrodermal activity;
• Electrocardiogram;
• Electroencephalogram;
• Accelerometer;
• Temperature;
• Force;
• Light;
• Foot switch;
• Pushbutton;
• Goniometer;
• Load Cell;
• Vaginal Electromyography;
• RFID Sensor;
• SpO2Sensor;
• Blood volume pulse;
• Force platform.
TheSMI RED[96] was used to acquire the eye-tracking data.
The IGT was programmed in thePresentationsoftware from Neurobehavioral Systems [98].
Data acquisition was conducted using in-house done software based on Python lan-guage. This software connects and synchronizes theBiosignalspluxdevice, the eye tracker and the IGT program and returns a file with all the acquired data.
To process these biosignals, the code editor PyCharm v2016.3.3 was utilized using Python v3.6.0 language [64, 101]. The Python Packages used for data visualization were Matplotlib v2.0.0 [39] and Seaborn v0.7.1 [99]. NumPy v1.11.3 [66] is the standard package used for numerical computation in Python. SciPy v0.19.0 [73] supplies ad-vanced mathematical functions, such as integration and statistical functions, supported by NumPy arrays. Pandas v0.19.2 [56] provides data structures and statistic tools used to compute large data sets. Scikit-learn v0.18.1 [65] is a Python package with a variety of im-plemented state-of-the-art machine learning algorithms for supervised and unsupervised problems.
The packagenovainstrumentation[97], used on Digital Instrumentation class at Fac-uldade de Ciências e Tecnologia, Universidade Nova de Lisboa, was also used in the processing of ECG, specifically in the QRS complex detection. ThePyEEGv0.02 r2
3.2 Biosignals Processing
In this section, the algorithms applied to process each biosignal are described. The pro-cessing of all signals was made after its acquisition. All the propro-cessing tools used in this work come from the Python packages mentioned in the section 3.1. Subjects whom syn-chronization between physiological data and IGT times was not possible were discarded. All biosignals were segmented to exclude the data that was acquired before and after the task ended, so that only the data collected during the IGT could be analyzed. Also, ECG and EDA data were converted from Analog-to-Digital Converter (ADC) to mV andµS, respectively, and the pupillometry data from pixels to mm. The BVP signal does not have a standard unit.
3.2.1 Electrocardiogram
In the fluxogram presented in Figure 3.1 are shown the steps followed for the processing of ECG.
First the signal is normalized and filtered with a Butterworth bandpass filter of 8 -30 Hz. These cut-offfrequencies were chosen in order to extract only the frequencies
of interest of the R wave [18] (see Figure 1.2) since the next step of processing involves peak detection. The purpose of this filter is also to remove high frequency noise, baseline wandering and the respiratory rate component, which is generally inferior to 0.5 Hz.
The peak detection was performed using an implementation of the Pan-Tompkins algorithm [4], fromnovainstrumentationrefered in the section 3.1. This algorithm reliably
detects the QRS complex of the ECG signal, allowing the extraction of HR and HRV which are final results of the ECG processing that are used for feature extraction.
3.2.2 Electrodermal Activity
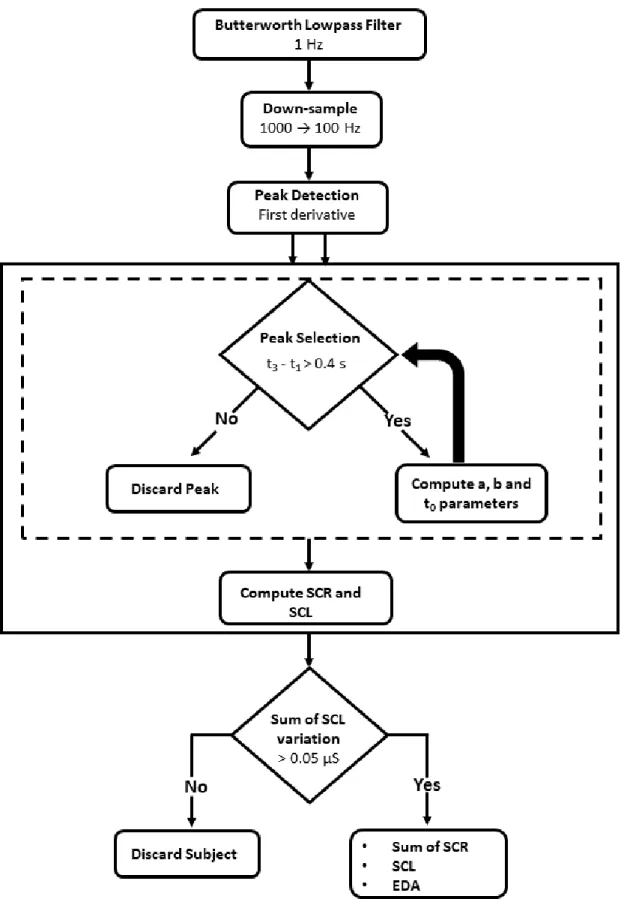
In Figure 3.3, the processing steps used to extract the SCR and SCL are presented through a fluxogram.
Initially the EDA signal is filtered with a low-pass Butterworth filter with a cut-off
frequency of 1 Hz and then, to decrease its complexity, it is down-sampled to 100 Hz since the frequencies of interest are within the range 0 to 1 Hz. The Nyquist theorem dictates that the fs must be at least two times superior to the maximum frequency of interest so that information contained on the signal is not lost [33]. Thus, according to Nyquist, this down-sample step does not cause loss of information since in this case, the fs must be at least 2 Hz.
Then, the psychophysiological EDA model described in [38] was implemented with the objective of testing its validity and efficiency when processing EDA recorded during
the performance of a gambling task as well as its utility for the extraction of features used to predict personality. This mathematical model is focused on the morphological characteristics of the EDA signal and solves other models main issues - the detection of overlapping EDA events and the detection of low amplitude events. Some alterations were introduced in order to decrease the computation time, such as the suggested cut-off
frequency of the low-pass filter which was 2 to 5 Hz.
Figure 3.2: SCR morphology and respective first and second derivatives, from [38].
The first step of the algorithm, after filtering, is to compute each SCR. The morphology of the SCR is represented in Figure 3.2. To do this, the algorithm suggests the calculation of the second derivative zeros to extract the time parameters (t1andt3), needed to
recon-struct each SCR. Instead of this, the calculation of the maxima and minima from the first derivative was executed since it proved itself more time efficient in terms of computation
and it has the same mathematical meaning.
Then, a step to select the peaks was implemented to set aside smaller peaks that are not important for this study. The chosen criteria was to forgo the peaks in which the time difference betweent1andt3was smaller than 0.4 s. The peaks that surpass the selection
parameters are used to compute each peak through the formula present in equation 3.1, where u(t) represents the unitary step function.
h(t) =a(t−t0)4e−b(t−t0)u(t−t0) (3.1)
t0parameter is related to the SCR onset and it is calculated through Equation 3.2. ais
connected with the event amplitude andbwith the decay time of the SCR after its peak. Their computations are made according to Equations 3.3 and 3.4.
t0=3t1−t3
2 (3.2)
a=b3 f ′
t1−f
′
t3
16e−2+ 432e−6 (3.3)
b= 4
t3−t1 (3.4)
After this, the SCL is computed subtracting the sum of all SCR to the filtered EDA signal.
3.2.3 Blood Volume Pulse
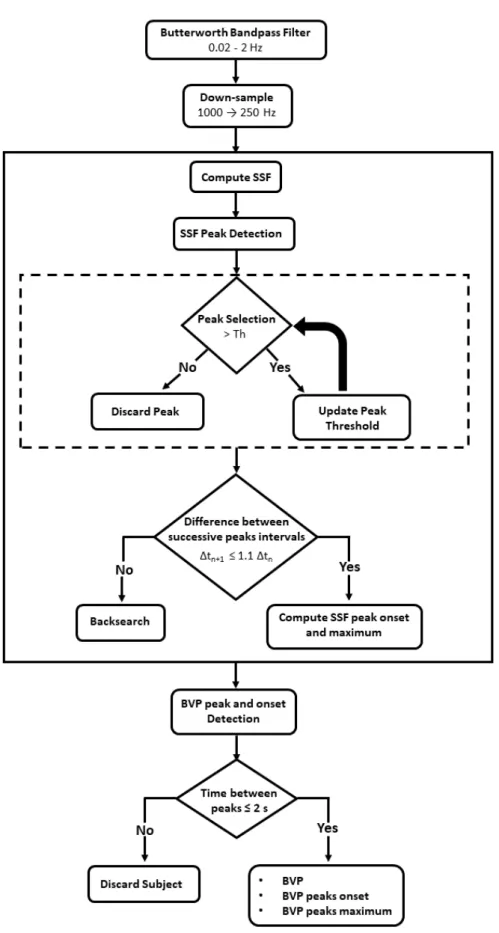
In Figure 3.4, the fluxogram presents the steps followed to process the BVP signal. The processing of the BVP signal starts by filtering it with a bandpass Butterworth filter with cut-offfrequencies of 0.02 and 2 Hz. These filter is chosen since the bandwidth
of the BVP sensor ranges from 0.02 to 2.1 Hz. After this, the signal is down-sampled to 250 Hz, which according to the Nyquist theorem does not cause any loss of information. For the detection of the BVP peaks was implemented an algorithm adapted from [57]. This algorithm starts by computing the Slope Sum Function (SSF) of the BVP signal, present in equation 3.5 wherewis the lenght of the time window andBV Pkthe filtered BVP signal. The aim of this step is to enhance the onset of the BVP peak and to detect the SSF local maxima. The SSF peaks are selected using the adaptive threshold presented by Zong and colleagues in [25]. After this, a backsearch routine is performed in the cases where the time difference between successive peaks is bigger than 110%. With the
detection of the SSF onsets and local maxima, the onset and maximum value of each BVP peak was computed.
ssfi=
i
X
k=1−w
△uk,△uk=
△BV Pk : △BV Pk>0
0 : △BV Pk≤0 (3.5)
3.2.4 Pupillometry
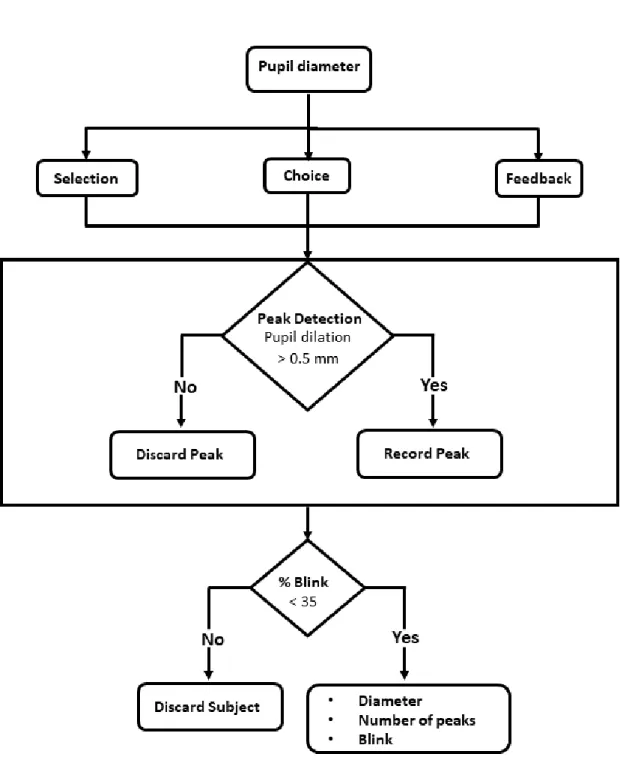
In Figure 3.5, the processing steps used to extract information from the pupillometry data are presented through a fluxogram.
The first performed step to process the pupil diameter segmented the signal into three: data from the selection, choice and feedback phases of the IGT. The data from these segmentations was processed the same way. For the detection of peaks, the chosen criteria was the pupil dilation, if it was greater than 0.5 mm it was considered a peak in diameter.
3.3 Features Calculation
The features computed from each signal are presented in this section. All features were extracted from the signal recorded during the complete performance of IGT and the same features were also extracted dividing the task in five blocks of 20 trials. In other studies [36, 61, 91], this division is made based on the fact that, in the first blocks, the players are still learning which of the decks are advantageous or disadvantageous and, in the latter ones, they already know which decks are the best for the long run.
3.3.1 ECG Features
In the Tables 3.1 and 3.2 are presented the features that were extracted from the HR and the HRV. Statistical features (mean, standard deviation, maximum and minimum) were computed from HR and HRV. Since HRV is a relevant tool to assess the sympathetic and parasympathetic functions, a series of linear and non linear features were extracted.
Most of the statistical, geometrical and frequency domain features are well known parameters that have been used in other psychological studies [43, 48, 85]. RMSSD, NN50 and the Percentage of NN differences greater than 50 ms (pNN50) are associated with
short term, high frequency variations in HR while the SDNN (standard deviation of the HRV) and the HRV triangular index are estimators of the overall HRV [12].
The HRV triangular index, Triangular Interpolation of the NN intervals (TINN) and stress index are geometrical features that are computed from the HRV histogram - his-togram presented in Figure 3.6a. The stress index is a measure of the level of activity prevalence of central mechanisms regulation above ANS. The logarithmic index, φ, is computed from the histogram of absolute differences between adjacent NN intervals
whereφ is the coefficient of the negative exponential curve that best approximates the
histogram form [12]. Standard Deviation of instantaneous beat-to-beat variability (SD1), Long-term Standard Deviation of continuous NN intervals (SD2) and Ratio of short inter-val variation to long interinter-val variation (SD1/SD2) are features extracted from the Poincaré plot of the HRV (Figure 3.6b).
For the computation of the frequency domain features, the PSD was estimated, accord-ing to the Welch method, in order to obtain the distribution of power in function of the frequencies that compose the HRV signal. Prior to this, the HRV signal was interpolated (cubic spline interpolation) due to it being an unevenly spaced signal and for the PSD estimation the signals must be evenly spaced in time. The interpolated HRV signal has a fs = 4 Hz. The most computed features are the Power in Low Frequencies (LF) and HF as well as the LF/HF. The LF component is in an indicator of sympathovagal balance, while the HF component is only related to the parasympathetic activity and the LF/HF measures the predominance of the sympathetic or parasympathetic systems [85].
(a) (b)
Figure 3.6: Examples adapted from [19]: (a) HRV histogram with the triangular interpo-lation marked with black dashed lines to compute the TINN; (b) Poincaré plot.
based in chaos theory [29]. Correlation dimension (CD) measures the self-similarity of the signal with the Grassberger-Procaccia algorithm and its value increases in presence of chaotic data and decreases if HRV decreases as well [83]. ApEn measures the unpre-dictability of fluctuations in time-series, so a time-series with repetitive patterns scores low in this feature while a more complex signal has a high score; Largest Lyapunov Expo-nent (LLE) evaluates quantitatively the dependence on the initial conditions [44]. Sample Entropy (SampEn) evaluates complexity in a similar way to ApEn; the Fractal Dimension (FD) assesses the number of units that compose a curve in comparison with the minimum number of units that is required to reproduce a pattern of the same spatial size, according to the Higuchi algorithm; the Hurst measures the presence of long-term dependencies of the time-series and the degree of these dependencies; theα slope is a parameter ex-tracted from the Detrended Fluctuation Analysis (DFA) of a signal that quantifies fractal scaling properties of NN intervals and it is an estimator of roughness of the time-series - the bigger theα the smoother the time-series [29]. The autocorrelation parameter was
Table 3.1: Statistical and geometrical features extracted from ECG signal. From the fea-tures marked with *, statistical parameters are computed. All other feafea-tures are computed from HRV.
Feature Meaning
Statistical
HR* Heart rate
HRV* Heart rate variability CV Coefficient of variance
SDSD (interbeat intervals)Standard Deviation of Differences between adjacent NN intervals RMSSD Root Mean Square of Successive Period Differences
NN50 Number of pairs of successive NN intervals that di50 ms ffer by more than pNN50 Proportion of NN50 divided by the total number of NN intervals NN20 Number of pairs of successive NN intervals that di20 ms ffer by more than pNN20 Proportion of NN20 divided by the total number of NN intervals
Geometrical
HRV triangu-lar index
Integral of the density distribution divided by the maximum of the density distribution
TINN Triangular Interpolation of NN interval histogram
SI Stress index
φ Logarithmic index
Table 3.2: Frequency domain and non linear features extracted from ECG signal. All features are computed from HRV.
Feature Meaning
Frequency domain
VLF Power in Very Low Frequencies (f < 0.04 Hz) LF Power in Low Frequencies (0.04 < f < 0.15 Hz) HF Power in High Frequencies (0.15 < f < 0.4 Hz) LF/HF Ratio between low and high frequencies Total power Total power (f < 0.4 Hz)
% VLF Ratio between VLF power and total power % LF Ratio between LF power and total power % HF Ratio between HF power and total power
LFnu Relative value of LF power in proportion to the total power minusthe VLF component
HFnu Relative value of HF power in proportion to the total power minusthe VLF component
VLF peak Frequency of the maximum value of the VLF LF peak Frequency of the maximum value of the LF HF peak Frequency of the maximum value of the HF
Non linear
CD Correlation Dimension SampEn Sample entropy
αslope of DFA Fractal scaling
H Hurst exponent
LLE Largest Lyapunov exponent FD Fractal dimension
ApEn Approximate entropy
![Figure 1.2: ECG signal with one cardiac cycle showing the P, Q, R, S, T and U waves and the segments between waves, from [34].](https://thumb-eu.123doks.com/thumbv2/123dok_br/16538628.736632/28.892.243.649.156.496/figure-signal-cardiac-cycle-showing-waves-segments-waves.webp)