R E S E A R C H A R T I C L E
Open Access
Provenance in bioinformatics workflows
Renato de Paula
1, Maristela Holanda
1*, Luciana SA Gomes
2, Sergio Lifschitz
2, Maria Emilia MT Walter
1From
The Second Workshop on Data Mining of Next-Generation Sequencing in conjunction with the 2012
IEEE International Conference on Bioinformatics and Biomedicine
Philadelphia, PA, USA. 4-7 October 2012
Abstract
In this work, we used the PROV-DM model to manage data provenance in workflows of genome projects. This provenance model allows the storage of details of one workflow execution, e.g., raw and produced data and computational tools, their versions and parameters. Using this model, biologists can access details of one particular execution of a workflow, compare results produced by different executions, and plan new experiments more efficiently. In addition to this, a provenance simulator was created, which facilitates the inclusion of provenance data of one genome project workflow execution. Finally, we discuss one case study, which aims to identify genes involved in specific metabolic pathways ofBacillus cereus, as well as to compare this isolate with other
phylogenetic related bacteria from the Bacillus group.B. cereusis an extremophilic bacteria, collected in warm water in the Midwestern Region of Brazil, its DNA samples having been sequenced with an NGS machine.
Introduction
The speed and efficiency with which scientific workflows may be performed have increased with the use of modern hardware and software technologies. One workflow can be executed many times with different programs, versions or parameters, or even modified input data, and scientists can compare results from these executions, which improves accuracy in data analysis. However, dealing with large volumes of information produced by many executions under a variety of conditions becomes increas-ingly difficult. In this context, new tools have to be devel-oped to store data generated in each execution, together with the origin of this data and the details of a particular execution.
Therefore, on the one hand, data provenance is essen-tial to scientific environments. Many works describe details of data provenance [1,2], classify their characteris-tics [3], propose models [4-7] and present practical appli-cations [8,9]. Buneman et al. [10] define data provenance as “the description of the origins of a piece of data and the process by which it arrived in a database”. In other words, the origin of data used as raw material as well as the processes that transformed this data into the final
product, must be identified and stored. It is important to note that, before choosing which data has to be stored, it is necessary to define how these data have to be struc-tured so that they can be later recovered and understood. This explains the development of many distinct prove-nance models, e.g., W7 Model [4], Provenir Ontology [11], Provenance Vocabulary [5], Open Provenance Model (OPM) [6] and PROV-DM model [7].
On the other hand, genome projects aim to analyze DNA or RNA sequences produced by one NGS sequen-cer, e.g., 454/Roche [12]. According to the objectives of each project, many databases and programs are sequen-tially executed in a computational workflow, using DNA or RNA sequences as raw data and producing a large volume of information (Terabytes of data). Therefore, biologists analyze the generated data and, in order to obtain better results, propose improvements to the pro-ject, choosing different programs or requiring new executions of the same programs with different para-meters. Thus, when one workflow execution is con-cluded, much information can be lost if there is no systematic procedure exists to store details of each execution, including adopted software and parameters, problems and related solutions, as well as information produced at each workflow step.
* Correspondence: [email protected]
1Department of Computer Science, University of Brasilia - UnB, Brasilia, Brazil Full list of author information is available at the end of the article
In this study, we propose to manage data provenance in bioinformatics workflows using the PROV-DM model [7]. This provenance model aims to store details of each workflow execution in a way that biologists can compare information generated among different executions and more efficiently plan new ones. Stored data includes raw and produced data at each workflow step, used para-meters, the order in which the programs are executed and details of how data are linked. Our provenance model allows us to recover the process flow as well as to reconstruct the relations among input data and the pro-cesses generating new data, using different granularities.
PROV-DM model
The PROV-DM model [7], proposed by the W3C (World Wide Web Consortium), is a conceptual data model that forms the basis for the W3C provenance (PROV) family of specifications. PROV-DM is based on the Open Provenance Model (OPM) [6] although more precisely defined. A PROV-DM showing the provenance description is graphically illustrated by a directed graph, rooted at the entity for which we want to explain the provenance.
PROV-DM core structure defines two initial elements, Activity and Entity, which can originate nodes in the provenance graph.Activityrepresents a process indicat-ing the origin of one provenance object.Entity models any object representing some type of provenance.Entity element has two subtypes. The first one,Agent, can act
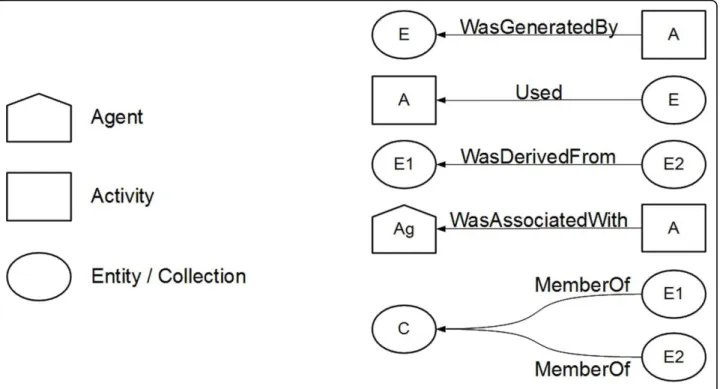
over an Activity, or it presents some kind of responsibil-ity over an Entresponsibil-ity, e.g., owner or author’s rights. The second one,Collection, represents a set of Entities, each one independent of its provenance content. Symbols representing elements of the provenance graph are illu-strated in Figure 1.
Relations among the nodes are represented by the PROV-DM graph edges, which describesdifferent types of relations, the following ones being the most impor-tant to this study:
•wasDerivedFrom indicates that an originalEntity was used, directly or indirectly, to generate another derivedEntity;
•wasQuotedFromis a particular type of wasDerived-From relation, and indicates that an Entity was gen-erated from copying a part of an originalEntity; • used indicates that an Entity was used by an Activity;
•wasGeneratedByindicates that an Entitywas gen-erated by anActivity;
• memberOf indicates which Entities belong to a Collection;
•wasAssociatedWithindicates that an Activity was associated to anAgent.
Constraint is another important PROV-DM property. Constraints are related to rules or restrictions associated with the construction of a provenance graph, having
two main objectives: preventing the creation of invalid or inconsistent graphs; and making inferences about the elements and the relationships among them.
Besides this, PROV-DM annotation allows one to write additional information to any element of a prove-nance graph, which is extremely important since details about a specific process or element in a particular execution of a workflow can then be stored.
Genome project
High-throughput sequencing machines, e.g., 454/Roche [12], produce hundreds of thousands of DNA or RNA fragments that have to be analyzed in genome or tran-scriptome projects. These NGS sequencers generate Gigabyte files, containing DNA or RNA sequences to be processed in computational systems named“workflows”. Common phases in a workflow are described next.
In thefilteringphase, the sequences are“cleaned”such that only the ones with a minimum of quality are included in the following phases, i.e., low quality sequences are discarded. This is possible because NGS sequencers provide quality for each base (represented as a letter in the alphabet Σ = {A, C, G, T (DNA) or U (RNA)}) of each fragment (a string inΣ). Data format generated by the sequencer is modified to string files, which will be processed in the following phases.
In the assembly phase, groups of fragments sharing similar regions are clustered into contigs. This is done for large fragments, such as those generated by 454/ Roche. Longer regions containing contigs formscaffolds, constructed using a phylogenetic related organism as reference genome.
In the analysisphase, according to the objectives of the genome or transcriptome project, different analyses may be executed, e.g., annotation (a biological function is assigned to each contig, using comparison algorithms and large databases), identification of enzymes in order to find putative metabolic pathways involved in certain reactions, or phylogenetic reconstruction showing evolu-tionary relationships among the studied and related organisms. The analysis phase is the most space expen-sive one, since it may generate Terabytes of information, when compared to the previous phases, which generate Gigabytes of information.
In a genome or a transcriptome project, information may be stored in a file system or a DBMS. Input (raw data) for the workflow is the set of sequences generated by one NGS sequencer. As previously mentioned, out-puts depend on each project objectives, but each work-flow phase deals with specific databases and programs generating very large amounts of data. This information, together with versions and parameters of the programs, must be stored. Moreover, genome and transcriptome projects usually involve different executions of the same
workflow using different parameters or including other databases. In this context, a provenance model is very important since it guarantees access to details of each execution of the workflow, and this allows the biologists to study how the modifications can affect the resulting data, so improving the analyses.
Data provenance in genome projects
Managing data provenance in genome projects is essen-tial to control how the enormous volumes of data were generated since, as mentioned earlier, they involve dis-tinct analyses performed by many programs and data bases, with different versions and parameters. We pro-pose here to use the PROV-DM model to manage data provenance in bioinformatics workflows. The PROV-DM model is simple, well documented, and can be easily adapted to include provenance in genome workflows [13]. We propose a model with two levels of granularity, in order to keep structured bioinformatics provenance infor-mation. The first level corresponds to the PROV-DM model based provenance graph, and includes details about each graph node. The graph is composed by Collections, performedActivities andAgentsoperating in a particular execution, besides presenting relationships between each pair of elements. Collections are used to represent a group of Entities, which are composed of millions of DNA or RNA sequences.
Relations in our PROV-DM based model are:
•memberOf linkingEntitiesto Collections;
•Usedand WasGeneratedBymaintain their behavior whenCollection is used;
•WasDerivedFromcharacterizes a transformation of anEntityor aCollection into another.
To represent data provenance in a bioinformatics workflow, we propose to include two new elements, Pro-ject and Workflow Execution, besides the PROV-DM components. Project was created to join distinct re-executions of a genome project workflow.Workflow Executionstores information about one workflow execu-tion. A set of minimum information related to each entity is shown in Table 1.
The second level allows access to the original input files used in one workflow execution. e.g., transcripts (expressed genes), as well as the output files produced in each phase of the workflow. Since one execution of a workflow generates large amounts of information, which may, or may not, be relevant for future analysis, biologists can decide what information will be stored or discarded.
the genome project objectives. Although separated, information of the two levels remain linked, which allows transparent access to these data.
PROV-DM for provenance in bioinformatics workflows
PROV-DM model defines elements and relationships, as well as restrictions and inferences that can be used in a variety of ways according to the context in which data provenance is applied. In this section, these topics are discussed with regard to bioinformatics workflows.
Managing elements
The PROV-DM elements used in this project areentity, activity, agentand collection, which represent possible nodes of the provenance graph, and account to repre-sent the graph itself. In the following, we discuss how we used them in our proposal of a provenance model for bioinformatics workflows.
We first address theentityelement, which has three types:agent,accountandcollection. Theagent element will be used to represent any person, institution or ser-vice that makes some kind of action in an activity. The accountelement will capture the execution of a particu-lar experiment, and therefore it represents a provenance graph. The entity element will be used to represent
basic data, e.g., a DNA sequence or an alignment. When a workflow is executed in a genome project, theentity element will be used when the user needs to know the content of a collection. It is always possible to graphi-cally exhibit all the entities, but since some information, such as the raw data, wastes large amounts of storage space, sometimes it is not possible to show all of them, but only the collections themselves.
The other basic PROV-DM element is activity. In bioinformatics projects, anactivity represents any pro-cess that can be executed in an experiment (workflow). Theactivityelement will indicate the properties of one executed program, including command lines and pro-gram name and version, among others. Notably, among the elements composing the graph (entity,agent, collec-tion andactivity), the later is the only one having tem-poral characteristics (start and end times).
Finally, with the objective of improving the creation of personalized provenance graphs based on distinct execu-tions of a workflow, an attribute calledGroupwas defined. This attribute can be found in the nodes of the graph or in thecollectionelements. A group is defined by the user when each element is created and, due to its multiple attri-bute status, each element can be part of different groups. This allows the user to visualize only a part of the prove-nance graph by choosing some of these groups.
Table 1 Information of the provenance graph for a genome project (already shown in de Paula [16])
PROJECT WORKFLOW EXECUTION
Name Description Funding Institutions Partner Institutions Coordinator Start Date End Date
Name of theProject
Description of theProject
List of theProjectfunding institutions List of theProjectpartner institutions Name of theProjectcoordinator
ProjectStart date
ProjectEnd date
Name Description Location Date Version Date Version Notes
Name of theWorkflow Execution
Description of theWorkflow Execution
Execution Location Execution Date Version Date Version number
Any information about the execution of theWorkflow Execution
AGENT ACTIVITY Name Institution Position Function Groups Notes
Name of the person Affiliated Institution Position or Function
Function in theWorkflow Execution
Filtering provenance graph groups Any information aboutAgent
Name Program Version Command Line Function Start Time End Time Environment Groups Notes
Name of theActivity
Program Name Program Version
Command Line used and parameters Description of what is being done Date and time theActivitybegan Date and time theActivityended Description of computational environment
Filtering provenance graph groups Any information about the execution of theActivity COLLECTION ENTITY Name Size Description Location Group Notes
Name of theCollection
Number ofEntitiescontained inCollection
Description of theCollectioncontent Location of the file or database with the Content of theCollection
Filtering provenance graph groups
Any information about the content of theCollection
Name Description Location Group Notes
Name of theCollection
Description of theEntitycontent Location of the file or database with the content of theEntity
Filtering provenance graph groups Any information about the content of the
Managing relations
PROV-DM relations are represented by edges linking different nodes of the provenance graph. These edges are directed and show how each object was generated, since the path in the graph begins in the generated object and comes to the origin of this data, passing through the events that generated that object. The PROV-DM model describes different types of relations, and since we are working on bioinformatics projects, we have adopted some definitions.
The first relation to be considered isUsed, which links a collection or an entity to the activity that used this collection or entity. A directed edge goes from the activ-ity to a collection or entactiv-ity, which can be used in dis-tinct activities. Similarly, each activity can use different collections or entities. This is good for bioinformatics projects, since a particular file can be used by different processes, e.g., a genome reference can be used in differ-ent mapping processes.
The relationWasGeneratedByindicates which activity generated a particular collection or entity. The edge goes from the collection or entity to the activity that generated it. One activity can generate a variety of col-lections or activities, however each collection or entity can only be generated by a single activity. This way, dif-ferentWasGeneratedBy relationships can be created for only one activity, however, only one activity can occur for each collection or entity. This definition models the processes executed in bioinformatics projects, where one particular data (or file) can only be generated by a single program.
The relationWasAssociatedWithstores the agent that has executed an action of an activity. The edge goes from the agent to the activity. Multiple connections among different agents and activities are allowed.
The relation WasDerivedFrom indicates how the link was derived, during the execution of one experiment, between the used and the generated data. In a bioinfor-matics workflow, different processes can be executed, so the attributeType of Derived Linkwas associated to each edge with one of the following characteristics:filtering, the collection was derived by a filtering process;ordering, the derived collection was rearranged according to some ordering criterion; mixing, the created collection has a data format different from the original one; other, any other process distinct from the previous ones.
Considering that the relationsUsed,WasGeneratedBy, WasAssociatedWith and WasDerivedFromcan present multiple links, and when the identification of these links store important provenance information in the graph, the attributeRoleprovides the identification of each one of these links. This way, each of the four relationships has an associated attribute Role, which value will be
defined by the user to precisely indicate the reason why the corresponding edge has been created.
Restrictions
As previously stated, PROV-DM model defines a list of generic restrictions in order to allow the validation of the provenance graph. These restrictions are divided into three types: structural, temporal and functional, described as follows.
Structural restrictions
Structural restrictions allow the construction of a more concise provenance graph, avoiding ambiguous informa-tion and guaranteeing that the execuinforma-tion of each experi-ment (one execution of the bioinformatics workflow) can be reproduced. The most important restriction for keeping the provenance graph structured is that each element of the graph has to have a single identifier, including the graph itself. This also supports the crea-tion of relacrea-tionships using the identificacrea-tion of each element.
Another structural restriction is the creation of valid relationships in the provenance graph. A single relation-ship can be created fromexistingandvalidnodes.Existing nodes are those that have already been created and inserted in the experiment, andvalid nodes are those expected for each relationship.
These relationships allow the construction of the prove-nance graph structure. Thus, we defined a list of restric-tions that must be followed when creating a relarestric-tionship:
•no two identical relationships exist, i.e., it is not possible to have two relationships of the same type with the same origin and the same destination; •only one relationship WasGeneratedBylinked to each entity or collection of the provenance graph is allowed;
•in the relationshipWasDerivedFrom, the elements “origin”and“destination”must be different.
Temporal restrictions
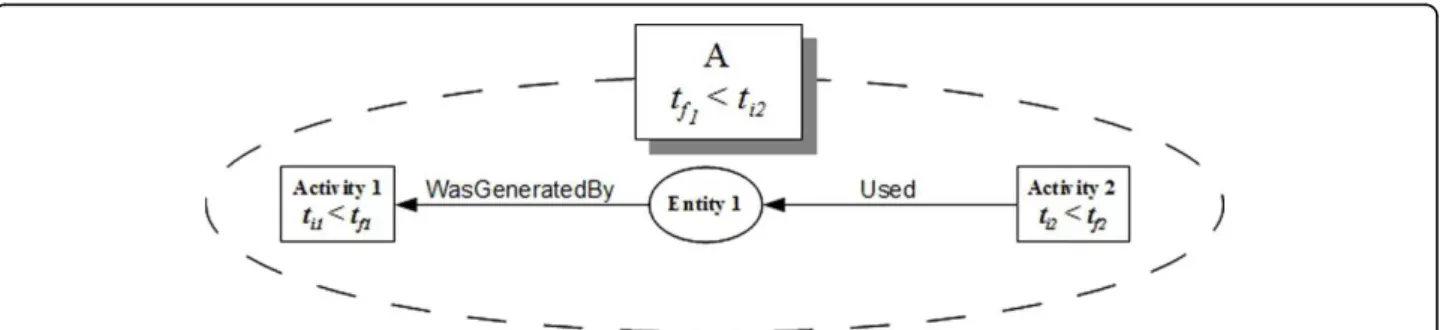
The objective of temporal restrictions is to avoid creat-ing graphs representcreat-ing sequences of processes that are impossible to occur in a bioinformatics workflow. To simplify the creation of the bioinformatics workflow provenance graph, we defined three elements with tem-poral characteristics: project, account (representing the graph itself) and activity.
their start times;WasAssociatedWith, the agent activity times are the activity start time and end time.
These characteristics allowed us to adopt the following restrictions:
• Activity: the start time of an activity must be less than its end time;
•WasGeneratedBy: a collection or an entity can only be generated by an activity whose end time is less than all the hours when this collection or entity has begun to be used;
• Used: analogously, an activity can only use a col-lection or entity if the start time of this activity is greater than the start time of this collection or entity;
•WasDerivedFrom: a collection or entity can only be derived from another original collection or entity if the start time of the original is less than the hour of having generated the derived one.
Temporal restrictions of Used, WasGeneratedByand WasDerivedFrom can only be evaluated when the ele-ments that can be validated are identified, which means that the restrictions can only be observed from the moment that there exists at least one collection or one entity being used by an activity and being generated by another activity exists. This is a minimum set of tem-poral restrictions that need to be verified. Figure 2 shows an example of a graph having a minimum set of elements that allows the verification of these three tem-poral restrictions, since the temtem-poral characteristics (start and end times of each activity) need to be validated.
Functional restrictions
The last type of restrictions refers to the functionality of an experiment. Collections point to sets of data that are usually files containing information used and generated
during the execution of this experiment. This restriction refers to the correct identification of these collections. Thus, collections can only indicate sets of correct data, or rather, indicate a file that has to have its existence verified.
Inferences
Inferences allow the verification of some Roles. In our provenance model, some inferences were determined from observing some restrictions described in the pre-vious section.
The first inference is related to the structural validity of an account, which can be verified from the account structural restrictions. Once all of these structural restrictions are verified, one can infer that the account is structurally valid. Otherwise, this account can be inferred as structurally invalid. Analogously, the struc-tural validity of a project can also be inferred. Therefore, if all the accounts belonging to a project are structurally valid, then this project is also inferred as structurally valid. If it is not the case, even if only one account is structurally invalid, the project is considered structurally invalid.
The temporal inference analyzes temporal characteris-tics of the account. Thus, we can verify those related to the account start and end times. If all these restrictions are correct, the other two situations related to the activ-ity temporal restrictions must be followed. The temporal restrictions referring to Used, WasGeneratedBy and WasDerivedFromrelationships will only be possible if there is a minimum set of nodes and edges. For accounts not having a minimum set, this restriction will be automatically satisfied. Therefore, for an account to be inferred as temporally valid, the temporal restrictions of their start and end times have to be satisfied, as well as the temporal restrictions of its activities and edges. Otherwise, it is considered temporally invalid. A project,
in its turn, can be inferred as temporally valid if the restrictions related to its start and end times are satis-fied, and all the accounts that belong to this project are temporally valid. If this is not the case, the project is inferred as temporally invalid.
The functional inferences are related to the functional restrictions, thus one can infer that an experiment is functionally valid if all its collections point to sets of valid data. Otherwise, it will be inferred as functionally invalid. An experiment considered functionally invalid is not necessarily treated as an experiment containing errors, but it means that at least one of its collections points to some non-available data set. The user can choose to maintain or not some files used in an experiment and, if a file is deleted from this experiment, it will be function-ally invalid. Even though it may not be considered an error, the evaluation of the functional validity is impor-tant, since it means that this experiment cannot be re-executed due to a possible lack of necessary elements. Analogously, a project will be considered functionally valid if all of its experiments are functionally valid. If one experiment is considered functionally invalid, then the entire project is considered functionally invalid.
Related work
Some projects in the literature propose to store prove-nance data in Database Management Systems (DBMS). The DBMS was used in the proposals of Jones et al. [14], Mungall and Emmert [15] and Paula et al. [16], which created biological databases with specific modules to include provenance data. However, the DBMS table structure is inflexible to store the different types of gen-ome projects data.
Other projects use the W7 model. Marins et al. [17] present an application to find information in personal computers, and catalog them to facilitate their research. Liu and Ram [18] use provenance data to evaluate the quality of Wikipedia pages based on the ways users col-laborate. Orlandi et al. [9] present a model using pages and categories for provenance capture in Wikipedia pages to show user contribution information. The Pro-venance Vocabulary model [19] presents an application that uses provenance data on the web for evaluating the quality of available information. Omitola et al. [20] extends this model to integrate web data. Kessler et al. [21] treat provenance data in OpenStreetMap using the Provenance Vocabulary model.
Provenir Ontology [22] extends a model designed to deal with biological data in a project having the objec-tives of developing a vaccine, a diagnostic exam and a chemotherapy treatment for the Trypanossoma cruzi human pathogen. Missier and Belhajjame [23] use the Provenir Ontology model together with a module for treating biological data, addressing the data collection
generated by Taverna (one Scientific Workflow Manage-ment System - SWfMS) [24]. As an example, they dis-cuss how to search known relationships between a specific region in the mouse genome, known as QTLO (Quantitative Trait Loci), and the metabolic pathways involving genes located in this region. Patni et al. [25] present a framework to store and query provenance data in meteorological data.
OPM is the most widely used model in applications of provenance now, as can be seen by the variety of pro-jects using it. Here we discuss some of them. Cao et al. [26] present an OPM based system to capture and gen-erate provenance data in scientific experiments. Marinho et al. [27] and Coutinho et al. [28] aim at managing pro-venance information in heterogeneous and distributed environments using OPM. Chapman et al. [29] define an OPM based model to evaluate data reliability using provenance information. Braun et al. [30] evaluate the interoperability of provenance data among systems PASS (Harvard Provenance Aware Storage System) and MITRE’s PLUS. Gomes [31,32] defines an OPM based system for capturing provenance data from biological workflows using SWfMS, storing these data in a data-base modelled according to the OPM model.
As far as we know, there are no applications based on PROV-DM for bioinformatics applications, since it is a very recent model. However, it is noteworthy that Missier and Belhajjame [33] present an application of deduction rules to verify the validity of provenance graphs.
Our model was designed to store and manage prove-nance data independent of any SWfMS, e.g.,ad-hoc pro-jects. In fact, little additional information is included in the original files in order to retrieve information using specific modules directly linking biological data types in these files. Our model does not address automatic cap-ture of provenance data.
Case study
In this section, we first describe our Provenance simula-tor, and subsequently discuss one case study.
The Provenance simulator
A Provenance simulator was implemented in Java (details shown in de Paula [16]). We used two external libraries. The first one, OPM4J [6], was used to create an OPM based provenance graph. This library was used due to its stability, and to the fact that PROV-DM and OPM are very similar, and PROV-DM does not have completely developed libraries yet. The second one, GraphViz [34], was used to visualize the created prove-nance graph.
graph at any time, when a workflow is executed. The ele-ments of the XML schema correspond to the information described in Table 1, created for eachProject. Besides, a list was generated with the name and location of the XML files representing each Workflow Execution per-formed in a particularProject.
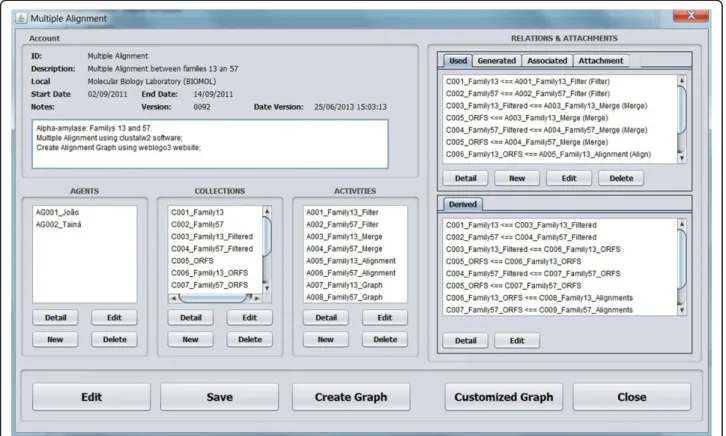
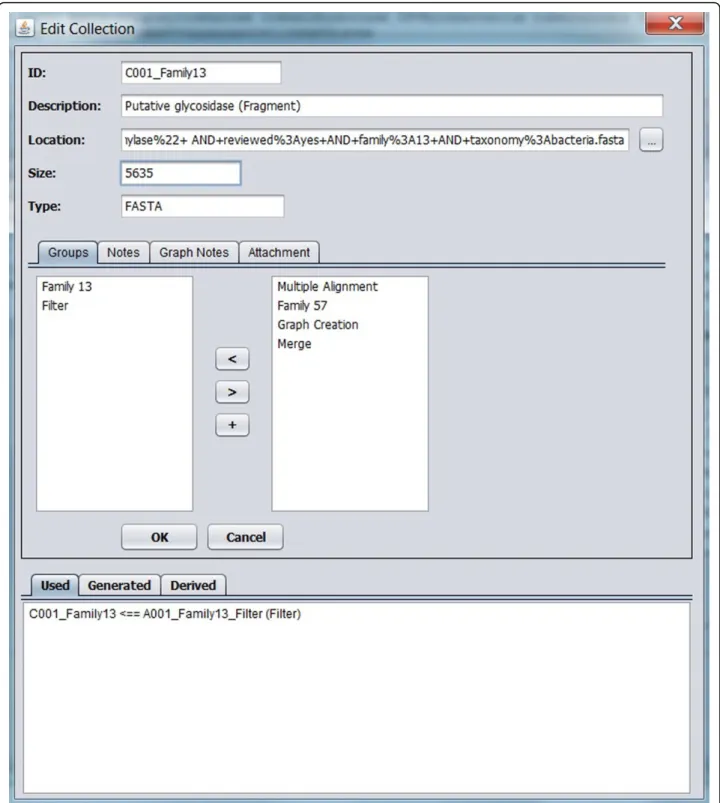
The Provenance simulator is shown in Figure 3, where the case study Multiple Alignment is displayed using information of an XML file previously stored. To use this simulator, the user needs to create a project, enter provenance data (Table 1), and inform the graph nodes (Agent, Activity andEntity) and relations linking these nodes (Figure 4). Data is stored in XML files, noting that, whenever this file is saved, the simulator modifies the file version and date, and agif format file containing the provenance graph is generated. The simulator allows to visualize the provenance graph, as shown in Figure 5.
The project: Identifying metabolic pathways of alpha-amylases in a bacterial isolate
This case study deals with the DNA sequencing of the extremophilic bacteria Bacillus cereus, of which its
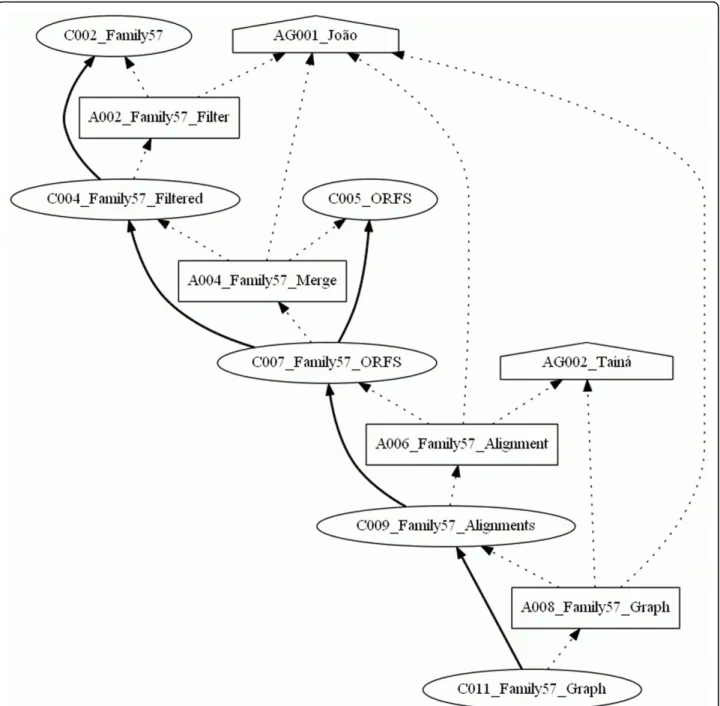
isolate was collected in warm water in a city of the Mid-West Region of Brazil. The objective of this project is to find the genes codifying for the alpha-amylase (obtained from UNIPROT [35]) in theB. cereus genome, as well as to compare their sequences with others belonging to related species in the Bacillus group. In this case study, we modeled data provenance of the comparisons among the sequences found in this isolate with genes of the related organisms. These comparisons were done using multiple alignments carried out for samples of the iso-late alpha-amylase families 13 and 57, and drawing up graphics for these alignments. This project is under development in the Molecular Biology Laboratory of the Department of Cellular Biology at the University of Bra-silia (UnB). Figure 6 shows the workflow of this experi-ment, and Figure 5 shows the provenance graph generated from one execution of the workflow.
This experiment was executed by a student of the Department of Computer Science at UnB, modeled by the agent AG001_Joao, and was validated by a researcher from the Department of Cellular Biology, represented by the agent C002_Taina. Agent AG001_Joao is associated
to all of the activities executed in this experiment, which is represented by the dotted edges between this agent and each activity on the graph. The edges represent the PROV-DMWasAssociatedWithrelation. Along with this, the role of this agent was to execute each activity, which is shown by the Execution role present at each of
Collections C0001_Family13 and C002_Family57 represent FASTA format files with the DNA sequences of families 13 and 57, respectively, of the alpha-amylases obtained from UNIPROT. Collection C0005_ORFS also represents a FASTA file of the putative proteins found on the contigs, which will comprise a part of the aligned ORFs in each family.
Initially, a filtering process was carried out, represented by activity A001_Family13_Filter, which used the original
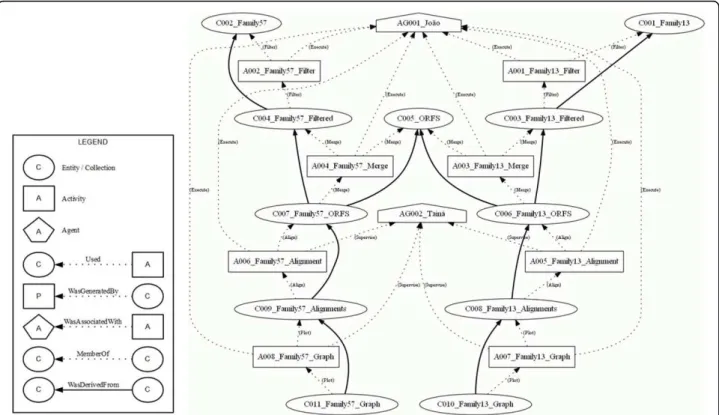
collection C001_Family13 to generate the filtered collection C003_Family13_Filtered. Next, the activity A003_Family13_Mix executed a process in order to join collections C003_Family13_Filtered and C005_ORFS, generating the collection C006_Family13_ORFS. After that, the collection C006_Family13_ORFS was used by the activity A005_Family13_Alignment with the purpose of arranging the multiple alignment of the sequences in this collection. These alignments were recorded in a file Figure 5The provenance graph generated from theBacillus cereusgenome project. One of the objectives of this genome project is to compare the sequences of an isolate of the extremophilic bacteriaBacillus cereuswith others belonging to related species in the Bacillus group. These comparisons were done using multiple alignments carried out for samples of the isolate alpha-amylase families 13 and 57, and drawing up graphics for these alignments. Data provenance of these comparisons are shown in the provenance graph executed with the workflow, composed of 2 agents, 11 collections and 8 activities linked by 40 edges.
represented by the collection C008_Family13_Alignments. Finally, the collection C010_Family13_Graph was gener-ated by the activity A007_Family13_Graph, which used the alignments contained in the collection C008_Famil-y13_Alignments. The same processing steps occurred with the collections of Family 57, which generated the collection C011_Family57_Graph.
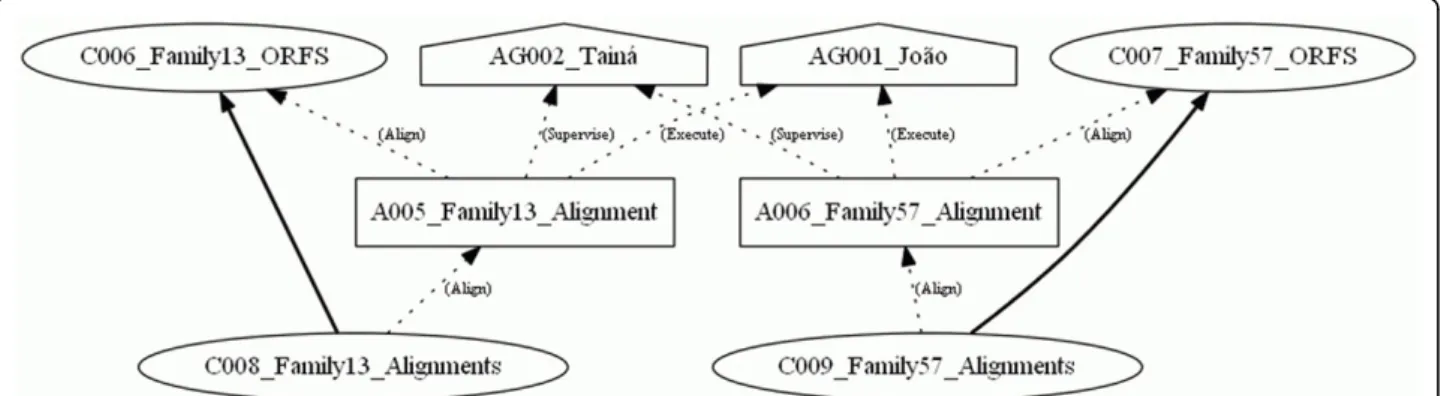
With the defined element group, it was possible to select parts of the experiments. In Figure 7, thegroup Family 57 was the only one selected, noting that the
annotations indicating the origin of some of the collec-tions and programs used for the activity execucollec-tions.
Conclusion
In this work, we propose to use the PROV-DM model to manage data provenance in genome projects. The PROV-DM model allows to store the properties of each execution of a bioinformatics workflow. To graphically represent the large volumes of data generated at the genome projects, we used Collections of Entities to represent groups of large sets of data, and the same files storing the project data to construct the Collections. The proposed provenance model was divided in two levels, one corresponding to the provenance graph itself
and the other providing access to the data of a particu-lar execution. Biologists can investigate the entire or just a portion of the provenance graph.
We also developed one case study, including prove-nance in a bioinformatics workflow with real data. This experiment shows that little additional data has to be generated in order to maintain provenance. To create the provenance graph, we only need to connect data provenance to the files already used in a particular workflow execution. This case study was developed in order to show the usability of the provenance model in a real genome project, which had the objective of find-ing alpha-amylases in an isolate of an extremophilic bacillus collected in warm water in the MidWest Figure 8The provenance graph of theMultiple Alignmentgroup androles. This graph only shows the nodes belonging to theMultiple Alignmentgroup and their respectiveroles.
Region of Brazil. We also created the Provenance simu-lator, for storing details of the workflow execution in XML files.
We are developing a module in the Provenance simu-lator to automatically capture provenance data from a workflow execution, with few information given by the user. Besides, it is useful to integrate our Provenance simulator in a bioinformatics workflow implemented using a SWfMS.
Competing interests
The authors declare that they have no competing interests.
Authors’contributions
R. P. implemented the Provenance simulator and developed the
experiments. R. P., M. H. and S. L. discussed the experiments. All the authors proposed the provenance model and contributed to the text.
Acknowledgements
M.E.M.T.W. thanks CNPq (process 306731/2009-6) and FINEP (process 01.08.0166.00).
Declaration
The publication costs for this article were funded by the University of Brasilia.
This article has been published as part ofBMC BioinformaticsVolume 14 Supplement 11, 2013: Selected articles from The Second Workshop on Data Mining of Next-Generation Sequencing in conjunction with the 2012 IEEE International Conference on Bioinformatics and Biomedicine. The full contents of the supplement are available online at http://www. biomedcentral.com/bmcbioinformatics/supplements/14/S11.
Authors’details 1
Department of Computer Science, University of Brasilia - UnB, Brasilia, Brazil. 2Department of Informatics, Pontificial Catholic University - PUC/RJ, Rio de Janeiro, Brazil.
Published: 4 November 2013
References
1. Tan WC:Research problems in data provenance.IEEE Data Engineering Bulletin2004,27:45-52.
2. Cheney J:Workshop on theory and practice of provenance event report. SIGMOD Rec2009,38:57-60.
3. Glavic B, Dittrich K:Data Provenance: A Categorization of Existing Approaches. Verlagshaus Mainz, Aachen.2007.
4. Ram S, Liu J:Active conceptual modeling of learning.InActive conceptual modeling of learning.Berlin, Heidelberg: Springer-Verlag;Chen PP, Wong LY 2007:17-29[http://portal.acm.org/citation.cfm?id=1793834.1793838]. 5. Hartig O, Zhao J:Publishing and Consuming Provenance Metadata on
the Web of Linked Data.Provenance and Annotation of Data and Processes
2010,6378(24):78-90.
6. Moreau L, Clifford B, Freire J, Futrelle J, Gil Y, Groth P, Kwasnikowska N, Miles S, Missier P, Myers J, Plale B, Simmhan Y, Stephan E, den Bussche JV: The Open Provenance Model - Core Specification (v1.1).2010 [http:// openprovenance.org/].
7. W3C:PROV-DM: The PROV Data Model.2012 [http://www.w3.org/TR/prov-dm/].
8. Aldeco-Pérez R, Moreau L:Provenance-based Auditing of Private Data Use
[http://eprints.ecs.soton.ac.uk/16580/], BCS 2008.
9. Orlandi F, Passant A, Champin PA:Semantic Representation of Provenance in Wikipedia.Second International Workshop on Role of Semantic Web in Provenance Management (SWPM 2010 - Workshop of ISWC 2010)2010, 1-6[http://liris.cnrs.fr/publis/?id=5017].
10. Buneman P, Khanna S, chiew Tan W:Why and Where: A Characterization of Data Provenance.In ICDTSpringer; 2001, 316-330.
11. Sahoo SS, Sheth A:Provenir ontology: Towards a Framework for eScience Provenance Management.Microsoft eScience Workshop2009,1.
12. Rothberg JM, Leamon JH:The development and impact of 454 sequencing.Nature Biotechnology2008,26(10):1117-1124.
13. Paula R, Holanda MT, Walter MEMT, Lifschitz S:Managing data provenance in genome project workflows .Bioinformatics and Biomedicine Workshops (BIBMW), 2012 IEEE International Conference on: 4-7 October 20122012, 654-661. 14. Jones A, Hunt E, Wastling JM, Pizarro A, Stoeckert CJ:An object model and database for functional genomics.Bioinformatics2004,20(10):1583-1590 [http://eprints.gla.ac.uk/21950/].
15. Mungall CJ, mEmert DB:A Chado case study: an ontology-based modular schema for representing genome-associated biological information. Bioinformatics2007,23(13):i337-i346[http://www.ncbi.nlm.nih.gov/pubmed/ 17646315].
16. de Paula R, Huacarpuma RC, Holanda MT, Walter MEMT:A Provenance Data Model to Manage RNA-SEQ Projects.Proceedings of 4th International Conference on Bioinformatics and Computational Biology 20122012, 165-170. 17. Marins A, Casanova MA, Furtado A, Breitman K:Modeling Provenance for
Semantic Desktop Applications.Proceedings of the XXVII Congresso da SBC - XXXIV Semin´ario Integrado de Software e Hardware2007, 2100-2012. 18. Liu J, Ram S:Who Does What: Collaboration Patterns in the Wikipedia
and Their Impact on Data Quality.Proceedings of nineteenth Annual Workshop on Information Technologies and Systems (WITS 2009)Phoenix, Arizona, USA; 2009, 1-8.
19. Hartig O, Zhao J:Using Web Data Provenance for Quality Assessment. SWPM2009, 1-6.
20. Omitola T, Gibbins N, Shadbolt N:Provenance in Linked Data Integration. Future Internet Assembly2010, 1-8[http://eprints.ecs.soton.ac.uk/21954/]. 21. Kessler C, Trame J, Kauppinen T:Tracking Editing Processes in
Volunteered Geographic Information: The Case of OpenStreetMap. Processes and Events in Spatio-Temporally Distributed Data (IOPE), workshop at Conference on Spatial Information Theory 2011 (COSIT’11)2011, 1-7[http:// www.carsten.io/iope2011.pdf].
22. Sahoo SS, Weatherly DB, Mutharaju R, Anantharam P, Sheth A, Tarleton RL: Ontology-Driven Provenance Management in eScience: An Application in Parasite Research.Proceedings of the Confederated International Conferences, CoopIS, DOA, IS, and ODBASE 2009 on On the Move to Meaningful Internet Systems: Part II, OTM‘09Berlin, Heidelberg: Springer-Verlag; 2009, 992-1009.
23. Missier P, Sahoo SS, Zhao J, Goble C, Sheth A:Janus: From workflows to Semantic Provenance and Linked Open Data.Procs IPAW 20102010, I(i):129-141.
24. Hull D, Wolstencroft K, Stevens R, Goble C, Pocock M, Li P, Oinn T:Taverna: a tool for building and running workflows of services.Nucleic Acids Res
2006,34:W729-W732.
25. Patni H, Sahoo SS, Henson C, Sheth A:Provenance Aware Linked Sensor Data.2nd Workshop on Trust and Privacy on the Social and Semantic Web, Co-located with ESWC2010, 1-12.
26. Cao B, Plale B, Subramanian G, Robertson E, Simmhan Y:Provenance Information Model of Karma Version 3.3rd international workshop on scientific workflows SWF2008,I(Vdl):348-351.
27. Marinho A, Werner C, da Cruz SMS, de Queirós Mattoso ML, Braganholo V, Murta L:A Strategy for Provenance Gathering in Distributed Scientific Workflows.Proceedings of the 2009 Congress on Services - IWashington, DC, USA: IEEE Computer Society; 2009, 344-347[http://portal.acm.org/citation. cfm?id=1590963.1591573].
28. Coutinho F, Ogasawara E, de Oliveira D, Braganholo V, Lima AAB, D´avila AMR, Mattoso M:Data parallelism in bioinformatics workflows using Hydra. Proceedings of the 19th ACM International Symposium on High Performance Distributed Computing, HPDC‘10New York, NY, USA: ACM; 2010, 507-515. 29. Chapman A, Blaustein B, Elsaesser C:Provenance-based Belief.on the
Theory and Practice of2010, 1-14.
30. Braun UJ, Seltzer MI, Chapman A, Blaustein B, Allen MD, Seligman L: Towards Query Interoperability: PASSing PLUS.TaPP2010, 1-10. 31. Gomes LSA:Provenance for bioinformatics workflows.Master’s thesis
Department of Informatics at Pontificial Catholic University, Rio de Janeiro, Brazil; 2011, [In Portuguese].
32. Gomes LA, Lifschitz S, Picouet P, Capriles PVSZ, Dardenne LE:A Provenance Model for Bioinformatics Workflows.Brazilian Symposium on Bioinformatics
33. Missier P, Belhajjame K:A PROV encoding for provenance analysis using deductive rules.Tech repNewcastle University, Computing Science, Newcastle upon Tyne, NE1 7RU, England; 2012.
34. Ellson J, Gansner ER, Koutsofios E, North SC, Woodhull G:Graphviz and dynagraph - static and dynamic graph drawing tools.GRAPH DRAWING SOFTWARESpringer-Verlag; 2003, 127-148.
35. UNIPROT:Universal Protein Resource.2012 [http://www.uniprot.org].
doi:10.1186/1471-2105-14-S11-S6
Cite this article as:de Paulaet al.:Provenance in bioinformatics
workflows.BMC Bioinformatics201314(Suppl 11):S6.
Submit your next manuscript to BioMed Central and take full advantage of:
• Convenient online submission
• Thorough peer review
• No space constraints or color figure charges
• Immediate publication on acceptance
• Inclusion in PubMed, CAS, Scopus and Google Scholar
• Research which is freely available for redistribution
![Table 1 Information of the provenance graph for a genome project (already shown in de Paula [16])](https://thumb-eu.123doks.com/thumbv2/123dok_br/16745441.746432/4.892.84.810.147.593/table-information-provenance-graph-genome-project-shown-paula.webp)