A Naturalistic Assessment
of the Organization
of Children’s Memories Predicts
Cognitive Functioning and
Reading Ability
Natália Bezerra Mota
1, Janaína Weissheimer
1,2, Beatriz Madruga
3, Nery Adamy
1,4, Silvia A. Bunge
5,
Mauro Copelli
6, and Sidarta Ribeiro
1ABSTRACT—To explore the relationship between mem-ory and early school performance, we used graph themem-ory to investigate memory reports from 76 children aged 6–8 years. he reports comprised autobiographical memories of events days to years past, and memories of novel images reported immediately after encoding. We also measured intelligence quotient (IQ) and theory of mind (ToM). Reading and Mathematics were assessed before classes began (Decem-ber 2013), around the time of report collection (June 2014), and at the end of the academic year (December 2014). IQ and ToM correlated positively with word diversity and word-to-word connectivity, and negatively with word recur-rence. Connectivity correlated positively with Reading in June 2014 as well as December 2014, even after adjusting for IQ and ToM. To our knowledge, this is the first study demon-strating a link between the structure of children’s memories and their cognitive or academic performance.
1Brain Institute, Federal University of Rio Grande do Norte (UFRN) 2Department of Modern Foreign Languages and Literature, Federal
University of Rio Grande do Norte (UFRN)
3Department of Psychology, Federal University of Rio Grande do Norte
(UFRN)
4Department of Pedagogy and Physiotherapy, Faculdade Maurício de
Nassau
5Department of Psychology & Helen Wills Neuroscience Institute,
University of California
6Department of Physics, Federal University of Pernambuco (UFPE)
Address correspondence to Sidarta Ribeiro, Brain Institute, Federal University of Rio Grande do Norte (UFRN), Natal, RN, Brazil; e-mail [email protected]
When children begin formal schooling, they are faced with the challenges of learning to read, write, and perform basic mathematical calculations, among others. To achieve these milestones, children must be able to attend to relevant infor-mation, keep it in mind, organize and flexibly update it, and recall it at a later time. hese cognitive skills improve dramatically over the elementary school years, as measured by carefully controlled laboratory tests. At the same time, there are important individual differences in performance on these cognitive tests, and there is ample evidence that interindividual variability in working memory and cognitive control helps to explain differences in academic achievement among children (Alloway & Passolunghi, 2011; Titz & Kar-bach, 2014).
paradigms are tightly controlled, they are rather artificial and do not approach the complexity of memory processes in the real world. Here, we sought to probe the relationship between episodic memory and academic achievement in a more naturalistic context, asking children to report on their own memories. To this end, we sought to use new quantifi-cation methods applied to unstructured, spontaneous, freely produced speech.
he way people report their memories reflects sponta-neous associations, and indirectly reveals the underlying thought process. Recently, computational approaches based on graph theory have succeeded in using structural features of memory reports to quantify pathological cognitive deficits (Bertola et al., 2014; Mota, Furtado, Maia, Copelli, & Ribeiro, 2014; Mota et al., 2012). A memory report can be accurately represented by a graph in which the words are represented by nodes, and the temporal links between consecutive words are represented by edges. As described in Table 1, it is pos-sible to calculate general attributes of graphs (such as the number of nodes and edges or links), to examine the relation-ship between those elements by studying recurrence mea-sures (how repetitions of links between nodes and cycles of nodes appear on the graphs), and to study the overall con-nectivity between nodes (counting the number of nodes that are connected), as well as to describe the global features that characterize the structure of graphs as a whole (such as the degree of clustering and the average shortest path between nodes; Bollobas, 1998).
Such speech graphs have recently been used to reveal cognitive deficits in pathological populations comprising patients suffering from psychosis (Mota et al., 2012, 2014) or dementia (Bertola et al., 2014). In particular, we have found that dream reports from psychotic patients were less connected than similar reports from controls. Furthermore, connectivity measurements were negatively correlated with cognitive and negative symptoms, denoting that the more isolated and cognitively impaired the subject is, the less connected the corresponding dream reports (Mota et al., 2014). In the case of dementia, the graph-theoretical anal-ysis of the verbal fluency test led to good sorting between patients with Alzheimer’s disease and mild cognitive deficits (Bertola et al., 2014). Cognitive impairment was accompa-nied by increased graph density, decreased diameter, and smaller average shortest path.
Graph measurements have yet to be employed to investi-gate the normal development of memory reports produced by a healthy population. As a first step in this direction, we set out to quantify the relationship between the structure of spontaneous memory reports, and measurements of general intelligence, theory of mind (ToM), and school achievement. he longitudinal design of this study allowed us to inves-tigate whether these structural properties can predict aca-demic performance over time. he first acaaca-demic assessment
was performed on December 2013, before the students were exposed to Reading and Math classes, which began on March 2014. Two subsequent measurements were performed on June 2014 and December 2014, allowing for the investiga-tion of both cross-secinvestiga-tional and longitudinal relainvestiga-tionships between graph measurements and academic achievement during the first year of alphabetization.
In order to characterize the mechanism behind the possible relationship between declarative memory reports and cognitive performance, we separated the reports into those taxing short-term memory (STM), with a few sec-onds between the encoding and recall of novel images; and those taxing long-term memory (LTM), with days to years between the encoding and recall of autobiographical events. Based on previous studies of memory organization in adult psychotic patients (Mota et al., 2012, 2014), we hypothe-sized that three connectivity-related graph attributes that decrease in association with cognitive decline in these sub-jects (edges, LCC, and LSC; see Methods section) would increase in the case of typical developmental improvement in alphabetization. As this is a first exploratory graph-based study of memory reports in healthy children, we also tested whether other 11 graph attributes are relevant.
METHODS
Participants
A total of 76 children (40 males and 36 females, aged 6–8 years, 7.29±0.58, mean±SD) participated in this study. hese children were recruited from six public schools in Natal, Brazil. he children came from families with low lev-els of educational attainment (parents’ years of education 8.76±3.90) and low socioeconomic status (family income R$ 1,133.58±431.21; mean±SD; average national wage R$ 1,855.00; Wages, Ministry of Planning, Budget and Manage-ment, Brazil, 2014). he study was approved by the Ethics on Research Committee of the Federal University of Rio Grande do Norte (UFRN) (permit no. 742.116), and the data were collected during regular class hours within the school setting, with each child individually in a classroom assigned exclusively for this purpose. Written informed con-sent was obtained on behalf of all the children from their legal guardians at a meeting between experimenters, legal guardians, and teachers.
Protocol
Table 1
Mathematical Definition and Psychological Interpretation of Speech Graph Attributes (SGA)
SGA Mathematical definition Psychological interpretation
N (nodes) Number of nodes Number of different words, measures lexical diversity
E (edges) Number of edges Number of links between words RE (repeated edges) Sum of all edges linking the same pair of
nodes
Number of links between two words; measures recurrence
PE (parallel edges) Sum of all parallel edges linking the same pair of nodes given that the source node of an edge is the target node of the parallel edge
Number of links between two words with opposite directions; measures recurrence
L1 (loop of one node) Sum of all edges linking a node with itself, calculated as the trace of the adjacency matrix
Numbers of repetitions of the same word in sequence; measures recurrence
L2 (loop of two nodes) Sum of all loops containing two nodes, calculated by the trace of the squared adjacency matrix divided by two
Number of sequences of two different words; measures recurrence
L3 (loop of three nodes) Sum of all loops containing three nodes (triangles), calculated by the trace of the cubed adjacency matrix divided by three
Number of sequences of three different words; measures recurrence
LCC (largest connected component)
Number of nodes in the maximal subgraph in which all pairs of nodes are reachable from one another in the underlying undirected subgraph
Number of different words in the largest component in which all the words are connected by a path of edges; measures how well connected the words of the report are
LSC (largest strongly connected component)
Number of nodes in the maximal subgraph in which all pairs of nodes are reachable from one another in the directed subgraph (node a reaches node b, and b reaches a)
Number of different words in the largest component in which all the words are mutually connected by a path of edges; measures how well connected the words of the report are
ATD (average total degree) Given a noden, the total degree is the sum of “in and out” edges. Average total degree is the sum of total degree of all nodes divided by the number of nodes
Given the wordX, total degree is how many links this word has with any other words in the report. ATD is the average total degree of all words in the report
Density Number of edges divided by possible edges (D=2×E/N×(N−1)), whereE is the number of edges andNis the number of nodes
Number of direct word links divided by all the possible word links (using all the different words in the report)
Diameter Length of the longest shortest path between the node pairs of a network
Length (in words) of the path linking the most distant pair of words in the report
ASP (average shortest path) Average length of the shortest path between pairs of nodes of a network
Average of all the shortest paths between every pair of words in the report.
CC (average clustering coefficient)
Given a noden, the clustering coefficient map (CCMap) is the set of fractions of allnneighbors that are also neighbors of each other. Average CC is the sum of the clustering coefficients of all nodes in the CCMap divided by number of elements in the CCMap
and then collecting declarative memory reports compris-ing long-term autobiographical memories—LTM (based on events occurring in the preceding days to years) and STM reports (based on events occurring immediately before-hand). he interview began with questions regarding the for-mer (LTM): “Please, tell me your oldest memory. When did it happen? How old were you?” and then: “Please, tell me how was your day yesterday,” then: “Please, tell me a dream you had. When did it happen?” and finally: “Please, tell me the events on the day before that dream.” Next we asked questions to assess STM reports. We showed three affective images (one positive, one negative, and one neutral) from the International Affective Picture System (IAPS) database validated in children (Lang, Greenwald, Bradley, & Hamm, 1993). After seeing each image for 15 s, the computer screen used for the presentation was turned off, and the children were asked to report a narrative regarding what was happen-ing in that image. All reports were limited to a maximum of 30 s.
After collecting these memory reports, we applied stan-dard ToM tests called the Sally–Anne task (Baron-Cohen, Leslie, & Frith, 1985) and three cartoons of the picture sequence test (PST; Baron-Cohen, Leslie, & Frith, 1986), comprising a total of four tests of ToM abilities. On the Sally–Anne test, the experimenter (NBM) used a computer screen to show a story to the subject, and in the end she asked a question to probe whether the subject differentiates his/her own beliefs from the character’s beliefs (Baron-Cohen et al., 1985). On PST, the experimenter asked the child to organize a cartoon story in the correct sequence, and then report the resulting story within 30 s. As in the Sally–Anne test, under-standing of the correct picture sequence requires that the subject understands that his own beliefs are different from the character’s beliefs (Baron-Cohen et al., 1986). In addi-tion, the PST provided another three STM reports.
We scored each of the four answers on the Sally–Anne test as correct or incorrect, and entered an accuracy score of 0%, 25%, 50%, 75%, or 100% for each participant. On a sub-sequent visit, 2–8 weeks later, we administered the RAVEN Progressive Matrices test (Angelini, Alves, Custódio, Duarte, & Duarte, 1999; Raven, 1936) to collect intelligence quotient (IQ) data, scored for each child as the percentile corrected by age. Memory reports, ToM, and RAVEN measurements were sampled during August and September 2014 (right after school vacations). Finally, we assessed the students’ scores on the standard national Brazilian test on Math and Reading, called Provinha Brasil, which is the official academic evaluation applied by the Ministry of Education throughout the entire country. Each test is composed of 20 multiple-choice questions. he Reading test assessed knowledge of grapheme–phoneme correspondence and text comprehension, whereas the Math test presented questions about absolute quantities, basic arithmetic operations,
and recognition of geometrical shapes. he academic tests were administered during three different periods: December 2013, right before the beginning of the school year; June 2014, right before school vacations; and December 2014.
Graph Analysis
he memory reports were fully transcribed to a text file that included all the words spoken by the subject within the 30-s limit. Whenever the child stopped the report short of the limit, the interviewer prompted the subject to talk more. In these cases, the ensuing words spoken by the subject were transcribed on another line of the text. Declarative mem-ory reports comprised a concatenation of all the memmem-ory reports (“oldest memory,” “memory from yesterday,” “mem-ory of a dream,” “mem“mem-ory from the day before the dream,” IAPS pictures and PST). For STM reports, we concatenated the IAPS pictures and PST reports. For LTM reports, we concatenated the answers for the questions regarding “oldest memory,” “memory from yesterday,” “memory of a dream,” and “memory from the day before the dream.” he con-catenated text files were represented as graphs using the free softwareSpeechGraphs (Mota et al., 2014; available at http://neuro.ufrn.br/softwares/speechgraphs).
In summary, for LTM we used the answers to the following four questions, concatenated into one text file:
1. “Please, tell me your oldest memory”; 2. “Please, tell me how was your day yesterday”; 3. “Please, tell me a dream you had”;
4. “Please, tell me the events on the day before that dream.”
For STM we used the following six reports concatenated as one text file:
1. Description of three affective images from IAPS database (one negative, one positive, and one neutral image); 2. Description of three cartoon stories, each made of four
pictures.
For declarative memory, we combined all the reports (4 LTM+6 STM) as one text file.
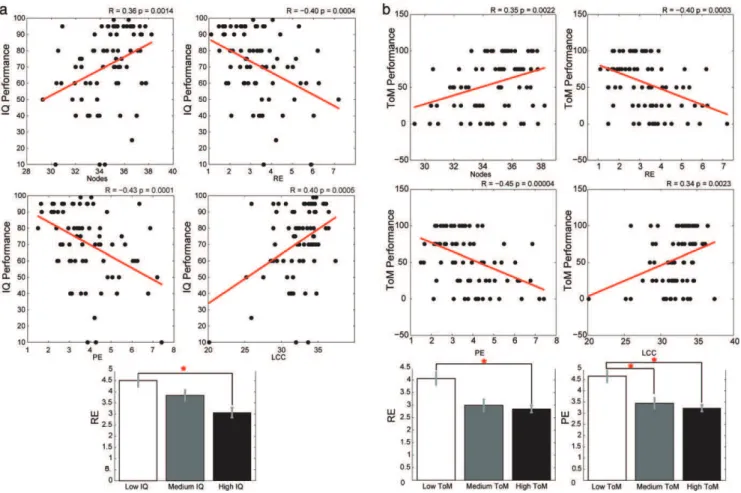
Fig. 2. Similar correlations between intelligence quotient (IQ) and theory of mind (ToM) performances and graph attributes (medium-sized graphs 50 words) from declarative memory. (a) Correlations between IQ performance and nodes, repeated edges (RE), parallel edges (PE), and largest connected component (LCC;Randpvalues indicated). Tertile comparison between low, medium, and high IQ performance groups (RE: high<low IQ,p=.0002). (b) Correlations between ToM performance and nodes, RE, PE, and LCC (R
andpvalues indicated). Tertile comparison between low, medium, and high IQ performance groups (RE: high<low ToM,p=.0009; PE:
high<low ToM,p=.0002, medium<low IQ,p=.0016).
graph component (Figure 1). A total of 14 speech graph attributes were calculated for each text file, comprising gen-eral graph attributes related to the number of elements as nodes and edges (N=nodes and E=edges), recurrence mea-sures that count repetitions of links between nodes and cycles of nodes presented on the graphs (PE=parallel edges, RE=repeated edges, L1, L2, and L3=loops of one, two, and three nodes), connectivity measures to count the number of nodes that are connected by some path of edges regardless of directionality (LCC=largest connected component and LSC=largest strongly connected component) and global attributes to quantify topological features that characterize complex graphs (ATD=average total degree, density, diame-ter, ASP=average shortest path, CC=clustering coefficient; for detailed information about graph attributes, see Figure 1 and Table 1).
A moving window analysis of graph attributes was per-formed using windows with length of 50 words and 90%
overlap from one window to the next, which means that for the first 50 words we generated a graph, then jumped five words to again count 50 words and thus generate the next graph, and so on. he average graph attributes of all graphs of 50 words for each text file were calculated and used for statistical analysis. Illustrative examples of isolated memory reports from two subjects (one with high cognitive perfor-mance and one with low cognitive perforperfor-mance) are shown in Figure 1b.
Statistical Analysis
Table 2
Statistical Analysis: Cognitive Performances and Graph Attributes From Declarative Memories
Speech graphs Pearson correlation t-Test
Cognitive test Attributes (SGA) R p-Value Comparison p-Value
IQ N 0.36 .0014 — >.0042
RE −0.40 .0004 Low×high .0002
PE −0.43 .0001 — >.0042
LCC 0.40 .0005 — >.0042
ToM N 0.35 .0022 — >.0042
RE −0.40 .0003 Low×high .0009
PE −0.45 .0000 Low×medium .0016
Low×high .0002
LCC 0.34 .0023 — >.0042
Reading June 2014 LCC 0.33 .0041 — >.0042
LSC 0.37 .0012 — >.0042
Reading November 2014 LSC 0.35 .0023 — >.0042
IQ=intelligence quotient; LCC=largest connected component; LSC=largest strongly connected component; N=nodes; PE=parallel edges; RE=repeated edges; SGA=speech graph attributes; ToM=theory of mind.
compared graph attributes across tertiles using Student’s
t-test. Correction for multiple comparisons using the Bon-ferroni method included three different memory reports types (declarative, STM, and LTM) and four cognitive assess-ments (IQ, ToM, Reading, and Math), totaling 12 compar-isons (corrected α =0.0042). Multiple linear regressions of Reading with IQ, ToM, LCC, and LSC were calculated using the MATLAB function<regress>.
RESULTS
When we analyzed the entire set of declarative memory reports, we found significant positive correlations between cognitive performance (IQ and ToM performance) and nodes (IQ:R=0.36,p=.0014; ToM:R=0.35,p=.0022) and LCC (IQ:R=0.40,p=.0005; ToM:R=0.34,p=.0023). We also found negative correlations with RE (IQ: R= −0.40,
p=.0004, high<low IQ, p=.0002; ToM, R= −0.40,
p=.0003, high<low ToM,p=.0009) and PE (IQ:R= −0.43,
p=.0001; ToM: R= −0.45, p=.0000, medium<low ToM,
p=.0016, high<low ToM,p=.0002; Figure 2, Tables 2 and
S1). In summary, children who reported their declarative memories with a larger number of different words, and with more connections among them and fewer repetitions of word–word associations performed better on IQ and ToM tests. As expected, IQ and ToM were positively correlated (R=0.48,p<.0001).
To determine whether the correlation between verbal reports and ToM performance was because of the pres-ence of PST reports (the ToM task) in the text file, we also performed the correlations using either graphs from all the memory reports except PST, or graphs made exclu-sively from PST reports. Notably, there were significant
correlations between verbal reports and ToM performance even when excluding those derived from the PST (Table S2). hus, the relationship holds for several kinds of memory reports.
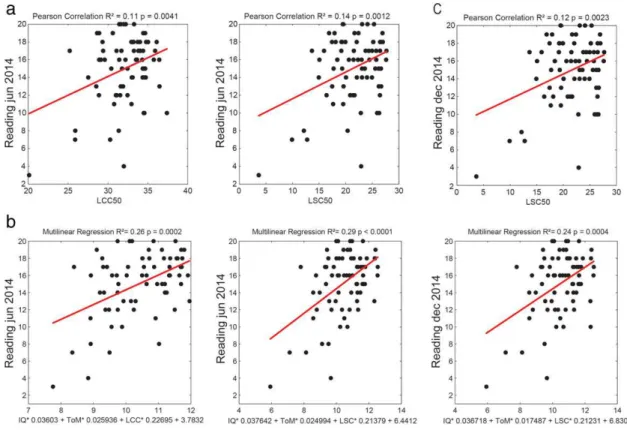
Regarding school achievement, we found significant pos-itive correlations between Reading performance and LCC (R=0.33,p=.0041) and LSC (R=0.37,p=.0012) on the sec-ond test (June 2014). Notably, LSC predicted Reading perfor-mance 3–4 months later (R=0.35,p=.0023, third time point on December 2014; Figure 3, Tables 2 and S1). We calcu-lated score differences between December 2013/June 2014, December 2013/December 2014, and June 2014/December 2014 to estimate gains, but found no significant correlations between speech graph attributes and gains on either Read-ing or Math performance (allp≥.021, correctedα =0.0042). In general, the correlations with different cognitive perfor-mances were preserved when performing graph analyses using windows of different word lengths (small graphs of 10 words and large graphs of 100 words; Table S1). hus, LCC was concurrently related to Reading performance, and LSC was both concurrently and longitudinally related to Reading performance.
To assess how much of the Reading performance could be jointly predicted by cognitive and graph measures, we assessed multiple linear regressions of Reading with a linear combination of IQ, ToM, and connectivity-related graph attributes (Figure 3b). Explained variance ranged from R2=0.09 (p=.0151) in December 2013 to R2=0.26 (p<.0001) in June 2014 andR2=0.21(p<.0001) in
Decem-ber 2014.
Fig. 3. School achievement and declarative memory graphs (medium-sized graphs, 50 words). (A) Correlations between connectivity graph attributes (largest connected component [LCC] and largest strongly connected component [LSC]) and Reading performance on June (second test) and December 2014 (third test;R2 andpvalues indicated). (B) Multiple linear regressions of Reading with IQ, ToM, LCC, and LSC. Combination of these attributes on thexaxis. Reading scores for each time point on theyaxis.
and Table 3, we found that graph connectivity (LCC, LSC) was correlated with Reading even after adjusting for IQ and ToM. Conversely, IQ and ToM were correlated with Read-ing even after adjustRead-ing for graph connectivity. However, the correlation between ToM and Reading did not reach signif-icance when adjusted for IQ, and the correlation between Reading and IQ did not reach significance when adjusted for ToM (Figure 4, Table 3).
When we distinguished between LTM and STM reports, we found that STM correlations were stronger than LTM correlations, but that in most cases their combination yielded even stronger correlations than STM alone. A comparison of Tables S1 (declarative=STM+LTM) and S3 (STM vs. LTM) shows that the former displays overall higherRvalues and lowerpvalues—that is the sum of STM and LTM is more informative than STM alone. IQ and ToM were positively correlated with Nodes, and the same two measurements were negatively correlated with RE as well as PE (Tables 4 and S3). In addition, there were significant negative correlations between IQ performance and L3 and between IQ and CC (Tables 4 and S3). hus, children with higher IQ scores reported memories with less recurrence (loops of three nodes), and with less graph clustering. Although graph attributes from memory reports correlate
significantly with IQ and ToM, altogether the results show that the correlation of Reading with graph attributes cannot be reduced to the correlations of Reading with either IQ or ToM.
DISCUSSION
he results indicate that the children with better IQ, ToM, and Reading performance report memory events with a richer word repertoire (more nodes), more connections among them (larger LCC and LSC), fewer repetitions of the same associations (less RE and PE), overall reflecting richer and more complex contents, in comparison with the chil-dren with medium or lower performance. Graph connectiv-ity correlated positively with Reading in June 2014 as well as in December 2014. IQ and ToM were also correlated with Reading but did not mediate the correlations between graph connectivity and Reading, because these persisted even after adjustment for IQ or ToM. herefore, graph connectivity provides additional explanatory and predictive power over IQ and ToM.
Fig. 4. Diagram illustrating the significant and nonsignificant adjusted correlations of Reading with graph connectivity, intelligence quotient (IQ) or theory of mind (ToM). (a) Largest connected component (LCC) and (b) largest strongly connected component (LSC). Note that connectivity attributes correlate significantly with Reading even after adjusting for IQ or ToM (Table 3).
reflects a greater variety of things and concepts remembered, stemming from more elaborate semantic memory. A richer word repertoire can thus be understood as a greater capac-ity to store and retrieve mnemonic associations, especially considering that these nodes are also more connected to the other nodes of the graph. his could imply a better strategy for memory retrieval, and/or a more adaptive response to new rules of the environment, leading to better cognitive performance (Blakemore & Bunge, 2012; Sander et al., 2012). More nodes may also reflect a larger vocabulary; indeed, this result replicates a known relationship between vocabulary and nonverbal IQ (Rice & Hoffman, 2015) as well as ToM (Milligan, Astington, & Dack, 2007). Of note, an important limitation of this study was the lack of assessment of general linguistic abilities.
he children with better IQ, ToM, and school perfor-mance not only have a richer word repertoire but also showed more connections between words, keeping distant parts of the verbal report connected by the reoccurrence of certain words. In order to be meaningful, a report rich in new information needs to have solid links among all the events reported. In a previous study with a psychotic population, the same connectivity attributes (LCC and LSC) were found to be smaller in the memory reports of psychotic patients than in the reports of controls. Importantly, these measure-ments were negatively correlated with negative symptoms (such as poor eye contact, emotional retraction, and social isolation) and cognitive deficits (difficulty of understand-ing abstract meanunderstand-ings; Mota et al., 2014). hese results sug-gest that our spontaneous capacity for reporting memories with strong connections among events/elements is related to our general cognitive capacity to interact with the external world, so that this memory ability runs together with general cognitive improvement, increasing with healthy cognitive
development and declining with psychopathological cogni-tive deficits.
In addition, the children with higher IQ, ToM, and school performance also showed less word recurrence. When a report includes a large enough vocabulary, and the speaker is able to make a linear trajectory comprising different mem-ory events/elements, repetition of the same word association is not necessary. Patients suffering from Alzheimer’s disease tend to make more loops of three nodes (L3) than control subjects when performing the verbal fluency test (which asks subjects to name as many different animals as possible within 1 min; Bertola et al., 2014). In other words, the patients repeat the same animal name after two different names, which reflect a working memory deficit. It is thus conceiv-able that less recurrence reflects a more developed work-ing memory. Impaired workwork-ing memory leads to impaired cognitive development (Alloway, Gathercole, et al., 2009; Alloway, Rajendran, & Archibald, 2009), and reduced school achievement even in children without cognitive impair-ments (Alloway & Alloway, 2010; Alloway & Passolunghi, 2011). Consistent with this hypothesis, analysis of STM reports revealed significant negative correlations between cognitive measures (IQ or ToM) and recurrence-related graph attributes (RE, PE), thus strengthening the notion that the development of working memory contributes to the cog-nitive and academic results.
Table 3
Correlation With Reading Performance. Results Adjusted for Cognitive Performance or SGA. Statistically Significant Differences Are Shown in Boldface
Reading June 2014 Reading December 2014
Adjusted by R p-Value R p-Value
No adjustment LCC 0.33 .0041 0.32 .0056
LSC 0.37 .0012 0.35 .0023
ToM 0.42 .0002 0.34 .0029
IQ 0.41 .0003 0.37 .0016
IQ LCC 0.36 .0023 0.35 .0034
LSC 0.38 .0011 0.37 .0018
ToM 0.28 .0171 0.20 .0981
ToM LCC 0.35 .0026 0.34 .0037
LSC 0.39 .0007 0.36 .0020
IQ 0.25 .0381 −0.02 .8977
LCC ToM 0.42 .0002 0.34 .0041
IQ 0.40 .0005 0.36 .0021
LSC ToM 0.43 .0002 0.34 .0038
IQ 0.40 .0005 0.36 .0019
IQ=intelligence quotient; LCC=largest connected component; LSC=largest strongly connected component; SGA=speech graph attributes; ToM=theory of mind.
Table 4
Statistical Results Comparing STM Graph Attributes With Different Cognitive Performances
Speech graphs Pearson correlation t-Test
Cognitive test Attributes (SGA) R p-Value Comparison p-Value
IQ N 0.40 .0004 Low×High .0032
RE −0.40 .0004 Low×High .0029
PE −0.43 .0001 Low×High .0019
L3 −0.34 .0026 Low×High .0025
LCC 0.36 .0018 — >.0042
CC −0.37 .0012 Low×High .0007
ToM N 0.37 .0010 Low×High .0029
RE −0.34 .0024 — >.0042
PE −0.40 .0004 Low×High .0018
Reading June 2014 LSC 0.34 .0031 — >.0042
CC=average clustering coefficient; IQ=intelligence quotient; L3=loop of three nodes; LCC=largest connected component; LSC=largest strongly connected component; N=nodes; PE=parallel edges; RE=repeated edges; SGA=speech graph attributes; ToM=theory of mind
or years. herefore, STM and LTM reports engage differ-ent memory mechanisms: STM reflects short-term memo-ries of novel images retrieved immediately after encoding, while LTM depends on the recall of consolidated memory traces related to first-person events. he results show that the graph attributes correlated with cognition are mostly those extracted from STM reports, not LTM reports. his indicates that the correlations between declarative mem-ory attributes and cognitive performance are likely driven by STM.
Individual differences in the ability to retrieve episodic memories are large, reflecting differences in the devel-opment and maturation of brain networks required for episodic memory processing and executive functions (Bunge & Wright, 2007; Ghetti & Bunge, 2012; Ghetti,
are based on artificially designed laboratory tests aimed at isolating independent cognitive components.
Surprisingly, we did not find significant correlations between speech structure and future gains in Reading or Math. his is likely related to the different temporal nature of the variables assessed, because speech structure was measured only once, while academic gains were calculated as the difference of Reading or Math scores sampled at differ-ent time points. Alternatively, it is possible that the sample size was too small to reach significance when multiple factors were considered. A replication of our study using different instruments for cognitive assessment is in order to better understand the possible mediators of the relationship between speech structure and academic performance.
Our exploratory study indicates that the graph analysis of naturalistic memory reports generated by healthy children in the school setting allows for an objective quantification of memory development. To our knowledge, this is the first study demonstrating that the structure of children’s memory reports is linked to key psychological measures of cognition and to formal academic achievement. hese results provide a proof of concept that objective speech analysis could be a useful tool in schooling and clinical settings. Follow-up studies should attempt to replicate the present results in a larger sample, with a small number of preregistered anal-yses. In future, a better understanding of the relationship between graphs from spontaneous memory reports and dif-ferent memory components could lead to the development of a quick, objective screening tool for assessing cognitive functioning in children.
Acknowledgments—Work supported by Conselho Nacional
de Desenvolvimento Científico e Tecnológico (CNPq), grants Universal 480053/2013-8, and Research Productivity 306604/2012-4 and 310712/2014-9; Coordenação de Aper-feiçoamento de Pessoal de Nível Superior (CAPES) Projeto ACERTA; Fundação de Amparo à Ciência e Tecnologia do Estado de Pernambuco (FACEPE); FAPESP Center for Neuromathematics (Grant number 2013/07699-0, S. Paulo Research Foundation FAPESP); and UFRN. We thank the Public Schools that allowed us access to the children and to the school environment, and also helped the relationship with the families; the Latin American School for Education, Cognitive and Neural Sciences for fostering a rich intellec-tual environment where our ideas could develop; Elizabeth Spelke, Mitchell Nathan, and Nora Newcombe for helping to design and interpret the experiment; two anonymous reviewers for insightful comments on the manuscript; the participants of project ACERTA for help during data collection; hiago Rivero for help with the choice of ToM assessment; Debora Koshiyama for bibliographic support; Pedro PC. Maia, Gabriel M. da Silva, and Jaime Cirne for
IT support. his article is dedicated to the memory of Raimundo Furtado Neto (1973–2016).
SUPPORTING INFORMATION
Additional supporting information may be found in the online version of this article:
Table S1. Similar results were obtained using different graph sizes. he table shows R and P values of the Pear-son correlation between Speech Graph Attributes using small (10 words), medium (50 words) and large (100 words) graphs. Significant correlations indicated in red.
Table S2. Pearson correlations between Speech Graph Attributes and ToM performance using all declarative mem-ory reports except PST versus only PST reports. Attributes that show correlations with ToM using all declarative mem-ory reports are shown in boldface; statistically significant dif-ferences are shown in red.
Table S3. Pearson correlation (R and P values) between Speech Graph Attributes and cognitive performance using short-term memory (STM) or long-term memory (LTM) reports. Red indicates statistically significant correlations.
REFERENCES
Alloway, T. P., & Alloway, R. G. (2010). Investigating the predic-tive roles of working memory and IQ in academic attain-ment.Journal of Experimental Child Psychology,106, 20–29. doi:10.1016/j.jecp.2009.11.003
Alloway, T. P., Gathercole, S. E., Kirkwood, H., & Elliott, J. (2009). he cognitive and behavioral characteristics of children with low working memory. Child Development, 80, 606–621. doi:10.1111/j.1467-8624.2009.01282.x
Alloway, T. P., & Passolunghi, D. (2011). he relationship between working memory, IQ, and mathematical skills in chil-dren. Learning and Individual Differences, 21, 133–137. doi:10.1016/j.lindif.2010.09.013
Alloway, T. P., Rajendran, G., & Archibald, L. M. (2009). Working memory in children with developmental dis-orders. Journal of Learning Disabilities, 42, 372–382. doi:10.1177/0022219409335214
Angelini, A. L., Alves, I. C. B., Custódio, E. M., Duarte, W. F., & Duarte, J. L. M. (1999).Matrizes Progressivas Coloridas de
Raven: Escala Especial. Manual. São Paulo, Brazil: CETEPP.
Baron-Cohen, S., Leslie, A. M., & Frith, U. (1985). Does the autis-tic child have a “theory of mind”? Cognition, 21, 37–46. doi:10.1016/0010-0277(85)90022-8
Baron-Cohen, S., Leslie, A. M., & Frith, U. (1986). Mechanical, behavioural and intentional understanding of picture stories in autistic children.British Journal of Developmental Psychology, 4, 113–125.
normal elderly controls. Frontiers in Aging Neuroscience, 6(185). doi:10.3389/fnagi.2014.00185
Blakemore, S. J., & Bunge, S. A. (2012). At the nexus of neu-roscience and education. Developmental Cognitive
Neuro-science,2(Suppl. 1), S1–S5. doi:10.1016/j.dcn.2012.01.001
Bollobas, B. (1998). Modern graph theory. Berlin, Germany: Springer-Verlag.
Börner, K., Sanyal, S., & Vespignani, A. (2007). Network science. In B. Cronin (Ed.),Information today(pp. 537–607). Medford, OR: ARIST.
Bruer, J. T. (1997). Education and the brain: A bridge too far.
Educational Researcher,26(8), 4–16.
Bunge, S. A., & Wright, S. B. (2007). Neurodevelopmental changes in working memory and cognitive control.Current Opinion in
Neurobiology,17, 243–250. doi:10.1016/j.conb.2007.02.005
Ghetti, S., & Bunge, S. A. (2012). Neural changes underlying the development of episodic memory during middle child-hood. Developmental Cognitive Neuroscience, 2, 381–395. doi:10.1016/j.dcn.2012.05.002
Ghetti, S., DeMaster, D. M., Yonelinas, A. P., & Bunge, S. A. (2010). Developmental differences in medial temporal lobe function during memory encoding.Journal of Neuroscience, 30, 9548–9556. doi:10.1523/JNEUROSCI.3500-09.2010 Harel, B. T., Pietrzak, R. H., Snyder, P. J., homas, E., Mayes,
L. C., & Maruff, P. (2014). he development of associate learning in school age children. PLoS One, 9(7), e101750. doi:10.1371/journal.pone.0101750
Johnson, E. L., Miller Singley, A. T., Peckham, A. D., Johnson, S. L., & Bunge, S. A. (2014). Task-evoked pupillometry provides a window into the development of short-term memory capacity.
Frontiers in Psychology,5, 218. doi:10.3389/fpsyg.2014.00218
Lang, P. J., Greenwald, M. K., Bradley, M. M., & Hamm, A. O. (1993). Looking at pictures: Affective, facial, visceral, and behavioral reactions.Psychophysiology,30, 261–273.
Milligan, K., Astington, J. W., & Dack, L. A. (2007). Lan-guage and theory of mind: Meta-analysis of the relation between language ability and false-belief
understand-ing. Child Development, 78, 622–646. doi:10.1111/
j.1467-8624.2007.01018.x
Mota, N. B., Furtado, R., Maia, P. P., Copelli, M., & Ribeiro, S. (2014). Graph analysis of dream reports is especially informative
about psychosis. Scientific Reports, 4, 3691. doi:10.1038/ srep03691
Mota, N. B., Vasconcelos, N. A., Lemos, N., Pieretti, A. C., Kinouchi, O., Cecchi, G. A.,…Ribeiro, S. (2012). Speech graphs provide a quantitative measure of thought disorder in psychosis.PLoS One,7(4), e34928. doi:10.1371/journal.pone.0034928 Paz-Alonso, P. M., Bunge, S. A., Anderson, M. C., & Ghetti,
S. (2013). Strength of coupling within a mnemonic control network differentiates those who can and cannot suppress memory retrieval. Journal of Neuroscience, 33, 5017–5026. doi:10.1523/JNEUROSCI.3459-12.2013
Raven, J. C. (1936). Mental tests used in genetic studies: he performance of related individuals on tests mainly educa-tive and mainly reproduceduca-tive (MSc thesis). University of London, London, UK.
Rice, M. L., & Hoffman, L. (2015). Predicting vocabulary growth in children with and without specific language impairment: A longitudinal study from 1∕2 to 21 years of age. Journal
of Speech, Language, and Hearing Research, 58, 345–359.
doi:10.1044/2015_JSLHR-L-14-0150
Sander, M. C., Werkle-Bergner, M., Gerjets, P., Shing, Y. L., & Lin-denberger, U. (2012). he two-component model of memory development, and its potential implications for educational settings.Developmental Cognitive Neuroscience,2(Suppl. 1), S67–S77. doi:10.1016/j.dcn.2011.11.005
Satterthwaite, T. D., Wolf, D. H., Erus, G., Ruparel, K., Elliott, M. A., Gennatas, E. D., … Gur, R. E. (2013). Functional maturation of the executive system during adolescence.
Journal of Neuroscience, 33, 16249–16261. doi:10.1523/
JNEUROSCI.2345-13.2013
Sigman, M., Pena, M., Goldin, A. P., & Ribeiro, S. (2014). Neuro-science and education: Prime time to build the bridge.Nature
Neuroscience,17, 497–502. doi:10.1038/nn.3672
Titz, C., & Karbach, J. (2014). Working memory and executive func-tions: Effects of training on academic achievement.
Psycholog-ical Research,78, 852–868. doi:10.1007/s00426-013-0537-1