O R I G I N A L A R T I C L E
Discriminative Characteristics of Marginalised Novel
Psychoactive Users: a Transnational Study
Katalin Felvinczi1&Annemieke Benschop2&Róbert Urbán1&Marie Claire Van Hout3&
Katarzyna Dąbrowska4&Evelyn Hearne5&Susana Henriques6&Zsuzsa Kaló1&
Gerrit Kamphausen7&Joana Paula Silva6&Łukasz Wieczorek4&Bernd Werse7&
Michal Bujalski4&Zsolt Demetrovics1 &Dirk Korf2
# The Author(s) 2019
Abstract
New psychoactive substances (NPS) continue to be considered as a major public health concern in many European countries. The study was implemented within the framework of a transnational project of six European countries (Germany, Hungary, Ireland, Netherlands, Poland, Portugal). Our aim here is to report on the distinct and differentiating characteristics of marginalised NPS users. Three subgroups of a total of 3023 adult NPS users (socially marginalised, night life, online community) were examined regarding their socio-demographic characteristics, substance use, and external motives towards NPS use. Poland and Hungary reported higher rates of NPS use in comparison to traditional controlled drugs. The external/contextual motives did not play a central role in the background of NPS use, the least important motives were alleged legality and non-detectability of these substances.
Marginalised (defined as those accessing low threshold harm reduction services) users’
substance use patterns are different from the other two groups in terms of showing more intense and riskier drug use. The most important variables which contributed to be categorised as a marginalised NPS user were lower level education, being older, having an unfavourable labour market position and using drugs intravenously. Contextual motives did not play a decisive role in being categorised as a marginalised user when drug use pattern was controlled. These identified discriminative features of marginalised drug users should inform policy makers to develop and implement tailor-made interventions targeting this user group to successfully tackle the elevated public health concerns associated with NPS use.
Keywords NPS use . User groups . Contextual motivation . Public health concern . Drug policy
https://doi.org/10.1007/s11469-019-00128-8
* Zsolt Demetrovics
New psychoactive substances (NPS) are a major public health and policy concern in
several parts of the world. NPS are defined as “synthetic or naturally occurring
sub-stances that are not controlled under international law, and often produced with the
intention of mimicking the effects of controlled drugs” (EMCDDA 2014, p.27). In
general, NPS represent a multitude of synthetic and natural compounds marketed as alternatives to conventional illicit drugs (i.e. cannabis, heroin, cocaine, speed, ecstasy), the most popular being cathinone derivatives (i.e. mephedrone, 4-MEC, MDPV), other amphetamine-type substances, and synthetic cannabinoids, with the phenomenon
ob-served since 2007 (Caudevilla2016; EMCDDA 2016). The legislative procedures related
to NPS are very much varied in the different EU member states, covering, and initiating
a wide range of measures to tackle the problem. Neicun et al. (2019) concluded that in
most countries the general psychoactive substance-related legislation is in place to establish a temporary or permanent ban on new psychoactive substances; the actual legal consequences related to personal use (possession, cultivation, purchasing) of these substances is depending on the general rigour or strictness of the penal code of the given country.
The number of compounds labelled as NPS and observed through the Early Warning System (EWS) of the EMCDDA has grown from 13 (in 2004) to 650 (in 2016). General population-based prevalence estimates are rare and inconsistent with regard to trend
monitoring of NPS use (Korf et al. 2019). According to the Eurobarometer (telephone
surveys on drugs among young people aged 15–24 years in Europe), lifetime prevalence
of NPS use increased from 5 to 8% between 2011 and 2014 (Eurobarometer2011 and
2014). The most recent ESPAD study in 2015 reported 4% life time and 3% last year
prevalence of NPS use among the 15–16-year-old European school population (ESPAD
group2016), with large differences among the different countries. In England and Wales,
the 2010/2011 British Crime Survey identified a 0.6% lifetime ketamine use and 1.4%
lifetime mephedrone use (Smith and Flatley 2011). The 2015 National Survey on
Addiction Problems in Hungary found a 1.9%, 1.3% and 0.6% lifetime prevalence rate for synthetic cannabinoids, designer stimulants and mephedrone, respectively (Paksi
et al. 2016). A national prevalence estimates among high-risk drug users in Belgium
showed that the average reported use was 26%, in case of synthetic cannabinoid receptor agonists (SCRA) 19%, whilst for mephedrone 12.5% (European Monitoring Centre for
Drugs and Drug Addiction 2017a). In the Czech Republic, one-third of the high-risk
users had experience (LTP) with NPS (European Monitoring Centre for Drugs and Drug
Addiction2017b). Surveys targeting special (vulnerable) populations of NPS use are rare
and struggle with methodological challenges; the available data suggest that these groups are more prone to NPS use, and show higher prevalence rates across all NPS types
(MacLeod et al. 2016). Studies exploring the knowledge related to NPS in different
countries and age groups revealed that the relevant knowledge is unevenly distributed among young respondents, with young people from rural areas showing less knowledge. These studies also suggested that there is a strong association between NPS use and the risk of binge drinking (Martinotti et al., 2015). The NPS situation has become even more challenging due to the emerging synthetic opioid crisis, which seems to be less alerting
in most European countries than in the USA (Schifano et al.2019); however, opiate use
and related death rates are also increasing in the EU countries. The synthetic opioids— mostly fentanyl—play a significant role in those seeking specialised treatment in Europe
Little knowledge is available about the specific motivations for NPS use and more
in-depth research is needed to better understand these reasons (Moore et al.2013; Korf
et al. 2019). There are studies suggesting that the main motivations towards NPS use
are curiosity, the enjoyable effects, or enhancement of social situations, similar to other
conventional/classical drugs (Corazza et al. 2014; Measham et al. 2010; Werse and
Morgenstern2012; Winstock et al.2015). Studies which have assessed the motivational
background of NPS use have applied the four-factor motivation scale of Cooper (1994)
which is used to measure alcohol consumption motivations, and was later further
developed to measure cannabis (Simons et al. 1998) and amphetamine use related
motivations (Thurn et al. 2017). These motivation scales are based on the Cox and
Klinger’s Motivational Model (Cox and Klinger 1988) and concentrate on internal
motivations such as coping, curiosity, conformity and enhancement. The internal mo-tivation of different user groups and the psychometric properties of a new momo-tivation scale appropriate for cross national study of NPS motivation were also analysed based on the dataset of this research. Apart from identifying the psychometric properties and usability of the scale in a transnational setting and in a special population, it was found that marginalised users showed a higher endorsement in coping motives. The reported results also suggest that marginalisation can be considered as a cross-cultural factor
behind instrumental substance use (Benschop et al. 2019 submitted). Studies assessing
contextual and/or external (pragmatic) motivations towards NPS use, revealed that temporary legal status, easy availability, low price, high perceived or expected quality/purity of these substances might play an important role in predicting use of
NPS (e.g., Werse and Morgenstern 2012; Barratt et al. 2013; Soussan et al. 2018;
Sutherland et al., 2017).
The aim of the present article is (i) to present some short term (last month, last year) frequencies of substance use; (ii) to identify the role of external/contextual motivation factors in NPS use of different user groups; and most importantly (iii) to identify a set of variables (discriminating features) which might contribute to being categorised as marginalised NPS user.
Methods
Sample
The work was undertaken as part of a large transnational interdisciplinary research
project (“New Psychoactive Substances: transnational project on different user groups,
user characteristics, extent and patterns of use, market dynamics, and best practices in
prevention” [NPS-t]) spanning six European countries (Germany, Hungary, Ireland,
Netherlands, Poland and Portugal). The data collection was carried out on a conve-nience sample of three different user groups supposed to have diverging consumption habits, motivations and socioeconomic background in both countries. Despite the high number of respondents (N = 3023), none of our findings can be generalised for the countries involved or for Europe as such. The survey was conducted between April and November 2016. The different user groups reached have an uneven representation in the sample; marginalised users proved to be hard to reach, mostly in Germany, the Netherlands and Portugal.
Three inclusion criteria were set as (1) recent NPS use (at least once in the past 12 months); (2) being resident of one of the participating countries; and (3) an age of 18 years or older. To reach the most heterogeneous sample of NPS users as possible,
three subgroups were aimed to examine (for more details see Van Hout et al.2018; Korf
et al. 2019):
1. Socially marginalised users were defined by their (known and supposed) drug using
habits on one hand and by their availability (low threshold, harm reduction services) and also by the venue of substance use, on the other. Marginalised users were
reported as using opioids, (crack) cocaine and or (meth) amphetamine—often and/
or frequently intravenously or through smoking. They were recruited and interviewed face-to-face by trained fieldworkers or care professionals in the street, or through care and treatment facilities (e.g., drug services, shelters) and through snowball sampling;
In most cases the socially marginalised users were recruited from the capital of the participat-ing country. The German marginalised sample consisted of, almost exclusively, persons from the Munich scene, which is probably the only urban hard drugs users’ setting with substantial (and mostly stimulant) NPS use in Germany.
2. Users in nightlife are recreational drug users who frequent clubs, raves and/or
festi-vals. They were mainly recruited face-to-face on-site at clubs, raves and festifesti-vals. Users in night life mostly self-completed either a pen-and-paper or online question-naire to which they were referred by a flyer containing a link and an individual code;
3. Users in online communities are users who are very active on the internet, and actively
participate in drug forums. They were recruited by posting messages on drug-related
social media and internet forums (i.e. eve-rave.ch/forum;www.legal-high-inhaltsstoffe.de;
www.daath.hu; www.drugs-forum.com; www.legalhighsforum.com). Users in online communities were only given access to the online questionnaire.
Measures
The questionnaire contained items on demographics, routes of administration of sub-stances, motives and frequencies of NPS and other drug use, social and health problems related to it, modes of obtaining NPS, and possible perceived ways of tackling NPS problems. Seven categories of NPS were initially included in the study based on their
epidemiological and clinical relevance: i.e., ‘herbal blends (e.g., ‘Spice’)’; ‘synthetic
cannabinoids (obtained pure)’; ‘branded stimulants (e.g., “bath salts”)’; ‘stimulants/
empathogens/nootropics (obtained pure, e.g., mephedrone, MDPV, a-PVP)’;
‘psyche-delics (e.g., NBOMe-x, 2C-x’); ‘dissociatives (e.g., methoxetamine)’; and ‘other’.
However, survey responses indicated that participants were generally unable to either properly categorise the NPS they had used or differentiate between certain categories (i.e. between herbal blends and synthetic cannabinoids obtained pure and similarly
between branded stimulants and stimulants obtained pure) (Van Hout et al. 2018;
Korf et al.2019). Therefore, these uncertain categories were merged into the following
stimulants (including bath salts and ingredients). In case of NPS dissociatives and NPS psychedelics no merging of the categories was necessary. These NPS substance cate-gories were used during the process of statistical analysis and throughout the
presen-tation of the results. The questionnaire also contained motivations related items1 to
investigate what were the most important reasons to use NPS. These questions had to be answered on a 5-point Likert scale (1 = very unimportant; 5 = very important). The items of the questionnaire were based on the Marijuana Motivation Scale (MMM,
Simons et al. 1998) and its further developed amended and psychometrically tested
version (Benschop et al. 2015). Six items reflecting external/contextual motives unique
for NPS use and not covered by the revised MMM were added: poor quality of other (traditional) drugs, price, alleged legality, expecting different or new experiences (regarding drug effects), non-detectability and low availability of other (traditional) drugs.
Statistical Analysis
During the statistical analysis, SPSS 25.0 programme was used. Descriptive statistics are presented on substance use frequencies and on external/contextual motives. Prin-cipal component analysis was carried out on the external motivation items to assess if these items construct a coherent scale. Variance analysis was carried out to assess the differences regarding external/contextual motives in different user groups and/or coun-tries, and finally, binary logistic regression models were developed to assess the possible factors contributing to be categorised as a marginalised user.
Results
Descriptive Statistics—Sample Characteristics
The number of respondents reached in the different countries and user groups varied
significantly across the participating countries (see Table 1). The highest number of
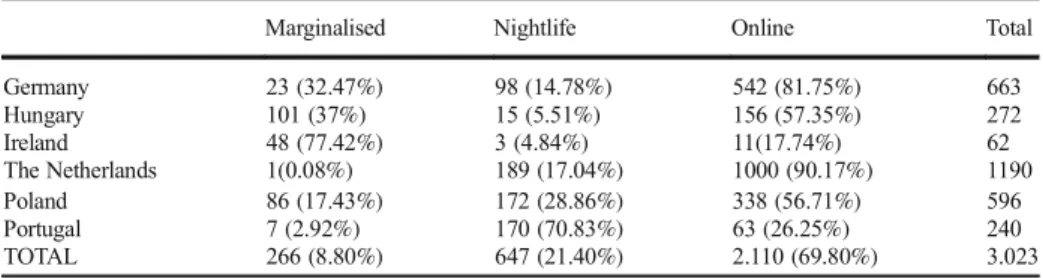
marginalised users was recruited in Hungary, whilst the highest number of online users was reached in the Netherlands. The most balanced sample (in number of respondents belonging to the different user groups) was achieved in Poland. As there was no way to carry out a probabilistic and random sample selection in these special populations none of the samples were representative of the participating countries.
The sample was very much varied as far as the socio-demographic characteristics of the respondents are concerned. Most of them were male, and lived in larger cities, the most noticeable differences can be seen in the level of education (the lowest level education was observed among marginalised users and the highest in the on-line community) and in the employment conditions; most marginalised users were unemployed whilst night life and online community representatives were either students or full-time workers (for further
details see Korf et al.2019).
1
The current paper is not presenting findings on all motivation related items; it is focusing exclusively on the newly added 6 items. The motivation scale without the newly added items (its psychometric properties and cross-cultural usability) was analysed in another article (Benschop et al.2019, submitted).
Short Term (Last Month2) Frequency of Substance Use in Different User Groups According to last month frequency of substance use, all user groups, regardless of their country of residence, are also using controlled substances; apart from Hungary and Poland, these frequencies are the highest in all user groups. Due to the fact that the different user groups were reached in an uneven proportion in the different countries, the following results would describe the short-term frequencies of substance use in different user groups. To be able to show the problematic nature of substance use, frequencies of intravenous drug use were also included into the analysis.
Marginalised Users
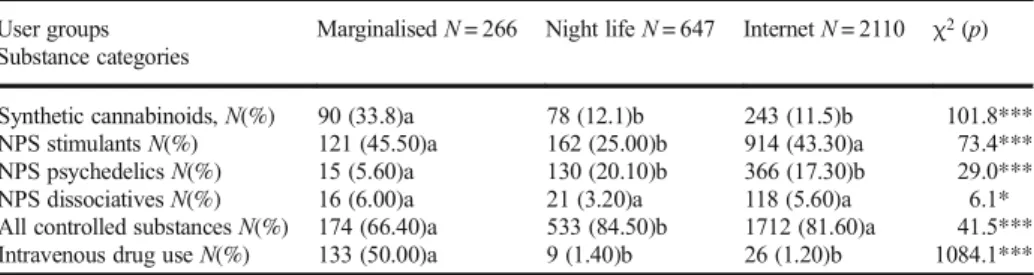
Last month frequency of controlled substance use is lower among marginalised users than in the other two user groups (66.4% vs. above 80%). The most popular substances among new psychoactive substances are the NPS stimulants and the synthetic cannabinoids. The highest frequency of intravenous drug use was observed among this user group, half of them applied this route of administration in the month preceding the data collection. NPS psychedelic use is very rare among marginalised users, less than 6% of them used this type of substance in the last month.
2
We deliberately chose last month frequency of use to present the differences among user groups and countries. The inclusion criteria for all the respondents were NPS use at least once in the preceding 12 months; consequently, the measured last year frequency of use was considerably high in all user groups. According to the recently introduced new“High Risk Drug Use Indicator” by the EMCDDA (2013) this“…..indicator area focuses on “High-risk drug use”, “recurrent drug use that is causing actual harms (negative consequences) to the person (including dependence, but also other health, psychological or social problems) or is placing the person at a high probability/risk of suffering such harms. High risk drug use is measured as the use of psychoactive substances by high risk pattern (e.g. intensively) and/or by high risk routes of administration….” EMCDDA, 2013, p.3.). As the main objective of this paper is to describe the discriminating features of marginalised users we wanted to capture the most visible elements of high-risk drug use, among them short-term (last month) use (as recurrent and intensified drug use) and the most harmful modes of administering substances (injecting).
Table 1 Composition of the sample according to countries and user groups (number and percentage of respondents)
Marginalised Nightlife Online Total
Germany 23 (32.47%) 98 (14.78%) 542 (81.75%) 663 Hungary 101 (37%) 15 (5.51%) 156 (57.35%) 272 Ireland 48 (77.42%) 3 (4.84%) 11(17.74%) 62 The Netherlands 1(0.08%) 189 (17.04%) 1000 (90.17%) 1190 Poland 86 (17.43%) 172 (28.86%) 338 (56.71%) 596 Portugal 7 (2.92%) 170 (70.83%) 63 (26.25%) 240 TOTAL 266 (8.80%) 647 (21.40%) 2.110 (69.80%) 3.023
Users in Night Life
Controlled substances are the most prevalent substances in the night life user group (84.5%) as well, the second most prevalent substances in this user group are NPS stimulants and NPS psychedelics (25% and 20.1%, respectively). Synthetic cannabi-noids are also popular in this user group as every 9th respondents used this substance during the month before the data collection was carried out. Almost no intravenous drug use can be observed in this user group (1.40%).
Users in Online Community
In the online NPS user group, after the most prevalent controlled substances, NPS stimulants rank second and NPS psychedelics the third place (43% and 17%, respective-ly). Synthetic cannabinoids are the fourth most popular NPS substance used in this group during the month preceding the data collection. Last month frequency of intravenous
drug use is low, 1.20% in this user group (Table2).
Short-term frequencies of substance use show that NPS users do not form an independent group of substance users, traditional controlled substances still play a significant role in the poly-substance use patterns of NPS users. The last month frequencies of substance use, especially when we compare them with data stemming from general adult population surveys of the last 3 years, show that recent NPS users in the current sample are very intensive substance users. The frequencies of substance use estimates suggest that the most popular new
psychoactive substances (synthetic cannabinoids, NPS stimulants) are 2–3 times more
fre-quently used monthly among recent NPS consumers (the frequencies are between 33.80 and 45.50%) than any controlled substances in the general population of the same countries. For the most popular substances (cannabis and MDMA) the highest prevalence was 15.70% and
9.20% respectively (EMCDDA2018). However, not just NPS are used heavily among recent
NPS users, but the last month frequencies of substance use for all controlled substances is four to five times higher among recent NPS users than in the general population, as it is presented in
the European Drug Report (EMCDDA2018).
Table 2 Last month frequencies of substance use (%) according to user groups
User groups Marginalised N = 266 Night life N = 647 Internet N = 2110 χ2(p) Substance categories
Synthetic cannabinoids, N(%) 90 (33.8)a 78 (12.1)b 243 (11.5)b 101.8*** NPS stimulants N(%) 121 (45.50)a 162 (25.00)b 914 (43.30)a 73.4*** NPS psychedelics N(%) 15 (5.60)a 130 (20.10)b 366 (17.30)b 29.0*** NPS dissociatives N(%) 16 (6.00)a 21 (3.20)a 118 (5.60)a 6.1* All controlled substances N(%) 174 (66.40)a 533 (84.50)b 1712 (81.60)a 41.5*** Intravenous drug use N(%) 133 (50.00)a 9 (1.40)b 26 (1.20)b 1084.1*** Synthetic cannabinoids included synthetic cannabinoids pure, herbal brands; NPS stimulants included branded stimulants (e.g.“bath salts”), empathogens, nootropics, (obtained pure, e.g.. mephedrone, MDPV, a-PVP); NPS Psychedelics included e.g. NBOMe-x. 2C-x′; NPS dissociatives included, e.g. methoxetamine; controlled substances included cannabis, amphetamine, xtc, cocaine, crack-cocaine, heroin, magic mushroom, LSD, metamphetamine, ketamin, GHB. *p < 0.05; ***p < 0.001. Different subscript letters indicate a significant (p≤ 0.05) differences in proportions
Perceived Context of NPS Use among Different User Groups
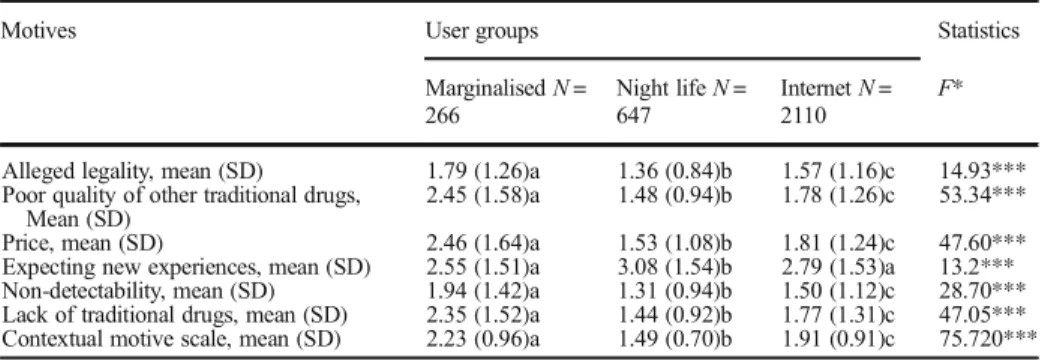
The focus of our current analysis regarding motives was to find out if the external/pragmatic items added to the motivation scale can deepen our understanding regarding the motivation towards NPS use. The mean scores of the sample show that these external/contextual motives were rated 3.1 or less on the five-grade Likert scale. Items related to the legal status and to the perceived non-detectability of NPS were given ratings lower than 2. There are considerable differences among user groups; in general, marginalised users rate these items higher (consider them more important)
than the other user groups with the only exception of“Expecting different or new experiences
(regarding drug effects)”. This item is rated highest among night life users (see Table3).
Even though the analysis found relatively low ratings of external/contextual motives towards NPS use, during the next step, for methodological clarity, we studied if the newly included items of the motivation scale construct a coherent factor to measure external/contextual motivations towards NPS use. The principal component analysis on these items extracted only
one component with the following items:‘alleged legality’, ‘price’, ‘low availability of other
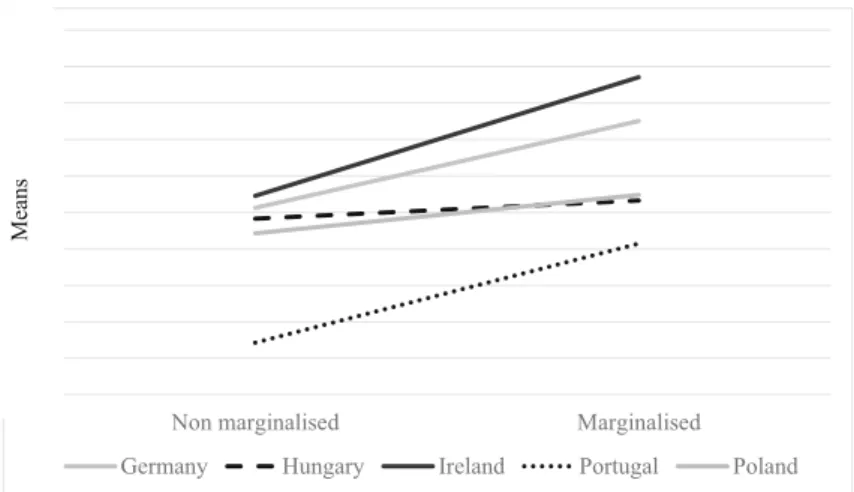
(traditional) drugs’, ‘non-detectability’ and ‘poor quality of other (traditional) drugs’ whilst ‘expecting different or new experiences (regarding drug effects)’ did not become part of this factor. The identified factor was able to explain more than 44% of the variances. The component loadings ranged between 0.60 and 0.73. This factor was given the contextual motivation factor label. The Cronbach Alpha for these items was 0.682, which is on the threshold of acceptability. As the main focus of the present analysis is to identify the discriminative features of marginalised users compared to other user groups, we analysed the variances of the external/ contextual motivation factor scores in marginalised and non-marginalised users across the different countries. To be able to do so, we applied a re-coding during which we kept the marginalised group as it was (N = 265), and the night life and online community groups were merged into one variable labelled as non-marginalised (N = 1568). The Netherlands was left out from this analysis as only one marginalised respondent was interviewed in this country.
As the figure below (Fig.1) shows, contextual/external motivation factor scores are higher
among marginalised users in all countries included into the analysis, whilst in two countries
Table 3 The variance of contextual motives among user groups
Motives User groups Statistics
Marginalised N = 266 Night life N = 647 Internet N = 2110 F* Alleged legality, mean (SD) 1.79 (1.26)a 1.36 (0.84)b 1.57 (1.16)c 14.93*** Poor quality of other traditional drugs,
Mean (SD)
2.45 (1.58)a 1.48 (0.94)b 1.78 (1.26)c 53.34*** Price, mean (SD) 2.46 (1.64)a 1.53 (1.08)b 1.81 (1.24)c 47.60*** Expecting new experiences, mean (SD) 2.55 (1.51)a 3.08 (1.54)b 2.79 (1.53)a 13.2*** Non-detectability, mean (SD) 1.94 (1.42)a 1.31 (0.94)b 1.50 (1.12)c 28.70*** Lack of traditional drugs, mean (SD) 2.35 (1.52)a 1.44 (0.92)b 1.77 (1.31)c 47.05*** Contextual motive scale, mean (SD) 2.23 (0.96)a 1.49 (0.70)b 1.91 (0.91)c 75.720*** *ANOVA
***p < 0.001
The Games-Howell test was used as post hoc test. Different subscript letters indicate a significant difference (p≤ 0.05) in the parameters
Contextual motive scale results are presented without the Netherlands, the N for the user groups is marginalised, 265; night life, 458; Internet 1110
(Hungary and Poland), the differences in the means between marginalised and non-marginalised user groups are much smaller than in the others. These comparisons show that contextual motivations presumed to be NPS specific play a different role depending on the country of residence of the respondents.
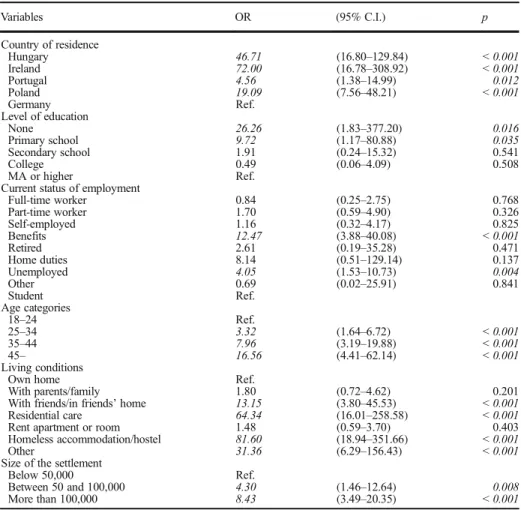
Discriminating Features of Marginalised NPS Use—Binary Logistic Regression In the next phase, we studied the factors that might describe the discriminating features of marginalised NPS users. For this purpose, two binary logistic regression models were created; in each case, the dependent variable was if the respondent was categorised as marginalised vs. non-marginalised user. The Netherlands was left out from this analysis as the total number of marginalised users reached during the interview was only one person. The total number of respondents included into this analysis was 1833. In the first model, we included only socio-demographic characteristics (education, current status of employment, gender, age, size of the settlement and living conditions). The low level of accomplished education, living on benefits, being unemployed, being older, living with friends, using homeless-type accommodation arrangements and living in bigger settlements significantly increased the probability of being
a marginalised user (see Table4).
Country of residence seems to be associated with significant and high odds ratios for being categorised as a marginalised user, though these findings might just be the consequence of sample attainment. As the number of marginalised users reached during the data collection was very much varied we carried out a country based binary logistic regression analysis as well during which the same set of variables were used to find out the country specific characteristics of the marginalised user group. Level of education played a role in being categorised as a marginalised user in the case of Hungary and Germany. In Hungary, less education elevated the risk of being part of the marginalised user group whilst in Germany any accomplished education increased this risk (very probably due to the high number of participants with higher education attainment in the sample). The employment status proved to be an active ingredient of being categorised as a
marginalised user in Poland. Living on benefits or being unemployed elevated this risk 32–9.2
times higher than being a student. Age also had a different role depending on the country of 1.00 1.20 1.40 1.60 1.80 2.00 2.20 2.40 2.60 2.80 3.00
Non marginalised Marginalised
Germany Hungary Ireland Portugal Poland
Means
Fig. 1 The variance of contextual motivation according to user groups and countries (N = 1801). Note: F value for countries, 5.811***; for user groups, 16.343***; for country*user group interaction, 1.612, *** p < 0.001
residence of the respondent. In case of Hungary and Poland, being older than 24 highly elevates the risk of being part of the marginalised group. Living with friends just in Germany, residential care in Germany and Poland and homeless accommodation in Germany, Hungary and Poland contributed to the marginalised categorisation. Size of the settlement where the respondent was living did not add to this categorisation. In the case of Portugal and Ireland, none of the variables
revealed any patterns (see detailed result in Appendix Table6).
Another binary logistic regression model was developed on substance use–related
behav-iour (Table5). We included NPS and controlled substance use frequencies (life time, last year,
last month), venue of substance use, problems (physical, social and mental health) experienced after using NPS, parallel usage of different substances, and contextual motivation factor. The model shows that characteristics of problem drug use (EMCDDA, 2009) are clearly associated with being a marginalised respondent. Those who used heroin or methamphetamine during
Table 4 Binary logistic regression analysis of socio-demographic factors for being categorised as a marginalised user Variables OR (95% C.I.) p Country of residence Hungary 46.71 (16.80–129.84) < 0.001 Ireland 72.00 (16.78–308.92) < 0.001 Portugal 4.56 (1.38–14.99) 0.012 Poland 19.09 (7.56–48.21) < 0.001 Germany Ref. Level of education None 26.26 (1.83–377.20) 0.016 Primary school 9.72 (1.17–80.88) 0.035 Secondary school 1.91 (0.24–15.32) 0.541 College 0.49 (0.06–4.09) 0.508 MA or higher Ref.
Current status of employment
Full-time worker 0.84 (0.25–2.75) 0.768 Part-time worker 1.70 (0.59–4.90) 0.326 Self-employed 1.16 (0.32–4.17) 0.825 Benefits 12.47 (3.88–40.08) < 0.001 Retired 2.61 (0.19–35.28) 0.471 Home duties 8.14 (0.51–129.14) 0.137 Unemployed 4.05 (1.53–10.73) 0.004 Other 0.69 (0.02–25.91) 0.841 Student Ref. Age categories 18–24 Ref. 25–34 3.32 (1.64–6.72) < 0.001 35–44 7.96 (3.19–19.88) < 0.001 45– 16.56 (4.41–62.14) < 0.001 Living conditions
Own home Ref.
With parents/family 1.80 (0.72–4.62) 0.201
With friends/in friends’ home 13.15 (3.80–45.53) < 0.001
Residential care 64.34 (16.01–258.58) < 0.001
Rent apartment or room 1.48 (0.59–3.70) 0.403
Homeless accommodation/hostel 81.60 (18.94–351.66) < 0.001
Other 31.36 (6.29–156.43) < 0.001
Size of the settlement
Below 50,000 Ref.
Between 50 and 100,000 4.30 (1.46–12.64) 0.008
More than 100,000 8.43 (3.49–20.35) < 0.001
Ref., Reference category
Binary logistic regression analysis (FSTEP), 8 iterations
their life time or in the last year have a 2.1 to 3.1 times bigger chance to be categorised as marginalised than those who did not. In case of those who had ever or during the last year injected any kind of substances, the odds ratios are considerably elevated. Frequencies of current substance use reveal that using synthetic cannabinoids or crack also highly increases the odds ratios for being categorised as marginalised user, whilst using cannabis or amphet-amine during the last month decreased the chance for belonging to this category. If someone is using substances in residential care, the chance for being categorised as a marginalised user is 5.4 times higher, whilst using NPS and alcohol or controlled substances together decreases the likelihood of being categorised as a marginalised user.
As we found considerable differences in the sociodemographic variables according to countries of residence, we analysed the country-specific contributing factors of substance
Table 5 Binary logistic regression analysis of substance use related factors for being categorised as a marginalised user
Name of the variable OR (95% C.I. ) p.
Last year/life time substance use
Last year NPS psychedelic use 0.25 (0.13–0.47) < 0.001
Last year ecstasy use 0.60 (0.34–1.03) 0.066
Life time heroin use 2.06 (1.10—3.85) 0.023
Last year methamphetamine use 3.09 (1.70–5.59) < 0.001
Last year LSD use 0.41 (0.19–0.85) 0.017
Life time intravenous drug use 8.32 (4.28–16.20) < 0.001 Last month substance use
Last month synthetic cannabinoids use (incl. all herbal blends) 2.28 (1.38–3.77) 0.001
Last month cannabis use 0.37 (0.23–0.59) < 0.001
Last month amphetamine use 0.40 (0.21–0.77) 0.006
Last month crack use 6.93 (2.18–22.05) 0.001
Last month intravenous drug use 5.22 (2.52–10.81) < 0.001 Problems and risk behaviour
Perceived social problems 0.48 (0.30–0.76) 0.002
NPS consumption together with controlled substances 0.54 (0.34–0.85) 0.008 NPS consumption together with alcohol 0.49 (0.31–0.77) 0.002 Venue of consumption
At own home 0.24 (0.15–0.39) < 0.001
At a friend’s house 0.57 (0.35–0.91) 0.018
Night life 0.57 (0. 34–0.95) 0.029
In residential care 5.42 (1.62–18.09) 0.006
Ref., reference category
Binary logistic regression analysis (FSTEP), 7 iterations
Synthetic cannabinoids included synthetic cannabinoids pure. Herbal brands; NPS stimulants included branded stimulants (e.g.:“bath salts”), empathogens, nootropics (obtained pure, e.g.: mephedrone. MDPV, a-PVP), NPS psychedelics included, e.g. NBOMe-x. 2C-x′, NPS dissociatives included, e.g. methoxetamine; controlled substances included cannabis, amphetamine, xtc, cocaine, crack-cocaine, heroin, magic mushroom, LSD, metamphetamine, ketamin, GHB
Variables not remained in the equation during the FSTEP procedure:
Substance use related variables: synthetic cannabinoids last year consumption; stimulants/empathogens/ nootropics pure last year and last month consumption; dissociative last year and last month consumption, psychedelics last month consumption, cannabis las year consumption, cocaine last year, last month consumption, heroine last year, last month consumption, crack last year consumption, LSD last month consumption, metamphetamine last month consumption, NPS use together with another NPS
Venue of the substance use related items: work place, special places created for drug users Contextual motive scale
use (the same set of variables as described above) in being categorised as a marginalised user.
(see Appendix, Table7). The analysis revealed that last year and last month use of heroin and
intravenous drug use (in Germany and Poland), amphetamine, methamphetamine use (in Poland) and synthetic cannabinoid and crack use (in Hungary), highly elevated the risk of being categorised as a marginalised user. The parallel use of different new substances (NPS) contributed to being categorised as a marginalised user in Germany (OR = 6.53), whilst the venue of substance use found to be influential in the case of Poland where usage in residential care substantially increased the odds ratios of this type of categorisation. Contextual motives did not contribute to being categorised as a marginalised user among German respondents. In the case of Portugal and Ireland none of the variables revealed any patterns, probably due to the low sample size reached in these countries.
Discussion
The study has provided unique insight into NPS and controlled drug using patterns of different user groups and identified a series of demographic and external contextual factors potentially contributing to being categorised as marginalised user in six European countries. Based on frequencies, and mostly on short-term frequencies of substance use (last month) we can say that among recent NPS users, much higher frequencies of substance use can be observed than in adult population surveys, suggesting that we studied a very specific population. The special nature of the population we studied was illustrated in the results chapter, based on comparing our own data
and the ones presented in the 2018 European Drug Report (EMCDDA 2018). Based on this
comparison, it can be assumed that those three user groups which were investigated in the context of a large European transnational project are much more intense, and in some cases, much more problematic users than those representing the adult population in the relevant countries. The impression of intense substance use in these groups might also be the consequence of poly drug using tendencies of NPS users; NPS use very frequently happens in the context of polysubstance
use (European Monitoring Centre for Drugs and Drug Addiction2017b). The problematic nature
of substance use is supported by the frequent intravenous substance use especially among marginalised users. Another warning sign is that the respondents were not necessarily able to say what kind of substance they were using, and they were not able to reflect on the active
ingredients of the substances (see further details in Van Hout et al.2018; Korf et al.2019).
Epidemiological research so far has not yet revealed the discriminating features of different NPS user groups as large-scale representative studies cannot reflect on the specificities of special groups. There are plenty of studies which describe the socioeconomic properties of substance users (including legal and illegal substances); these studies consistently claim that disadvantageous socioeconomic situation significantly contributes to elevated risk of heavy/
problematic substance use (see e.g. Janicijevic et al. 2017). In the light of the few adult
population surveys implemented in the last few years, it can be assumed that NPS play a
substantial role in the poly-consumption patterns of drug users (i.e. Paksi et al.2016, 2017).
According to our analysis and in accordance with other studies (i.e. Van Hout et al.2018),
the substance-related preferences of different user groups vary. In all user groups (marginalised users, night life and online), the most frequently used substances are the controlled ones, with NPS being just part of poly-substance using repertoires. Based on our data and in accordance
with other research (Potter and Chattwin2018), it can be said that NPS use does not constitute
marginalised users are using significantly less of them than the other user groups. In the case of marginalised users, regardless of their country of residence, the rates for current use show that NPS play a relatively bigger role in their drug using preferences than traditional controlled substances, which is the reverse in the case of other user groups (night life and internet community). The most popular NPS type substances among marginalised users are synthetic cannabinoids, and NPS stimulants. In some countries, it is worth noting, as qualitative research
also revealed (Kaló et al.2017), that some individuals in disadvantageous social-economic
situations start drug-using careers or pathways with NPS. The early onset of psychoactive substance use and especially the preference towards NPS, contributes substantially to the development of particularly destructive forms of drug use in socially marginalised groups.
Our analysis also revealed that the newly added items to the motivation scale are organised in one factor named contextual factor. The analysis also revealed that the perceived (reported) importance of these motives do not play a decisive role in drug using preferences of recent NPS users. We can conclude that, if at all, particularly low availability and poor quality of controlled substances as well as the relatively low price of NPS may play a more important role in the motivation towards these substances in case of marginalised users compared with other recent NPS user groups. The respondents from all user groups rated the contextual motivation items relatively low, the least important motives are the alleged legality and non-detectability of these substances. The relative unimportance of these items might be the consequence of the legal status of different new psychoactive substances in the different countries. Another possible explanation of this finding might also be that all recent NPS users are (intensively) using controlled substances; consequently, the temporary legal status of any given NPS is not a significant issue to articulate their choices for consumption. This finding might be highly relevant in the drug policy/legislation debates in connection to the current regulatory efforts. Some of the external/contextual motivation items received higher ratings from marginalised respondents with significant differences depending on country of residence. Data describing the drug use patterns of the three diverse NPS user groups and the regression model, including a wide range of socio-demographic variables (age, level of education, labour market position, recent use of NPS and controlled substances, route of administration), strongly suggest that marginalised users are the most at-risk population with lower education and with the most risky drug using patterns. As our selection criteria regarding marginalised users was very much concentrating on the venue of substance use (streets, public places) and/or being clients of low threshold/harm reduction services and their networks, it is very much reassuring that our analysis revealed that the marginalised users reached have indeed a well identifiable socio-demographic profile, describing their elevated vulnerability. These findings not just mirror the sample selection criteria, but it draws a more refined picture regarding the socio-demographic factors and the discriminating substance use habits of marginalised users; outlining the profile of high-risk problematic drug use.
The binary logistic regression model, which included all respondents from the participating countries (apart from the Netherlands) is conclusive regarding the main sociodemographic characteristics and substance use patterns of the marginalised user group. More detailed country-based analysis suggests that variables supposed to be contributing to the marginalised—non-marginalised categorisation of the respondents in different countries are very much varied, at some points, the findings are even contradictory. Therefore, it is suggested that further epidemiological studies should be carried out to obtain reliable data from different countries on the relative weight of NPS use in different user groups and on other factors contributing to enhance our user group specific understanding of NPS use and, in
general, problematic drug use behaviour. Further research is especially needed as our data cannot be considered as representative for the participating countries or for the chosen user groups. Contextual motives, as the logistic regression model shows, do not contribute to be categorised as a marginalised user when other variables were controlled. The intense drug use of marginalised NPS users should call the attention of policy makers to strengthen tailor-made harm reduction services and targeted prevention activities in these groups, to properly respond to the public health and legal concerns in some European countries where NPS use is especially prevalent among low social status marginalised users.
Conclusions
This study contributes to the better understanding of NPS use in special populations, especially in the marginalised user group, by describing the discriminating features of substance use, its setting and the sociodemographic properties of respondents in this group. This statement might remain to be true even though the data collection was carried out on a convenience sample (with different but standardised recruitment strategies in each user group) and the number of respondents in the different user groups was very much uneven, and we have no sufficient reliable information on the prevalence of NPS use in the general population. Our data can inform decision-makers about the necessity of enhancing complex interventions targeting high risk marginalised users and also the scientific community that large-scale epidemiological surveys in special populations should be carried out to further develop our understanding regarding NPS use in certain populations.
Funding Information This study was supported by the European Union (New Psychoactive Substances: transnational project on different user groups, user characteristics, extent and patterns of use, market dynamics, and best practices in prevention [HOME/2014/JDRU/AG/DRUG/7077]), the Hungarian National Research, Development and Innovation Office (Grant number: KKP126835), and the Hungarian Ministry of Human Capacities (ELTE Institutional Excellence Program, 783-3/2018/FEKUTSRAT). The study was also supported for the realisation of this international co-financed science project in 2016-2017 by the Polish Ministry of Science and Higher Education. The funding institutions had no role in the study design or the collection, analysis and interpretation of the data, writing the manuscript, or the decision to submit the paper for publication.
Compliance with Ethical Standards
Conflict of Interest The authors (Katalin Felvinczi,Annemieke Benschop, Róbert Urbán, Marie Claire Van Hout, Katarzyna Dąbrowska, Evelyn Hearne, Susana Henriques, Zsuzsa Kaló, Gerrit Kamphausen, Joana Paula Silva,Łukasz Wieczorek, Bernd Werse, Michal Bujalski, Zsolt Demetrovics, Dirk Korf) declare that they do not have any conflicts of interest that could constitute a real, potential or apparent issue with respect to their involvement in the publication. The authors also declare that they do not have any financial or other relations (e.g. directorship, consultancy or speaker fee) with companies, trade associations, unions or groups (including civic associations and public interest groups) that may affect the results or conclusions in the study. Sources of funding are acknowledged.
Open Access This article is distributed under the terms of the Creative Commons Attribution 4.0 International License (http://creativecommons.org/licenses/by/4.0/), which permits unrestricted use, dis-tribution, and reproduction in any medium, provided you give appropriate credit to the original author(s) and the source, provide a link to the Creative Commons license, and indicate if changes were made.
Ta ble 6 Bina ry log isti c re gre ssi on ana ly sis of soc io-de mog ra phi c fac to rs for b ei n g ca te go ris ed as a m ar g ina lis ed use r ac co rdi n g to coun try o f resi d en ce Co u n try n am e o f the va riab le GER H U IR P L P T OR [95% CI] Le ve l o f educ at ion Non e 0. 087 [0 .00 3– 2 .814 ] x x x x P ri m ar y sch ool 0. 046 * [0 .0 0 3– 0.67 5] 193 .91 1 * [5 .0 7 9– 740 2.9 37] x x x Se co nd ar y sc h o o l 0. 015 * [0 .0 0 1– 0.26 6] 34. 166 * [1 .0 51 –1 1 1 0.6 78] x x x Colle g e 0. 028 * [0 .0 0 1– 0.52 7] 1.4 3 0 [0.0 5– 40 .9 2 ] x x x M A /MS c o r high er R ef . Re f. Re f. Re f. Re f. Current status o f employment Full -tim e w ork er x x x 0.5 3 1 [0. 055 –5. 148 ] x Par t-time w or ke r x x x 1.9 8 4 [0. 246 –15 .39 6 ] x Sel f-emp loy ed x x x 1.4 0 2 [0. 097 –20 .20 4 ] x Benefits x x x 32. 098 * [3 .7 8 4– 272 .12 ] x Re tired xx Hom e duti es xx Unemployed x x x 9.2 21* [1 .81 3– 4 6 .9 02] x Other x x 1 x x Stu d en t R ef . R ef . R ef . R ef . R ef . Age 18–24 R ef . Re f. Re f. Re f. Re f. 25 –34 x 5.6 91* [1 .021 –31 .70 3 ] x 2.2 2 3 [0. 608 –8. 129 ] x 35 –44 x 54. 236 * [5 .3 16 –5 53. 321 ] x 34. 739 ** [4 .982 –24 2.2 41] x x 45 + x 24. 787 [0 .892 –68 9.0 86] x 33. 168 * [2 .1 6– 5 09. 312 ] x Ge nde r F em ale R ef . Re f. Re f. Re f. Re f. Ma le 9.4 79* [1 .872 –48 .00 9 ] Liv ing co ndit ion s W ith pa re nts /fa mily 0 .5 8 4 [0 .0 31 –1 1 .13] 0.6 7 9 [0.0 9 6– 4.8 2 ] x 1.5 9 2 [0. 281 –9. 037 ] x W it h fr ie nd s/ in fr ie n d s’ ho m e 19 .93 3 * [1 .247 –31 8.6 49] 5.7 5 8 [0.3 4 2– 96. 836 ] x 19. 891 * [1 .5 1 5– 261 .15 5 ] x Res ide nti al ca re 10 6.5 56* [4 .90 4– 2 315 .1 14] 48. 227 [0 .607 –38 32. 513 ] x 142 .33 8** [1 3.4 8 5– 150 2.4 66] x Re nt ap ar tme n t o r roo m 2 .6 9 0 [0 .2 78 –3 1 .56 7 ] 0 .4 87 [0 .0 54 –4.3 83] x 1 .2 87 [0 .222 –7. 48] x
Append
ix
Tabl e 6 (c o n tin ue d) Coun try n am e o f the v ar iab le GER H U IR P L P T Homeless accommodation/hostel 16 9.21 2** [1 1 .50 2– 2 489 .41 4 ] 9 3 .9 47* [4 .72 3– 1 868 .55 3 ] x x x ot he r 47 .130 * [1 .7 3 4– 128 1.1 87] 1 7 .0 95* [1 .04 6 × 279 .35 ] x 9 9 .61 7* [4 .5 03 –2 203 .68 ] x Own h o m e R ef . R ef . R ef . R ef . R ef . Size of the set tlement Be lo w 5 0. 0 0 0 R ef . R ef . R ef . R ef . R ef . Bet w ee n 5 0 × 1 00. 000 x x x 7.27 3* [1 .43 –36. 988 ] x Mo re th an 100 .00 0 x x x 2.84 8 [0 .6 1 6– 13. 174 ] x * p <0 .0 5 ; * * p < 0 .0 01; x th e v ar ia b le is not in th e eq u at ion o r the OR no t w ith in th e co n fi de nce in te rva l
Tabl e 7 Bin ar y logis tic re gr es sio n an al ysi s of su bsta nc e u se re la te d fac tor s fo r b ein g ca teg o rised as a m ar gin alised user ac co rd ing to co u n tr y o f reside n ce Co unt ry nam e o f the v ar ia bl e G ER HU IR PL PT OR [95% CI] Frequency o f life time /last year sub stance u se Ca nn abi s x x x 0. 179 * [0 .0 4 8– 0.6 61] x NPS p sy ch ed el ics x 0.0 55* [0 .00 8– 0. 4 ] x x x Ecst asy x 0.2 47* [0 .07 9– 0 .76 6] x 0. 245 * [0 .0 7 8– 0.7 72] x Amphetamine x x x 14 .90 2** [4 .50 4– 4 9 .3 01] x Co ca ine x x 0. 079 * [0 .0 1 6– 0.4 03] x Heroin 4 5 .2 41* [4 .87 4– 4 19. 894 ] x x x x M eth am p h et am in e x x x 4. 721 * [1 .6 4 1– 13. 587 ] x In tr av en o u s d ru g u se x 87. 058 ** [2 4. 8 7 1– 3 04. 73] x 28 .78 4** [8 .94 3– 92 .6 4 ] x Sy nthe tic ca n n ab ino ids (i ncl . All h er ba l b le nds ) x x x 6. 533 * [2 .2 6 8– 18. 819 ] x Fr eq ue ncy o f la st m ont h su b st an ce use Sy nthe tic ca n n ab ino ids (i ncl . All h er ba l b le nds ) x 4.9 38* [1 .66 1– 1 4 .6 84] x xx NPS p sy ch ed el ics x x x 0. 017 * [0 .0 0 1– 0.2 78] x ca nna bi s x x x 0. 176 * [0 .0 6 2– 0.5 01] x ec sta sy xx x xx am ph etam in e 0 .21 8* [0 .054 –0. 886 ] x x 0. 09* [0 .01 9– 0 .43 3] x co ca ine x x x xx cr ac k x 66. 594 * [2 .1 2 5– 208 6.8 48] x xx NPS d issociativ es x x x 0. 106 [0 .00 7– 1. 5 6 ] x intr av en ous dr ug use 1 8 .7 33* * [5 .0 0 8– 70. 073 ] x x 80 .20 4** [1 2.1 0 9– 531 .23 1 ] x PROBLEMS AND RISK BEHA VIOUR m ental an d p h y sic al sid e ef fe ct s related to d ru g u se x x x 0. 393 [0 .16 4– 0 .94 1] 0.0 64* NPS u se together with alcohol x 0.2 * [0 .0 6 8– 0.58 8] x x x NPS u se toge the r with othe r N PS 6 .53 2* [1 .3 8– 30. 923 ] x x x x NPS u se together with controlled subs tances x 0.1 44* [0 .04 5– 0 .45 8] x x x V enue of cons ump tion At own h ome 0 .16 8* [0 .0 4– 0.7 03] 0.2 02* [0 .06 5– 0 .62 7] x 0. 12* * [0 .0 45 × 0 .3 16] x In re sid ent ial ca re x x x 20 9.4 63* * [19. 483 –22 51. 944 ] x * p < 0 .0 5; ** p < 0 .001; x the v ari abl e is n ot in the equation o r the OR no t w ith in the co nf ide n ce in te rv al
References
Barratt, M. J., Cakic, V., & Lenton, S. (2013). Patterns of synthetic cannabinoid use in Australia. Drug and Alcohol Review, 32, 141–146.https://doi.org/10.1111/j.1465-3362.2012.00519.x.
Benschop, A., Liebregts, N., van der Pol, P., Schaap, R., Buisman, R., van Laar, M., van den Brink, W., de Graaf, R., & Korf, D. J. (2015). Reliability and validity of the marijuana motives measure among young adult frequent cannabis users and associations with cannabis dependence. Addictive Behaviors, 40, 91–95. Benschop A., Bujalski M, Dabrowska K., Demetrovics Z., Egger D., Felvinczi K., Henriques S., Kalo Z.,
Kamphausen G., Korf D.J., Nabben T., Silva J.P., Van Hout M.C., Werse B., Wells J., Wieczorek L., Wouters M. (2017). New psychoactive substances: transnational project on different user groups, user characteristics, extent and patterns of use, market dynamics, and best practices in prevention (NPS-transnational project; HOME/2014/JDRU/AG/DRUG/7077). Final Report. Amsterdam: Bonger Institute of Criminology, University of Amsterdam.
Benschop A, Urban R, Fövény M, Dąbrowska K, Van Hout MC, Dąbrowska K, Felvinczi K, Hearne E, Henriques S, Kaló Zs, Kamphausen G, Silva JP, Wieczorek L, Werse B, Bujalski M, Korf D, Demetrovics Zs, (2019) Why do people use new psychoactive substances? Development of a new measurement tool in six European countries. Submitted for publication.
Caudevilla F (2016) The emergence of deep web marketplaces: a health perspective. The internet and drug markets. (European Monitoring Centre for Drugs and Drug Addiction: Insights 21) (pp. 69–75). Luxembourg: Publications Office of the European Union.
Cooper, M. (1994). Motivations for alcohol use among adolescents: development and validation of a four-factor model. Psychological Assessment, 6(2), 117–128.
Corazza, O., Simonato, P., Corkery, J., Trincas, G., & Schifano, F. (2014).“Legal highs”: safe and legal “heavens”? A study on the diffusion, knowledge and risk awareness of novel psychoactive drugs among students in the UK. Rivista di Psichiatria, 49(2), 89–94.
Cox, W. M., & Klinger, E. (1988). A motivational model of alcohol use. Journal of Abnormal Psychology, 97(2), 168–180.
Eurobarometer. (2011). Youth attitudes on drugs. Analytical report. Flash EB Series #330. Available at: http:// ec.europa.eu/public_opinion/archives/flash_arch_en.htm.
Eurobarometer. (2014). Flash Eurobarometer 401. Young people and drugs. Available at: http://ec.europa. eu/public_opinion/flash/fl_401_en.pdf
European Monitoring Centre for Drugs and Drug Addiction. (2014). European drug report 2014: trends and developments. Luxembourg: Publications Office of the European Union.
European Monitoring Centre for Drugs and Drug Addiction. (2017a). European drug report 2017: trends and developments. Luxembourg: Publications Office of the European Union.
European Monitoring Centre for Drugs and Drug Addiction. (2017b). High-risk drug use and new psychoactive substances. Luxembourg: EMCDDA Rapid Communication, Publications Office of the European Union. European Monitoring Centre for Drugs and Drug Addiction. (2018). European drug report 2018: trends and
developments. Luxembourg: Publications Office of the European Union.
Janicijevic, K. M., Kocic, S. S., Radevic, S. R., Jovanovic, M. R., & Radovanovic, S. M. (June 2017). Socioeconomic factors associated with psychoactive substance abuse by adolescents in Serbia. Frontiers in Phamacology, 8.
Kaló, Z., Paksi, B., Felvinczi, K., Demetrovics, Z. (2017). New psychoactive substances in Hungary: user groups and characteristics, patterns, motives, and problems in Hungary. In: 20th conference of the European Association of Substance Abuse Research. Venue and date of the conference: Nunspeet, Hollandia, 2017.05.18 21.p. 40.
Korf, D., Benschop, A., Werse, B., Kamphausen, G., Felvinczi, K., Dabrowska, K., Hernriques, S., Nabben, T., Wieczorek, L., Bujalski, M., Zs, K., Hearne, E., & Van Hout, M. C. (2019). How and where to find NPS users: a comparison of sampling methods in a cross-national survey among current users of new psycho-active substances. International Journal of Mental Health and Addiction. https://doi.org/10.1007/s11469-019-0052.
MacLeod, K., Pickering, Gannon, M., Greenwood, S., Liddell, D., Smith, A., Johnstone, L., Burton, G.: (2016) Understanding the patterns of use, motives, and harms of new psychoactive substances in Scotland. Final Report to the Scottish Government, November 2016.
Measham, F., Moore, K., Newcombe, R., & Welch, Z. (2010). Tweaking, bombing, dabbing and stockpiling: the emergence of mephedrone and the perversity of prohibition. Drugs and Alcohol Today, 10, 14–21.
https://doi.org/10.5042/daat.2010.0123.
Moore, K., Dargan, P. I., Wood, D. M., & Measham, F. (2013). Do novel psychoactive substances displace established club drugs, supplement them or act as drugs of initiation? The relationship between mephedrone, ecstasy and cocaine. European Addiction Research, 19(5), 276–282.
Neicun, J., Steenhuizen, M., van Kessel, R., Yang, J. C., Negri, A., Czabanowska, K., Corazza, O., & Roman-Urrestarazu, A. (2019). Mapping novel psychoactive substances policy in the EU: the case of Portugal, the Netherlands, Czech Republic, Poland, the United Kingdom and Sweden. PLoS One, 14(6), e0218011.
https://doi.org/10.1371/journal.pone.0218011.
Paksi, B., Demetrovics, Zs, Kaló, Zs, Felvinczi, K. (2017) Nagy kitettségű, speciális UPSZ használó csoportok szerhasználati szokásai In: [s.n.] (szerk.) Személyes tér - közös világ: A Magyar Pszichológiai Társaság XXVI. Országos Tudományos Nagygyűlése : Kivonatkötet. 347 p. Konferencia helye, ideje: Szeged, Magyarország, 2017.06.01-2017.06.03. Budapest: Magyar Pszichológiai Társaság, 2017. p. 195. 1 p. (ISBN:978–615–80241-4-3).
Paksi, B. (2017). ÚPSZ-használattal kapcsolatos epidemiológiai tapasztalatok az Országos Lakossági Adatfelvétel Addiktológiai Problémákról (OLAAP 2015) című kutatás alapján. In: Felvinczi Katalin (szerk.) Változó képletek.: ÚJ (abb) szerek: kihívások, mintázatak. 158 p. Budapest: L’Harmattan Kiadó, 2017b. pp. 45–68. (ISBN:978-963-414-120-4).
Paksi, B., Magi, A., Felvinczi, K., Demetrovics, Zs. (2016). The prevalence of new psychoactive substances in Hungary– based on a general population survey dealing with addiction related problems (OLAAP 2015). IV. International Conference on Novel Psychoactive Substances (NPS). Budapest, 30–31 May 2016. Potter, G. R., & Chattwin, C. (2018). Not particularly special: critiquing‘NPS’ as a category of drugs. Drugs:
Education, Prevention and Policy, 25(4), 2018–2336.https://doi.org/10.1080/09687637.2017.1411885. Schifano, F., Chiappini, S., Corkery, J. M., & Guirguis, A. (2019). Assessing the 2004–2018 fentanyl misusing
issues reported to an international range of adverse reporting systems. Frontiers in Pharmacology, 10, 46.
https://doi.org/10.3389/fphar.2019.00046.
Simons, J. S., Correia, C. J., Carey, K. B., & Borsari, B. E. (1998). Validating a five-factor marijuana motives measure: relations with use, problems, and alcohol motives. Journal of Counseling Psychology, 45(3), 265– 273.
Smith, K., & Flatley, J. (2011). Drug misuse declared: Findings from the 2010/2011 British Crime Survey England and Wales. London: Home Office.
Soussan, Ch, Andersson, M., Kjellgren, A. (2018). The diverse reasons for using novel psychoactive substances -a qu-alit-ative study of the users’ own perspectives. International Journal of Drug Policy, Volume 52, February 2018, p. 71–78.
Ch, S., & Kjellgren, A. (2016). The users of novel psychoactive substances: online survey about their characteristics, attitudes and motivations. International Journal of Drug Policy, 32(2016), 77–84. Sutherland, R., Peacock, A., Whittaker, E., Roxburgh, A., Lenton, S., Matthews, A., Butler, K., Nelson, M.,
Burns, L., & Bruno, R. (2016b). New psychoactive substance use among regular psychostimulant users in Australia, 2010–2015. Drug and Alcohol Dependence, 161(2016), 110–118.
Thanki, D., & Vicente, J. (2013). PDU (problem drug use) revision summary. European Monitoring Centre for Drugs and Drug Addiction. Luxembourg: Publications Office of the European Union.
Sutherland, R., Peacock, A., Whittaker, E., Roxburgh, A., Lenton, S., Matthews, A., & Bruno, R. (2016a). New psychoactive substance use among regular psychosti-mulant users in Australia, 2010–2015. Drug and Alcohol Dependence, 161, 110–118.https://doi.org/10.1016/j.drugalcdep.2016.01.024.
The ESPAD Group. (2016). 2015 ESPAD Report. Lisbon: EMCDDA.
Thurn, D., Kuntsche, E., Weber, J. A., & Wolstein, J. (2017). Development and validation of the amphetamine-type stimulants motive questionnaire in a clinical population. Frontiers in Psychiatry, 8(183).https://doi. org/10.3389/fpsyt.2017.00183.
Van Hout, M. C., Benschop, A., Bujalski, M., Zs, D., Dąbrowska, K., Felvinczi, K., Hearne, E., Henriques, S., Zs, K., Kamphausen, G., Korf, D., Nabbe, T., Silva, J., Wieczorek, L., & Werse, B. (2018). Health and social problems associated with recent novel psychoactive substance (NPS) use amongst marginalised, nightlife and online users in six European countries. International Journal of Mental Health and Addiction., 16(2), 480–495.
Werse, B., & Morgenstern, C. (2012). How to handle legal highs? Findings from a German online survey and considerations on drug policy issues. Drug and Alcohol Today, 12, 222–231.https://doi.org/10.1108 /17459261211286636.
Winstock, A. R., Lawn, W., Deluca, P., & Borschmann, R. (2015). Methoxetamine: an early report on the motivations for use, effect profile and prevalence of use in a UK clubbing sample. Drug and Alcohol Review., 35, 212–217.https://doi.org/10.1111/dar.12259.
Publisher’s Note Springer Nature remains neutral with regard to jurisdictional claims in published maps and institutional affiliations.
Affiliations
Katalin Felvinczi1&Annemieke Benschop2&Róbert Urbán1&Marie Claire Van Hout3&
Katarzyna Dąbrowska4&Evelyn Hearne5&Susana Henriques6&Zsuzsa Kaló1&Gerrit
Kamphausen7&Joana Paula Silva6&Łukasz Wieczorek4&Bernd Werse7&Michal
Bujalski4&Zsolt Demetrovics1&Dirk Korf2
1
Institute of Psychology, ELTE Eötvös Loránd University, Izabella utca 46, Budapest H-1064, Hungary
2 Bonger Institute, University of Amsterdam, Amsterdam, Netherlands 3 Public Health Institute, Liverpool John Moores University, Liverpool, UK 4
Institute of Psychiatry and Neurology, Warsaw, Poland
5
School of Health Sciences, Waterford Institute of Technology, Waterford, Ireland
6 Centre for Research and Studies in Sociology, University Institute of Lisbon, Lisbon, Portugal 7