Compensating for Source Depth Change and Observing Surface Waves Using
Underwater Communication Signals
Salman Ijaz, António Silva, Sérgio. M. Jesus
Institute for Systems and Robotics University of Algarve, Gambelas CampusFaro, Portugal
{ssiddiqui,asilva,sjesus}@ualg.pt
Abstract— Underwater communications impose great
challenges due to the unpredictable changes in the environment. In order to accommodate for these changes, equalizers are used to track the Impulse Responses (IRs) and compensate the intersymbol interference (ISI). Source and array depth shifts are one of the major contributing factors to continuous amplitude and phase changes in IR. These changes magnify the problem of data processing in which correlation between successive received signals is involved, e.g. passive Time Reversal (pTR) where a probe signal is sent ahead of the data for post cross-correlation. In this paper, an environment based algorithm is used for pTR equalization, where an appropriate frequency shift of the estimated IR compensates for the geometric changes such as source and array depth shifts. We have applied this Frequency Shift pTR equalizer (FSpTR) on real data collected from Underwater Acoustic Barrier 2007 (UAB’07) sea trial having 1000 baud BPSK signaling at carrier frequency of 6.25 KHz with a sudden source depth change of 0.5 m at various known instants of time. The results illustrate that a considerable gain can be attained using the environment based equalizer in the presence of source and/or array depth changes. Moreover by close analysis of the FSpTR results we have detected surface wave motion through the frequency shifts caused by the array depth variations.
Keywords - Underwater Communication; waveguide invariants; Passive Time Reversal.
I. INTRODUCTION
One of the most active research topics nowadays is to design effective signal processing techniques for underwater communications. This interest is magnified by the challenges due to uncontrollable conditions such as temperature, bottom bathymetry and geometric changes like source and array depth variations. The attainability of even modest data rates is still a challenge due to these variations. In recent research literature we can find many channel estimate based equalizers used to cope with these changes [1-3]. Channel estimate based equalizers are those for which observations of the received signal are used to estimate the channel impulse response and possibly the statistics of interfering noise. Some examples are Channel Estimate based Decision Feedback equalizer (CE-DFE), linear MMSE equalizers (L-MMSE) and passive Time Reversal equalizer (pTR) [4-6]. In pTR, a receive only array is used and a probe-signal is transmitted ahead of the data for channel Impulse Response (IR) estimation. The IR estimate is then used as a synthetic channel for the temporal focusing
of the data signal, which is equivalent to the deconvolution of the multipath generated by the real channel.
In correlation-based equalizers like pTR, source and array depth shifts are the major bottlenecks due to continuous amplitude and phase changes in the IR. In order to address this problem many solutions have been proposed, which include (i) to transmit a probe signal more frequently (ii) to use an adaptive algorithm to track the IR from the initial probe signal IR estimation [7] and (iii) to use a low complexity equalizer with only one coefficient per channel [8].
In this paper, an environment based pTR equalizer is used, which is based on waveguide invariant properties of underwater channels [9]. It is found that by using these waveguide invariants geometric changes such as source and array depth can be compensated by applying an appropriate frequency shift on the IR estimate during probe signal transmission. By doing so the output power of the Frequency Shift pTR (FSpTR) equalizer will increase resulting in lower MSE [10].
In this paper, we have processed real data collected from UAB’07 sea trial. The UAB’07 experiment was performed during the first two weeks of September 2007 starting from 4th of September till 13th of September. The communication experiment conducted during UAB’07 aimed at testing the performance of the FSpTR [10]. During the sea trial sudden changes of 0.5 m were made in the source depth at various known instants of time. The results show that FSpTR successfully tracked these changes and applied appropriate frequency shift in IR to compensate for these changes resulting in a gain in MSE and bit error rate. The results from the FSpTR equalizer also enabled us to compensate for the array depth variations, caused by the surface waves. The paper is organized as follows: Section II presents a brief introduction of pTR in stationary environment, Section III describes the pTR performance loses in cases of source and array depth changes and illustrates how the frequency shift compensates for these changes, Section IV provides a description on operations performed on the real data and the results obtained by the FSpTR equalizer, Section V concludes the paper with a brief summary and future work.
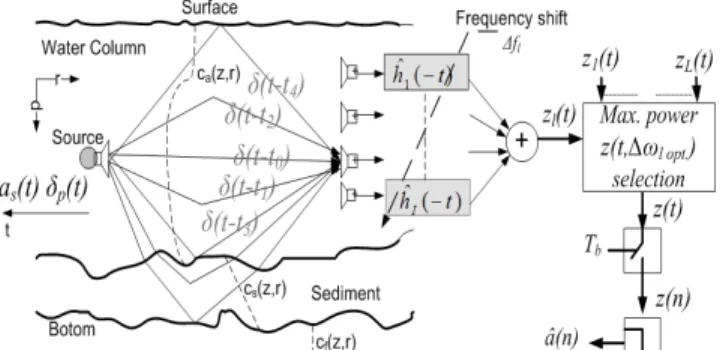
II. PASSIVE TIME REVERSAL COMMUNICATION A passive time reversal communication system is a point to multipoint system consisting of a source and a vertical line array (VLA). In Fig.1, on the left, we can see first the probe 2010 Fourth International Conference on Sensor Technologies and Applications
Figure 1. : Probe and data signals underwater propagation (left); Block diagram of FSpTR equalizer (right): (i) filtering of hydrophone received data with time-reversed FS IR estimates, (ii) addition of filtered signals for each FS, (iii) selection of the FS signal with the maximum power, (iv) down-sampling to the symbol rate and (v) estimate of transmitted symbols signal transmission, which reaches the array through several paths. Assuming that all the multipaths are cleared, then the data stream is transmitted. On the right side the basic implementation of the FSpTR is shown. It behaves as a matched filter demodulator of the IR. A set of frequency shifts is applied to the IR and correlated with the received data. The optimal frequency shift is selected based upon the maximum power selection block with the power being computed in time slots for large data sets and represents different frequency shifts. In case of no geometric changes, like source and array depth changes, there is no frequency shift and the FSpTR acts like the conventional pTR.
In pTR, the resulting synthetic IR acoustic field is the sum of convolutions between the channel IRs during probe transmission and channel IRs during data transmission [4]. The acoustic field generated by a monochromatic point source in perfect waveguide at the hydrophone of the VLA is given by the Green’s function [10]
G R, z , z , ω j ρ√8πRe Z z Z z k M e R 1
where m is the mode number, M is the total number of propagating modes, ρ is the water column density, R is the source-array range, . is the mth mode shape, is the
source depth, is the hydrophone depth and is the
mth mode horizontal wavenumber. In frequency domain the
synthetic pTR IR acoustic field in a stationary environment is given by P R, z , z , ω G I R, z , z G R, z , z 1 ρ 8πR
Z
mz
0Z
nz
0 k k M M Ψ m, n e R R (2)where , is the product of mode shape functions, summed over all hydrophones. Assuming that the array spans the entire water column and the hydrophones depth sampling is dense enough to fulfill the modal orthognality property [2], we have
Ψ m, n Z z Z z
I
δ , 3
Replacing (3) in (2) and after simplification we have
P . 1 ρ 8πR |Z z | |k | M 4
since (4) is weakly dependent on frequency and it results that in time domain we have dirac impulse. In the case of source-array range and source-array depth variations this dirac is strongly corrupted.
III. GEOMETRIC MISMATCH AND FSpTR COMPENSATION In the presence of geometric mismatch between the probe and the data, equation (2) becomes
P . , ∆ G
I
R ∆r, z ∆z , z ∆z G R, z , z 5 where ∆ represents the geometric mismatches for example ∆r represents source-array range change, ∆z and ∆z represent source and array depth changes respectively. In such condition (4) becomes frequency dependent.
In [11] it was shown that the geometric changes can be compensated by applying a frequency shift ∆ so (5) becomes
P . . ∆: ∆ω G
I
R ∆r, z ∆z , z ∆z G ∆ R, z , z 6
When the geometric mismatch is only due to the range shift, the frequency shift ∆ is given by
∆ω ω
R∆rβ 7 where is the center frequency, is the source array range and the horizontal waveguide invariant. In [9] the existence of was firstly studied in real environment. In [12] an appropriate frequency shift is applied in active time reversal to refocus at ranges other than that of probe sources using and in [11] the waveguide invariants were first applied to compensate for the source array range variability in communication systems.
Figure 2. Source/array transect
In [13, chapter 4] the range variability compensation concept is extended to source depth through
∆ω ω
R∆z ζ 8 where ζ is the vertical waveguide invariant for the source depth shift. For array depth shift this expression becomes
∆ω ω
R∆z ζ 9 where ζ is the vertical waveguide invariant for the array depth shift [13, chapter 4].
The vertical waveguide invariants ζ and ζ used for source depth ∆ and array depth ∆ respectively are dependent on the sound speed profile and in real conditions there values become depth dependent. In the presence of more than one variable effect (source-array range, source depth or array depth), the resulting frequency shift is given by
∆ω ∆ω ∆ω ∆ω 10 In the following, only the source and the array depths will be considered.
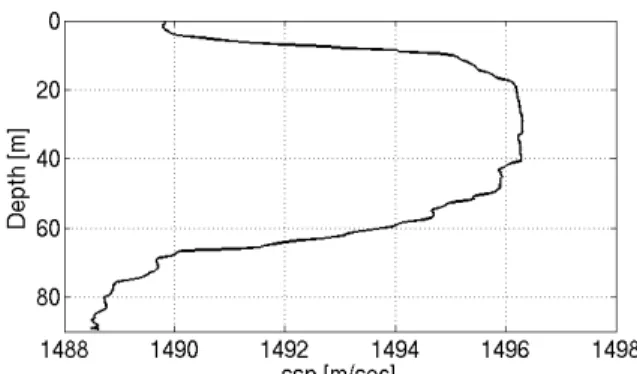
Figure 3. Sound Speed Profile, CTD measured by the research vessel Gunnerus
IV. DESCRIPTIOIN OF EXPERIMENT AND RESULTS The communication experiment conducted during UAB'07 aims at field testing the FSpTR. The FSpTR minimizes the MSE by taking in consideration the properties that are varying during the data transmission. In its present implementation, the FSpTR [11] allows for the compensation of the source/receiver depth and source-receiver range variations by acting as a matched filter as shown in Fig. 1. The experiment described in this paper was specifically designed for demonstrating with real data that the source depth variation results in a channel IR frequency shift and the knowledge of such frequency shift can be used to improve the communication performance.
Figure. 2 shows the underwater environment during the experiment. This diagram approximates the bottom environment as we do not have the exact bathymetry map. In order to make the diagram we have approximately digitized a bathymetry map of the area where the experiment was performed. The source was suspended by a crane from a fixed platform, 10 m from shore, at an initial depth of 5 m. The receiver was a vertical array with 16 hydrophones uniformly spaced at 4 m between 6 m to 66 m depth. The communication range was approximately 1 km with the bottom depth 12 m at source location to about 120 m at array location. The carrier frequency of 6250 Hz was used. The transmitted signal comprises of 50 chirp signals followed by a data set of 100 seconds. The chirp transmission was used for the channel IR estimation and to study the channel variability and Doppler spread. Each chirp has a bandwidth of 2 KHz ranging from 5.5 to 7.5 kHz with 0.1 sec duration whereas data bandwidth ranges from 5.5 to 7.5 kHz with PSK-2 modulation and baud rate of 1000 bits/sec.
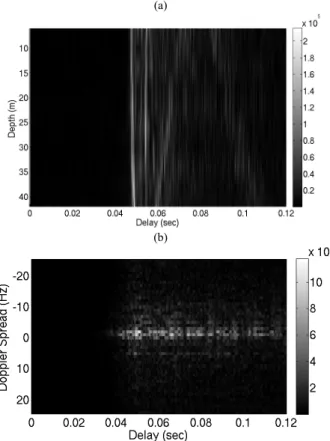
Figure 3 shows the sound speed profile during the experiment, where we can clearly see the stable behavior in the middle of the water column that motivates us to use the top ten hydrophones for FSpTR processing. Figure 4a shows the IR estimates obtained by the correlation of the chirp signal with the received data at the top ten hydrophones. We can clearly see two strong arrivals and then the combination of unstructured multipaths. The Doppler spread of the channel is shown in Fig. 4b where we can clearly see a spread of upto 20 Hz. The Doppler spectrum is very complex, which illustrates the complexity of the underwater channel.
By using the crane, the source depth is changed at various known instants of time. This is called a YOYO experiment and is shown in Fig. 5 where the time axis illustrates the time starting from 12:40 pm. In section IV-A and IV-B the processed data sets 1 and 2 were acquired as shown in Fig. 5. The data collected from the sea trial is processed in the following steps: i) applying a band pass filter, ii) converting to base band by applying carrier frequency shift iii) obtaining IR estimation by pulse compression iv) saving IR and data in separate folders for further processing. Both the IRs and the data are then fed to the FSpTR equalizer.
(a)
(b)
Figure 4. Underwater Channel Characterization, a) Arriving patterns estimated by Pulse compression, b) Doppler Spread of the channel during
15 seconds, calculated at 5th hydrophone
Figure 5. YOYO experiment: Source depth variations over time The results are explained in two sections, where the first section elaborates the source depth compensation and the second section illustrates the detection of array depth changes using the FSpTR.
A. Source Depth Compensation
The first data set is taken between 12:45 pm to 12:46 pm, as indicated in Fig. 5. During this time interval the source depth is changed from 4 m to 4.5 m. Figure 6 shows the result of the initial 30 sec of the FSpTR output power associated with the frequency shift ranges from 200 Hz to -600 Hz. It can be seen that frequency shift, which gives the
Figure 6. FSpTR mean power as a function of time and frequency shift for 10 hydrophones (data set 1).
Figure 7. MSE comparison between FSpTR and pTR for 10 hydrophones with a source depth shift at 6 sec (data set 1).
maximum power changes from approximately 0 Hz to ~-350 Hz after 6 sec to compensate for the depth shift at that time. In Fig 7 the performance comparison between pTR (solid line) and FSpTR (dashed line) is shown in terms of MSE. We observe that the frequency shift can compensate for the depth shift since the MSE performance of the FSpTR is significantly better than the pTR after 6 sec. During the whole 30 sec there is a mean MSE gain of 1.2 dB that results in an improvement in Bit Error Rate (BER) from 10% to 5%.
The same procedure is applied to data set 2 taken between 12:42 pm and 12:43 pm in which there are two depth shifts from 4 to 4.5 m and 4.5 to 5 m at 12 and 42 sec respectively as shown in Fig. 5. The results are shown in Fig 8 and 9. Note that in Fig. 8 the FSpTR equalizer has successfully tracked the two source depth changes and applied appropriate frequency shifts, which are from 0 Hz to ~ 350 Hz for 4 m to 4.5 m and from ~ 350 Hz to ~350 Hz for 4.5 m to 5 m. Figure 9 shows the performance comparison in terms of MSE for pTR (solid line) and FSpTR (dashed line). For the MSE, it is interesting to see in both cases that, for the same depth variation it results a similar frequency shift i-e 350 Hz, nevertheless in the second case the FSpTR equalizer did not compensate for this source depth. On the other hand while analyzing the performance after the second depth shift, which is from 4.5 m to 5 m the FSpTR equalizer compensated very well and if we consider only this part of the signal we have a gain of
Figure 8. FSpTR mean power as a function of time and frequency shift for 10 hydrophones
Figure 9. MSE comparison between FSpTR and pTR for 10 hydrophones with a source depth shift at 44 sec
about 1.8 dB in MSE and BER improvement from 17.1% to 9.2 %. During the whole 65 sec there is a mean MSE gain of 0.8 dB that results in an improvement in BER from 12% to 9%. The lack of improvement in performance in the first part of the FSpTR output is an open question, which requires further investigation.
B. Array Depth Compensation
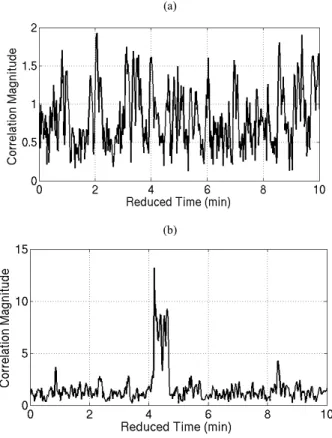
Analyzing the results of the FSpTR equalizer in Fig. 6 and 8 we find small oscillations, which are expected to be due to the array depth changes caused by surface wave motion. In order to clarify that the oscillations are due to the depth changes we have correlated a small set of FSpTR output (12 sec to 30 sec in Fig. 6 and 12 sec to 45 sec in Fig. 8) with the depths calculated from pressure data. The pressure data of ten minutes was taken from the pressure sensor, co-located with the array of hydrophones, between 12:38 pm and 12:48 pm and converted into depths by the method of [14]. However, the pressure data acquisition was made at 1 sample per second and it was later verified that it was aliasing contaminated.
Due to the depth signal aliasing and the non-linear relation between the array depth and FSpTR output the correlation of the signals fails to give clear result as we can see in Figs 10a for data set 1 and 11a for data set 2. The non-linear relation between the array depth variation and the frequency shift has been previously observed with real data in [13] and
(a)
(b)
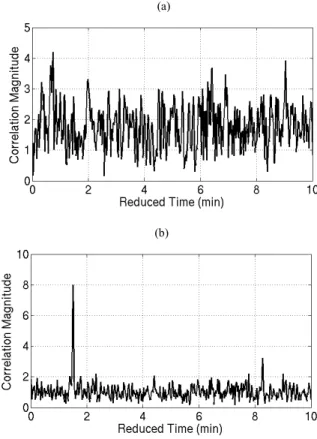
Figure 10. Correlation between pressure sensor data and output of the equalizer a) before, b) after frequency deviation compensation so eqn. (8) and (9) should be seen as the linear approximation. Assuming that the non-linear behavior results in a linear frequency deviation of the FSpTR output signal the inner product was recomputed after the frequency deviation compensation. The results are shown in Figs. 10b and 11b.
In the results we can see a maximum at 8.2 min in 10b and at 4.2 min in 11b, which clearly correspond to the moment when the data is taken as shown in Fig. 5.
Nevertheless there are some discrepancies as we can see in Fig 10b we have a strong peak at the wrong location and there are many small peaks in both the figures. The small peaks can be justified by the fact that the depth acquisitions have the same power spectrum density function throughout the signal, which induces periodicity. However the presence of a high peak at the wrong location still remains an open question, which will be addressed in future.
V. CONCLUSIONS AND FUTURE WORK
In this paper, we have used an environment based pTR equalizer (FSpTR), which compensates for some of the unpredictable changes in the underwater environment such as source and array depth shifts. The FSpTR is then tested with real data collected during UAB’07 experiment. The results have shown that FSpTR successfully tracked the source depth changes. During the experiment we have also
(a)
(b)
Figure 11. Correlation between pressure sensor data and output of the equalizer a) before, b) after frequency deviation compensation detected the frequency shifts caused by the array depth variations that are due to the surface waves motion.
This research has important implications in underwater communication as it enables us to study the effects of source and array depth change on the performance of the underwater communication system and helps in achieving acceptable bit error rates. Additional work is required to study the trends and the amount of frequency shift with the increase and decrease of source depth and, the improvement and degradation in the MSE performance with the source depth shift. Moreover in section IV B for the array depth compensation there are many open questions, which will be addressed in future. Current work in this domain has paved the way to future investigation, which will consequently enable us to understand the role of different physical parameters in the underwater communication channel.
ACKNOWLEDGMENT
This work has been supported by European Community's Sixth Framework Programme through the grant to the budget of the Integrated Infrastructure Initiative HYDRALAB III within the Transnational Access Activities, Contract no. 022441. It was also supported by Portuguese Foundation for Science Technology under UAB (POCI/MAR/59008/2004) and PHITOM (PTDC/EEA-TEL/71263/2006) projects. The authors would like to thank the R/V Gunnerus master and crew, HYDRALB III and SINTEF personnel for their support during UAB’07.
REFERENCES
[1] M. Stojanovic, L. Freitag, and M. Johnson, “Channel-estimation-based adaptive equilization of underwater acoustics signals,” in presceedings of IEEE Oceans’99 Conference, Seattle,WA 1999, pp 985-990.
[2] D. Rouseff, D. R. Jackson, W. L. J. Fox, C. D. Jones, J. A. Ritcey, and D. R. Dowling, “Underwater acoustics communication by passive phase conjugation: Theory and experimental results,” IEEE J. Ocean. Eng. 26, 821-831 (2001).
[3] J. Flynn, J. A. Ritcey, D. Rouseff, W. L. J. Fox, “Multichannel equilization by decision-directed passive phase conjugation: Experimerntal results,” IEEE, J. Ocean. Eng. 29, 824-836 (2004). [4] A. Silva, J. Gomes, S. M. Jesus and V. Barroso, “Underwater
Acoustic Communication using a Time-Reversal Mirror Approach”, 5th European Conference on Underwater Acoustics, Lyon, France. [5] G. F. Edelmann, T. Akal, W. S. Hodgkiss, S. Kim, W. A. Kuperman,
and H. C. Song, “An initial demonstration of underwater acoustic communication using time reversal,” IEEE J. Oceanic Eng. 27, 602-609 (2002).
[6] M. Heinemann, A. Larraza, K. B. Smith, “Experimental studies of applications of time–reversal acoustics to noncoherent underwater communications,” J. Acoust. Soc. Am. 113, 3111-3116 (2003). [7] J. A. Flynn, J. A. Ritcey, D. Rouseff, and W. L. J. Fox.” Multichannel
equalization by decision-direct passive phase conjugation: Experimental results”. IEEE J. Oceanic Eng., 29:824–836, 2004. [8] J. Gomes, A. Silva, and S. Jesus. “Adaptive spatial combining for
passive time- reversed communications”. J. Acoust. Soc. America, 124(2):1038–1053, August 2008.
[9] S.Chuprov, “Interference structure of a sound field in a layered ocean, ”. In L. Brekhovskikh and I. Andreevoi, editors, Ocean Acoustics,Currebt state, pages 71-91, Nuaka, Moscow, 1982.
[10] F. B. Jensen, W. A. Kuperman, M. B. Porter, and H. Schmidt, “Computational Ocean Acoustics” AIP series in modern acoustics and signal processing 2000, Pg 260.
[11] A.Silva, S.M. Jesus, and J. Gomes. “Environmental equilizer for underwater communications”. IEEE J. Oceanic Eng, 2007.
[12] H. C. Song, W. A. Kuperman, and W. S. Hodgkiss “Time-reversal mirror with variable range focussing” J. Acoust. Soc. Am. 103((6)):3234, June 1998
[13] A. Silva “Environment based underwater communications”, Ph.D dissertation, University of Algarve, 2009.
[14] UNESCO 1983 ”Algorithm for computation of fundamental properties of seawater, 1983”