PROPOSAL FOR THE USE OF
PATENTS IN RESEARCH OF
INTERORGANIZATIONAL
COLLABORATION NETWORKS
FOR INNOVATION
Ricardo Cruz Gomes
1; Geciane Silveira Porto
2; Priscila Rezende da Costa
3 Ricardo Cruz Gomes - Doutorando do Programa de Pós-Graduação em Administração de Organizações da Faculdade de Economia, Administração e Contabilidade da USP Ribeirão Preto , E-mail: [email protected]
Geciane Silveira Porto - Docente da Faculdade de Economia, Administração e Contabilidade da USP Ribeirão Preto e Pesquisadora do Instituto de Estudos Avançados da USP, E-mail: [email protected]
Priscila Rezende da Costa - Docente do Programa de Pós-graduação em Administração da Universidade Nove de Julho (Uninove), E-mail: priscilarc@uni.pro.br ABSTRACT: The application of Social Network Analysis
(SNA) techniques to investigate interorganizational networks for the development of innovations has attracted growing scientific and empirical interest. In this sense, patents are recognized as an important measure of innovation with valuable information, which are publicly available worldwide, allowing them to be applied to investigate these collaborative innovation networks. However, the information on patents made available by patent authorities in different countries varies in format, which could compromise the application of SNA and the interpretation of analyses. To solve this problem, this study aims to select, develop and present techniques for organizing and preparing a large amount of patent data, allowing data enrichment and enabling the construction and analysis of these networks. This study contributes to the dissemination of studies and applications of SNA in interorganizational innovation networks, supporting researchers and professionals.
KEYWORDS: social network analysis; networks;
interorganizational; patent; data preparation.
RESUMO: A aplicação de ARS para investigar redes
de parcerias para o desenvolvimento de inovações apresenta grande interesse teórico e empírico. Nesse sentido as patentes são reconhecidas como importante indicador de inovação dispondo de informações valiosas, que estão publicamente disponíveis no mundo todo permitindo sua aplicação para investigar essas redes de colaboração para inovação. Entretanto, as informações sobre patentes disponibilizadas pelas autoridades de patentes dos diversos países, geralmente apresentam diferentes tipos de formatos, o que pode comprometer a
aplicação de ARS e a interpretação da análise. Para resolver esse problema, esse estudo se propõe a selecionar, desenvolver e apresentar técnicas para organizar e preparar um grande volume de dados sobre patentes, viabilizando a construção e análise dessas redes. Essa pesquisa contribui para difusão de estudos e aplicações de ARS em redes de inovação interorganizacionais, apoiando pesquisadores e profissionais.
PALAVRAS-CHAVE: análise de redes sociais; redes;
interorganizacional; patentes; preparação de dados.
RESUMEN: La aplicación de ARS para investigar redes de
asociaciones para el desarrollo de innovaciones es de gran interés teórico y empírico. En este sentido, las patentes son reconocidas como un indicador importante de innovación con información valiosa, que está disponible públicamente en todo el mundo, lo que permite su aplicación para investigar estas redes de colaboración para la innovación. Sin embargo, la información sobre patentes proporcionada por las autoridades de patentes en diferentes países generalmente tiene diferentes tipos de formatos, lo que puede comprometer la aplicación de ARS y la interpretación del análisis. Para resolver este problema, este estudio tiene como objetivo seleccionar, desarrollar y presentar técnicas para organizar y preparar un gran volumen de datos de patentes, lo que permite la construcción y el análisis de estas redes. Esta investigación contribuye a la difusión de estudios y aplicaciones de ARS en redes de innovación interorganizacionales, apoyando a investigadores y profesionales.
PALABRAS-CLAVE: análisis de redes sociales; redes;
interorganizacionales; patentes; preparación de datos. * Agradecimento à FAPESP pelo fi nanciamento da pesquisa (processo /-).
526
.
INTRODUCTIONAs organizations at diverse levels are artic-ulated in partnership networks for the develop-ment of innovations, they have been the focus of numerous studies (Ahuja, ; Borgati & Halgin, ), including the evaluation and proposition of public policies (Bender et al., ; João, Porto & Galina, ; Ruby, ; Vanderelst, ). In this sense, Social Network Analysis (SNA) techniques are useful because they enable the interpretation and visualization of these interorganizational inno-vation networks (Van Der Valk & Gijsbers, ). Furthermore, patents are an important source of data on technological innovations, providing valu-able public information that is availvalu-able from patent authorities around the world, allowing them to be applied to investigate these collaborative innova-tion networks (Zuniga et al., ).
Patent documents have a unique structure and contain information such as the title, abstract, state of the art and the proposed solution, which is described as a novelty, the technological classi-fi cation and data on the owner(s) and inventor(s) (CNIPA & WIPO, ). However, this infor-mation that is made available by patent offi ces in diff erent countries usually has diff erent types of format in their respective databases. Th e lack of standardization regarding how data on owners and inventors are displayed in patents, according to the patent authority, can lead to heavy restrictions in terms of comparative analyses, compromising the application of SNA and the interpretation of these networks (Kumar, ; Wong, Ho, Saini, Hibbs, & Fois, ). To solve this problem, this work aims to select, develop and present techniques for organizing and preparing a large volume of data on patents, enabling the enrichment of content and the construction and analysis of these networks.
Th erefore, the main purpose of this study is to demonstrate how patent data can be structured and standardized to allow the application of SNA to investigate interorganizational collaboration networks. To achieve the central goal, this work begins with the literature on SNA and its appli-cation in studies of interorganizational innovation networks. Th e result of a survey is then presented on the means of collecting, organizing, preparing, standardizing and enriching data, as well as the construction and analysis of these networks.
Th erefore, this study contributes to the diff u-sion of studies and applications of SNA to inves-tigate interorganizational collaborative innovation networks, providing an aid to researchers and professionals. Moreover, it presents new techniques that enable the enrichment of information to analyze a large volume of data by classifying patent owners and extracting of their attributes, such as their nationality.
. APPLICATIONOFSNAINSTUDIESOFINNOVATION NETWORKS
Th e application of the SNA method to investi-gate cooperative networks, both scientifi c and tech-nological, is not only an innovative proposal but a way of observing this phenomenon more fully, since comparing diff erent networks and their structural characteristics using diff erent metrics enriches these analyses from diverse perspectives. Variants of these applications have been used for wide-ranging purposes, such as describing, comparing and explaining the evolution of networks and the profi le of actors (Cantner & Graf, ; Bazzo & Porto, ; Gomes, Galina, Vicentin, & Porto, ; João et al., ; Ruby, ; Souza, Moraes, Dal Poz, & Silveira, ), identifying and suggesting opportunities for collaboration (Bender et al., ), demonstrating the complementarity between technological and scientifi c activities (Wang & Guan, ), and analyzing the indi-vidual eff ects of collaboration networks on organi-zations (Kim, ), as summarized in Table .
. FUNDAMENTALSOFSNA
SNA addresses relationships between actors and enables the identifi cation of characteris-tics and structures in a set of complex relation-ships through statistical calculations and graphic systems. Its origins are in mathematics, specifi cally graph theory. It is founded on the relationship between sets of actors and allows a better inter-pretation of networks (Newman, ). Th e actors in a network, also known as nodes or vertices, may be people, organizations, institutions, objects, arti-cles, patents or others, depending on the objective of the analysis. It is possible to characterize each node according to its attributes and characteris-tics, such as universities, companies, governments
527
v. 8, n. 3 (2019): set./dez
Cantner & Graf ()
To describe the evolution of the innovative network in the region of Jena in Germany
Th e revolution of the network of innovators can be explained by the mobility of the scientists and the technological overlap (patents classifi ed in the same fi eld), rather than cooperation that occurred in the past.
Wang & Guan ()
To measure the relationship between scientifi c and
technological productivity in the fi eld of nanotechnology in China
Th e most active inventors and the most frequently cited authors mostly belonged to the same group, suggesting complementary eff ects between technological and scientifi c activities.
João et al. ()
To compare the innovation networks of the Bioen program of FAPESP in Brazil and the Biomass Program in the EUA
Th e study identifi ed diff erent stages of maturity in these programs, mapping the main actors and pointing out potential weaknesses in the Bioen network due to its high level of fragmentation and low density, whereas the Biomass Program proved to be more robust.
Ruby ()
To compare the cooperation networks for R&D in seven technological fi elds in terms of energy effi ciency in Denmark
Th e networks showed diff erences in their structural features, with some areas being denser and with shorter paths, while others were less interconnected, with a greater diversity of actors and relationships. Th e research centers were highlighted as directors of the network in each technological fi eld.
Bazzo & Porto ()
To analyze the evolution of the cooperation network for technological development of Petrobras with universities, research institutes and other companies
Th e network evolved in size and density throughout the period under study. Universities and research centers played an important role in strengthening the collaboration network, helping to plug structural holes.
Souza et al. () To describe the global scientifi c collaboration network in the fi eld of cellulosic ethanol
Th e actors of American origin showed higher rates of centrality and performance levels in publications, especially the universities.
Bender et al. ()
To analyze and map the global scientifi c collaboration network with institutions from Germany in the fi eld of Neglected Tropical Diseases (NTD)
Th e study identifi ed opportunities for collaboration through knowledge hubs and suggested strengthening the research capacity in low and medium income countries, which have little involvement in partnerships with rich countries.
Gomes et al. ()
To compare the evolution of social networks of biotechnology companies in Brazil and Spain
Th e network of biotechnology companies in Spain was denser and enjoyed greater diversity of partners, both local and foreign, and the R&D centers in Spain played a central role in attracting new entrants during the evolution of the network. In Brazil, universities were the main partner of the biotechnology companies.
Kim () To investigate the eff ects of the structure on the innovative performance of an organization.
Th e position of centrality in the structure of the interorganizational collaboration network positively aff ected the individual innovative performance of an organization.
Table 1 – Studies that use SNA to investigate collaborative innovation networks
528
and individual people, either locals or foreigners. Actors and their actions are viewed as interde-pendent rather than indeinterde-pendent (Wasserman & Katherine, ).
Th e existing relationships between actors in the network are considered the channels for the transfer or fl ow of tangible and intangible resources. Th ey are the so-called ties or links, and can represent a wide variety of relationships, including friend-ships, family, partnerfriend-ships, alliances, cooperation, citations, exchanges, monetary fl ow, properties and affi liations (Jackson, ).
Links have diff erent characteristics according to the types of relationships between the actors. In SNA, they can be characterized according to the intensity or direction of these relationships. A directed tie represents a fl ow in a single direction between actors, as in the case of a citation between patents or articles, or a monetary fl ow or fl ow of assets between countries. Directed ties are repre-sented on a graph by an arrow indicating the direc-tion of the fl ow from its origin to its destinadirec-tion. A set of directed ties can also determine the paths to reaching a certain actor in the network. On the other hand, undirected ties represent a two-way fl ow, as in the case of a friendship, family rela-tionship, partnerships, collaborations or alliances. Meanwhile, indirect ties establish relationships that are non-redundant, in which certain actors are not directly interconnected, but a relation-ship between them could be established through one or more intermediary nodes (Wasserman & Katherine, ).
A bipartite network or affi liation network represents the relationships between actors that are members of the same group or community of any nature. It has at least two types of actors, with one representing the original node and the other the community of which they are part. It could, for instance, be a network of co-authors of the same article, co-owners or co-inventors of a patent, advi-sors to a company or the purchases of an organiza-tion. A bipartite network can be transformed into a one-mode network, establishing the relationships between the actors that are members of a common network, making it possible to understand and analyze the relationships (Newman, ).
Th e concept of component has to do with the set of all the nodes that are directly or indirectly interconnected, allowing a determined actor to reach any other actor in the network via some path of connections through the network. Th is plays an
important role in cases such as diff usion, learning and contagion. A portion of nodes in a network are part of a component if there is a path through the ties, where any node can reach another node. Th e giant represents the largest cluster in the network, interconnecting the highest possible number of nodes (Jackson, ).
. PATENTDATA
A granted patent represents a legal monopoly for a limited time on a regional basis (every country is sovereign), designed to protect and encourage new inventions that have an industrial application. In return for the suffi cient disclosure of the idea claimed in the patent, its owner receives the exclu-sive right to produce and sell the innovation for twenty years, thus assuring investments in R&D and stimulating inventions by reducing the risk of imitation (Lindberg, ).
Patent documents are recognized as indicators of technological innovation, and analyses based on this information have a series of applications that range from measuring technological devel-opment to measuring the dynamism of the inno-vation process through analyses of cooperation or technological routes. Much of the information on technologies is only found in patent documents, to which all of society has access, helping to advance knowledge and the development of new technolo-gies. Diverse information can be found in a patent, such as a description of the innovation in question, state of the art and the claims regarding the novelty of the idea. Th e name(s) and address(es) of the owner(s) and inventor(s) are also included, along with patent and non-patent citations that indicate the origin of the invention, and the technological classifi cation in keeping with and standardized by the International Patent Classifi cation (IPC), along with other information (Zuniga et al., ). Th e recommendation for the IPC of the patent is made by the applicant and confi rmed at the time of analysis by the technician of the patent authority. Most countries use the IPC, which was established in through the Strasbourg Agreement, which is constantly updated and expanded. Th e IPC uses a hierarchical classifi cation of sections, classes, subclasses groups and subgroups. It is a powerful tool, which can be used by many patent offi ces, facilitating searches and identifying patents in certain fi elds of knowledge (WIPO, ).
529
v. 8, n. 3 (2019): set./dez
Th e inventor of a patent is always an individual person, who directly participated in conceiving the idea and/or developing the technology. Th e owner of a patent retains the rights to that inven-tion. Owners can be inventors or a public or private organization where the inventors work. (Zuniga et al., ). Co-ownership means that a patent has two or more owners, indicating that they eff ec-tively cooperated in the development of the inven-tion and intend to have a joint share in its results (Fischer, ).
As a patent can be fi led in diff erent countries, these documents are then classifi ed according to the priority number and can be unifi ed either through the fi rst application or the latest. Th is unifi ca-tion is known as a patent family (INPADOC), and it is carried out by the International Patent Documentation Center. In the scope of research on collaboration networks, this classifi cation is useful because it avoids including in the analysis dupli-cate inventions regarding coverage of protection in several countries simultaneously.
. METHODOLOGICAL ASPECTS FOR SNA STUDIES WITHPATENTS
In this article, a descriptive approach is used to propose a structured methodology to analyze secondary data, i.e., patents fi led in diff erent bases that were previously collected and organized.
Th e fi rst stage, data collection, includes methods for defi ning the scope of the analysis (technological fi elds, organizations, geograph-ical delimitation and others), as well as public and private sources for data collection on patent fi lings that include a number of offi ces on a global basis.
Th e next stage consists of organizing these data using databank construction techniques and selecting which information is useful for analyzing networks. Th is depends on the aim of the study and the means of identifying technologies that originated through partnerships between two or more organizations.
In the data preparation phase, techniques for cleansing the base are used, which includes removing duplicate information and excluding information that is not pertinent to a specifi c type of analysis, such as individuals when the focus of the network analysis is only at the interorgani-zational level. It also goes deeper in data refi ne-ment methods by applying specifi c algorithms in the OpenRefi ne software, enabling the massive
standardization of owners’ names. Th is stage avoids the presentation of duplicate organizations in the analysis, which tends to compromise the applica-tion of SNA and the interpretaapplica-tion of the results. Th is occurs because among the collected data there are many errors and variations in the spelling of the name of the same organization, which ranges from orthographic inconsistencies to the use of abbreviations.
Th is stage also makes advances in terms of tech-niques to enrich information for analysis, such as classifying patent owners according to their nature (e.g., universities, R&D centers, organizations and individuals) and extracting the nationality of these owners, adding valuable information to the anal-ysis of a large volume of data. Finally, means are presented of structuring the data and constructing networks at the intraorganizational level, and these data should be fed for analysis in Gephi software.
. THEPROCESSOFCOLLECTINGDATAONPATENTS
Following the conclusion of the construction of the theoretical framework and the proposed meth-odology, it is time select and collect data, prepare them and afterwards analyze them. Regarding the data selection and collection, this work presents some repositories with a global scope, some free and others paid, as well as strategies for defi ning the sample.
Th e selection and extraction of data on patents should consider the objective of the analysis. Th us, the fi rst step is to defi ne the search strategy, which may be structured using specifi c or combined criteria, such as:
a) Technological classifi cation codes (IPC), which allow studies of wide technological fi elds, or selection of specifi c technological niches;
b) Names of owners or inventors;
c) Priority country, which enables the verifi cation of the correlation between the technology and its geographical origin or destination, i.e., the target markets where the owners wish to have exclusive rights in the production or commercialization of the technology;
d) Key words in the title, abstract or claims to prove that something unprecedented was created and protected;
e) Date of publication, priority or fi ling;
f) Combination of above criteria using Boolean codes (AND, OR, NOT).
530
Th e temporal range of the analysis should also be defi ned, as the term of a patent is years, after which it enters the public domain. It should be highlighted that this period must be considered in
accordance with the research goal, since there are themes in which it is not a restrictive factor, such as in the study of collaboration networks. Some
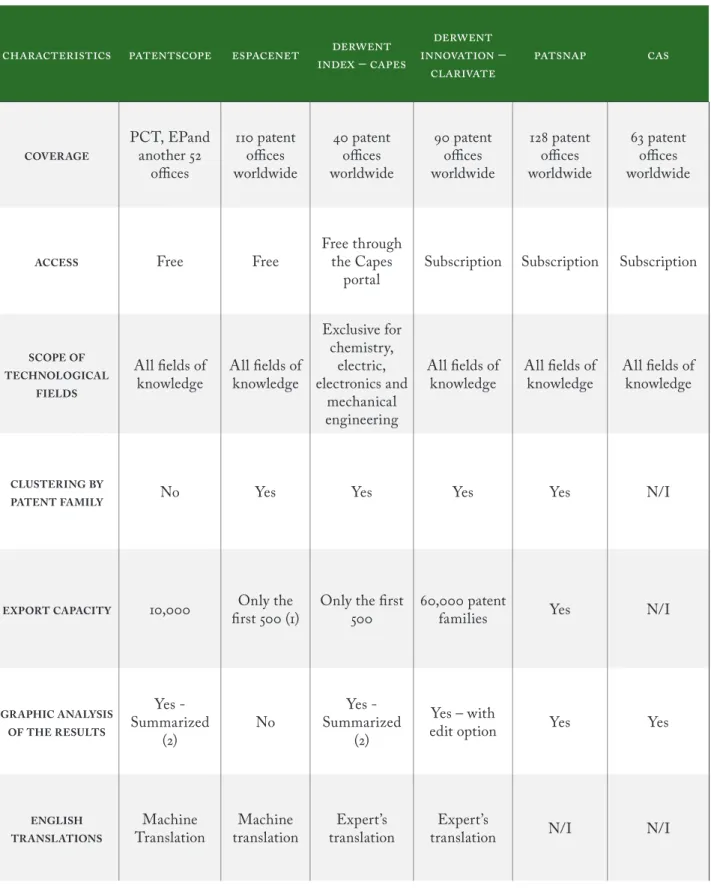
– – COVERAGE PCT, EPand another offi ces patent offi ces worldwide patent offi ces worldwide patent offi ces worldwide patent offi ces worldwide patent offi ces worldwide
ACCESS Free Free
Free through the Capes
portal Subscription Subscription Subscription
SCOPEOF TECHNOLOGICAL
FIELDS
All fi elds of
knowledge All fi elds of knowledge
Exclusive for chemistry, electric, electronics and mechanical engineering All fi elds of
knowledge All fi elds of knowledge All fi elds of knowledge
CLUSTERINGBY
PATENTFAMILY No Yes Yes Yes Yes N/I
EXPORTCAPACITY , fi rst ()Only the Only the fi rst , patent families Yes N/I
GRAPHICANALYSIS OFTHERESULTS Yes - Summarized () No Yes - Summarized () Yes – with
edit option Yes Yes
ENGLISH TRANSLATIONS
Machine
Translation translationMachine translationExpert’s translationExpert’s N/I N/I Table 2: Comparison of the characteristics of the main patent databases:
Notes:
1. Th e research criterion should be limited each time, such as reducing the period to reach up to 500 patents. 2. Analysis with information only on the main applicants, technological fi eld, inventors and geographical coverage N/I: Information is not publicly available.
531
v. 8, n. 3 (2019): set./dez
of the databases with information on patents with global coverage are shown in Table .
. PROCESSOFPREPARINGDATAONPATENTS
Th e data preparation stage presents the result of the search, development and application of a set of techniques and tools that enable an anal-ysis of networks through an extensive volume of data. Th is stage can generally be divided into four steps: organization of data, data cleansing, standardization of owners’ names and construc-tion of networks.
. ORGANIZATIONOFTHEDATA
To analyze each fi eld of technology, it is necessary to handle hundreds of tables. Th us, the broader the overview of the analysis, the greater the demands in terms of the “usability” of the base to be consulted.
After the data are extracted, they still need to be correctly prepared to enable the application of SNA techniques. In addition to requiring consid-erable eff ort to manipulate the data, a limiting factor of this stage preceding the analysis is the operational capacity of some software. To over-come such problems, it is necessary to create a database to store, organize and enable the stan-dardization of a large quantity of data on patents. Th erefore, once the data have been extracted from the platform, the fi rst step in the data orga-nization is the consolidation of the tables in a single database, containing only the information necessary to conduct the analysis. Th is task can be achieved, for example, through the use of SQL alongside Microsoft Excel.
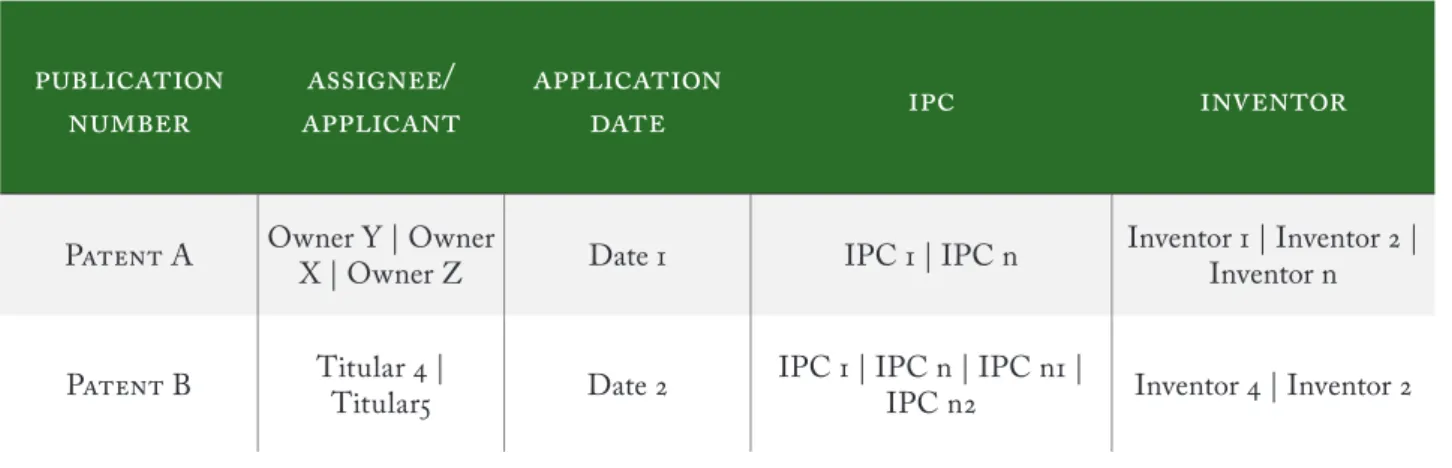
Th e second step is the creation of tables that allow the selection and treatment of data using data modeling techniques. As a model, the stan-dard data extracted from the Derwent Innovation platform (Clarivate) was used (Table ). Several items of information are found in the same cell using some kind of separator (e.g., “|”), which does not allow the establishment of relationships or the eff ectuation of standardization and cleansing. Th erefore, for each item of information that is useful for the analysis, it is necessary to construct a separate table: IPC, inventor, owner and others. In these tables, the data should be placed in lines to expand the data consolidated in a single cell (Table ). For this purpose, OpenRefi ne tools can be
used: command “Split Multi-valued cells” in the columns with consolidated data and the separator can be used as a criterion, followed by “Fill down” in the other columns to fi ll in the new lines created with the above values.
. DATACLEANSING
Th e data cleansing involves the exclusion of owners who are individuals (people) when the analysis level of the study is interorganizational, as patents can be found that are exclusively owned by one individual or a group of individuals. Th erefore, this information could aff ect the interpretation of the innovation networks at the interorganizational level. Due to the large volume of data, it is not feasible to perform this task manually. To address this limitation, it is assumed that the owners, when they are individual people, are listed as the inventors because they participated in the concept and invention. Th erefore, when inventors are iden-tifi ed who are also listed as owners, these can be removed from the database so that only organiza-tions remain in the fi eld of “owners”. A represen-tative sample of the data should also be checked manually to identify false inventors.
. STANDARDIZATIONOFOWNERS’ NAMES
Th e lack of data standardization, specifi -cally the names of the owners of the patents, is a serious problem when it comes to applying SNA, as it hinders an accurate analysis of the network (Wong et al., ; Kumar, ). In the collected data, there are many ambiguities due to the varia-tions in the spelling of a name, which range from minor orthographic inconsistencies to the use of diff erent variations, resulting in duplicities in the same “node” in the network. Th is tends to skew the application of SNA, compromising the inter-pretation of the results.
Since a wide variety of studies use SNA for large volumes of data, the standardization of the names of the owners of patents, if done manu-ally, would require a great deal of time and eff ort and could also lead to some inconsistencies being maintained. In this context, algorithms were sought that could overcome this restriction. OpenRefi ne software was selected, a free software Th is kind of check is important because some inconsistencies have already been identifi ed in the data, such as names of organizations that are listed as inventors.
532
with an open code, made available to the public by Google in .
OpenRefi ne has very useful tools for handling lost or duplicate data, making the task of stan-dardization faster and, especially, more reliable. Th ese tools enable the exploration, cleansing and handling of a large volume of data, and allow them to be connected with external data sources through the web. Th is enables enriched content of databases. To standardize owners’ names, clus-tering tools are used, which are operations that help to locate groups of words with diff erent values that may be alternative representations of the same thing and/or content. For this purpose, the soft-ware has introduced a select number of diff erent methods and clustering algorithms that can be eff ectively and effi ciently used with a wide variety of data, dividing them into two groups: key colli-sion methods and nearest neighbor methods.
Key collision methods are based on the idea
of creating an alternative representation of a value (key), which contains only the part with the highest value or meaning of a string of characters and comparing it with diff erent strings, based on the fact that the keys are the same (Fingerprint
and N-Gram Fingerprint). Two useful methods for addressing minor spelling errors are also included, errors due to misunderstood pronunciation or not knowing how to spell a word. In this case, the idea is that phonetically similar words will be clustered jointly (Metaphone and Cologne phonetic).
Fingerprint: this method uses a process to generate a key from a string. It removes leading and trailing whitespace, changes all characters into a lowercase representation and removes all punctuation and control characters. It also splits strings into whitespace-separated tokens, sorts the tokens and removes duplicates, joins the tokens back together, and normalizes characters using a standard western representation (ASCII). Th is method is considered simple and fast, with a wide range of applications and little probability of generating false positives.
N-Gram Fingerprint: A method similar to the Fingerprint method, the main diff erence being found when splitting the strings, as it uses as a separator the number of characters (n-grams) instead of whitespace. Th e process is in steps, as follows. It changes all characters to their lower-case representation, removes all punctuation,
/
P A Owner Y | Owner X | Owner Z Date IPC | IPC n Inventor | Inventor | Inventor n P B Titular | Titular Date IPC | IPC n | IPC n | IPC n Inventor | Inventor
Table 3 – Model of the format of the raw data
Source: Prepared by the authors
/
P A Owner Y Date
P A Owner X Date
Patent A Owner Z Date
Patent B Owner Date
Patent B Owner Date
Table 4 – Structure of the table to analyze co-ownership in patent bases
533
v. 8, n. 3 (2019): set./dez
control characters and whitespace and obtains all the string n-grams. It then sorts the n-grams and removes duplicates, joins the sorted n-grams back together and normalizes extended western charac-ters to their ASCII representation.
Metaphone (Philips, ): A phonetic algo-rithm that generally creates an index of the way words are pronounced, particularly generating, comparing and identifying the intended corre-spondence, especially for the English language, although it can function with other languages.
Cologne phonetic: An algorithm that attri-butes phonetic codes to the sounds of words so that words with the same sound have similar codes. It was created especially for German but can also be applied to other languages.
Nearest neighbor methods provide a
param-eter that represents a distance threshold between words. Th us, any pair of strings that are close to a certain value are clustered. Th is method requires more in terms of computational processing, as the values of all the strings need to be compared. Of the nearest neighbor methods, the following may be listed:
Levenshtein Distance: Th is algorithm is the implementation of the method developed by Levenshtein (). It measures the minimum number of edit operations (insertions, removals or substitutions of characters) necessary to change one string into another. Th e edit distances between all the strings are compared in order to relate the nearest ones.
Prediction by Partial Matching (PPM): Th is algorithm is the implementation of the research conducted by Li, Chen, Li, Ma and Vitányi () on a distance metric suitable for measuring simi-larities between sequences, based on the notion of Kolmogorov complexity.
Th e methods and algorithms for clustering words that were presented above are listed in order of complexity and demand for data processing capacity. Th us, to increase the eff ec-tiveness of the cleansing, it is advisable to apply all of them, in ascending order of complexity, beginning with the key collision methods that are computationally faster and ending with the nearest neighbor methods.
For each method applied, a list of suggested names is presented that might be duplicates. It then falls to the researcher to conduct a crit-ical analysis of the listed results to gauge and correct false positives. Th e work of verifying the
suggestions of standardization, albeit extensive, is much more effi cient than it being done manually, as reported by Wang and Guan (). Th is task is very time consuming and a great deal of eff ort is required to standardize the names of authors manually followed by an application of SNA.
Th e tools available in OpenRefi ne software, despite their high complexity, are easy to apply, and the user does not need advanced knowledge in programming for some of these activities. Th erefore, the software has attracted enthusiasts from diff erent fi elds, including librarians, journal-ists, analysts and researchers (Stonebraker, ). It is also possible to fi nd reports of its application in the standardization of metadata with external databases (Van Hooland et al., ), implementa-tion of data standardizaimplementa-tion protocols for names of drugs using the FAERS database (Wong et al., ), standardization of the names of researchers and addresses obtained from the SCOPUS base (Bender et al., ), and the successful standard-ization of . of the names of patent owners in the fi eld of biofuels in a sample of , partici-pants (Gomes, ). Th e methods used by Bender et al. () and Gomes () are in keeping with the proposal of this study, as they applied the OpenRefi ne data standardization tools to prepare data for SNA using Gephi software. As shown in the literature, the techniques presented here help to organize and successfully standardize a large volume of data, overcoming one of the main chal-lenges to research of this nature.
. CLASSIFICATIONOFOWNERS
To classify the inventors and/or actors according to their attributes, primarily the nature of the institution to which they are linked (Universities or R&D Institutes or Centers, either public or private, public or private companies, government agencies) or the geographical attri-butes (nationality according to the mailing address of the owner) techniques were developed to allow automation and application in a large volume of data, maximizing the success rate of the operation.
.. NATUREOFTHEOWNERS
To identify the actors of a scientifi c nature, such as a university, it is necessary to prepare a list US Food and Drug Administration Adverse Event Reporting System, which is considered by Wong et al. () as one of the largest drug reposi-tories in the world.
534
of terms in several languages related to learning institutions (academy, school, college, faculty, teaching, university), as well as abbreviations or variations of these terms, identifi ed manually, that may occur due to typing errors or some other related problem. For this purpose, the OpenRefi ne tool Word-facet was used, which allows the handling and verifi cation of the frequency of single words within names. To identify R&D institutes or centers, either public or private, a criterion was used that encompasses the occurrence of a set of terms (center, institute, laboratory, scientifi c, technology; research, development, research, investigation, R&D and research institute), also translated into several languages and including abbreviations and variations.
.. GEOGRAPHICALATTRIBUTES
As the information was obtained from diff erent patent authorities, the publication of owners’ mailing addresses can be in various formats and inconsistencies, when they are available, which is not always the case. When patents are published, they may include information ranging from the zip code, address, city or town, state or nationality, as the format, availability and order can vary greatly. Th e USPTO is the patent authority that best displays this information and this explains why studies involving this variable are often restricted to the American database.
Th erefore, it was decided that an algorithm would be developed using OpenRefi ne to iden-tify and extract the sequence of two letters that correspond to the universal standard for nation-ality acronyms. Th e technique applied by the algo-rithm seeks and extracts the fi rst, second and last occurrence of sequences containing the two letters together, which may be located at the initial or fi nal frontier, along with (or not) a symbol or space:
First occurrence: value.match(/.*?[-](\w{})[-].*?/)[] Second occurrence: value.match(/.*?[-]\w{}?[-](\w{})[-].*?/)[] Final occurrence: value.match(/.*[-](\w{})[-].*?/)[]
The next step is to calculate the frequency of the occurrences of nationality for each owner and select only that which represents the highest frequency of occurrences for that owner in all the patents collected for the case of studies in which the intention is to work with the unique-ness of the owner.
After manually verifying a random sample, and among the main actors in the network, this method was found to present the highest success rate for the identifi cation of the nationality of the owner in an automated way, in the format that the data were found and for a large volume of data. In patents fi led with the USPTO, the acronyms of states are also published. Th erefore, it is neces-sary to create an index of acronyms of these states and convert them into the acronym that represents their nationality (US). When one of the research goals is to identify the participation of Brazilian actors, a manual verifi cation is recommended of documents fi led at the National Intellectual Property Institute (INPI).
. CONSTRUCTINGTHENETWORKS
To construct and analyze the collaboration networks, only patents fi led in co-ownership are selected. Th ese networks are constituted by patents developed in cooperation, in other words, with two or more owners. Th is shared fi ling of a patent shows that the owners cooperated eff ectively in the development of their innovation and that they intend to share the results. Th is is usually done through the establishment of formal agreements between the parties (Fischer, ).
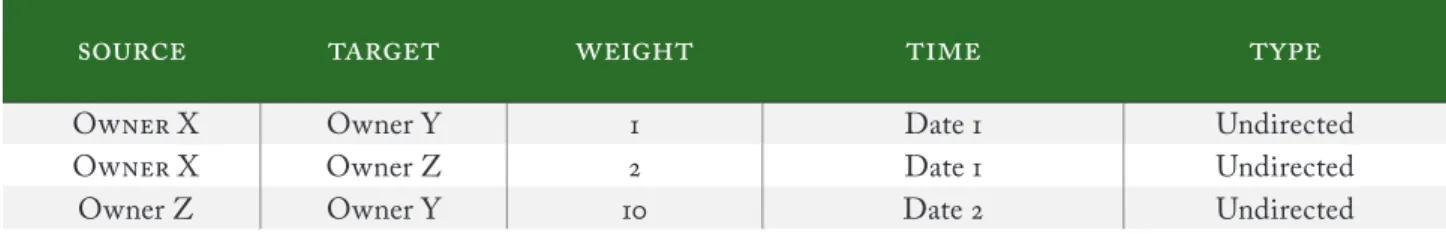
Th e data need to be manipulated to allow adequate input for Gephi software, which allows analyses of large networks, designs them and calculates the metrics necessary to interpret them (Bastian, Heymann, & Jacomy, ). For this purpose, it is necessary to feed the software with two tables of data, one relational and the other with the attributes of the actors.
To create the relational table of the owners, the data need to be handled and converted as follows: given a patent (A), which has three owners (X, Y, Z), the relationships will then be established among all of them (X-Y, X-Z, Y-Z). Initially, the data are found as shown in Table and are then converted for the model shown in Table . In addi-tion to establishing the relaaddi-tionships, it is neces-sary to calculate the frequency of patents among
535
v. 8, n. 3 (2019): set./dez
all of the actors, which is represented as the weight of this relationship.
To generate the table that establishes the rela-tionship between each owner that shares the same patent, a tool was developed using the VBA in Microsoft Excel, which establishes the relation-ship between each applicant for the same patent (Gomes & Visnardi, ).
With the conclusion of all of these steps, it is possible to begin the data analysis, applying SNA using Gephi, with the respective calculation of the measurements necessary to characterize and describe the structure of the networks and repre-sent the network in graphic form.
. ANALYSISOFCOLLABORATIONNETWORKS
After feeding the SNA software, the network analysis is begun. For this purpose, the nodes of the network represent the patent owners and are classifi ed according to their nature, which can be defi ned as universities, R&D centers, organi-zations and individuals, according to the specifi c objective of each study and the level of classifi ca-tion that is achieved. Furthermore, according to the geographical attributes, the nodes can be clas-sifi ed by the nationality of the mailing address.
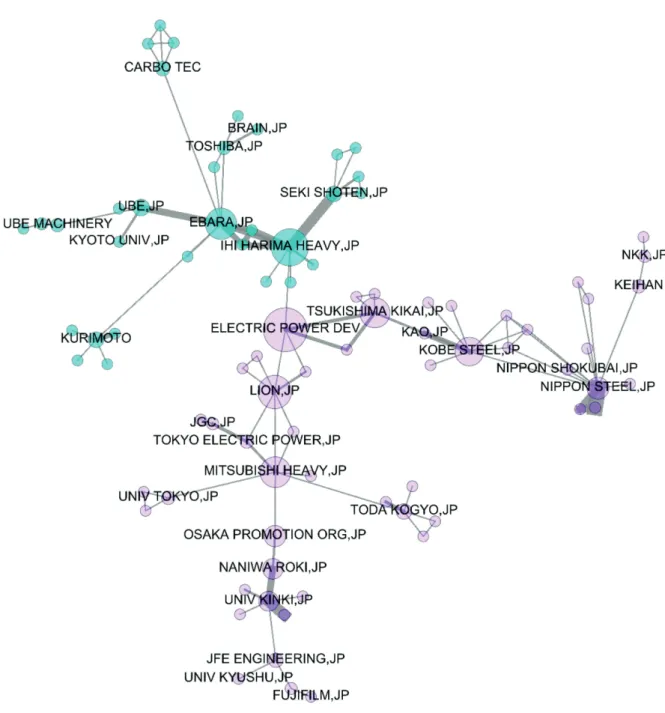
Th e ties in the network represent the sharing of at least one patent. Th ey are undirected because a collaborative relationship represents a two-way fl ow. Weights can be assigned to the ties according to the number of patents shared by the same owners. Th is weighting of relationships is in keeping with the concept of Granovetter (), in which the strength of a tie represents the frequency of rela-tionships over time. Th e collaborative interorgani-zational relationship for innovation in the fi eld of solid biofuels is illustrated in Figure .
Network analysis can be conducted at two levels, macro and micro. At the macro level, the characteristics of the network as a whole are described, while at the micro level the actors who are best positioned in the relationship structure
of the network are identifi ed. To operationalize SNA, Gephi software is recommended, which allows a graphic representation of the network and executes statistical calculations of the network, as it is open to having a discussion community and wide-ranging improvements. However, other kinds of software can also be used, including Ucinet and the igraph model of R software, each with functionalities that researchers can evaluate to determine the most suitable for their study.
. FINAL CONSIDERATIONS AND LIMITATIONS OF THESTUDY
Th is study presents a proposal for organizing the process of searching, selecting, developing and applying tools, algorithms and software to prepare and standardize a large volume of data on patents for the application SNA in interor-ganizational networks that are formed for the purpose of developing innovative technolo-gies. Th us, this study contributes to the fi eld by presenting means that allow the enrichment of analyses, enabling new research perspectives, such as those regarding the functional and geographical diversity in these networks.
As the tools presented are only intended for application in interorganizational innovation networks, in future studies this proposal should be adapted for applications in diff erent network analysis perspectives, such as technology prospec-tion, inventors, and mapping technological fi elds. Th erefore, depending on the scope of analysis, the tools that have been presented need to be adapted to allow the application of SNA.
https://github.com/gephi/gephi
O X Owner Y Date Undirected
O X Owner Z Date Undirected
Owner Z Owner Y Date Undirected
Table 5 – Model of a table of relationships between actors for Gephi software.
536
REFERENCES
Ahuja, G. (2000). Collaboration networks, structural holes, and innovation: A longitudinal study. Administrative Science Quarterly, 45(3), 425-455.
Bazzo, K. D. C., & Porto, G. S. (2013). Redes de cooperação da Petrobras: Um mapeamento a partir das patentes (Cap. 6. 163-208). In: Turchi, L. M. O., De Negri, F. O., & De Negri, J. A. O. Impactos tecnológicos das parcerias da Petrobras com universidades, centros de pesquisa e fi rmas brasileiras. Brasilia Bastian, M., Heymann, S., & Jacomy, M. (2009, March). Gephi: an open source software for exploring and manipulating
networks. In Th ird international AAAI conference on weblogs and social media.
Bender, M. E., Edwards, S., von Philipsborn, P., Steinbeis, F., Keil, T., & Tinnemann, P. (2015). Using co-authorship networks to map and analyse global neglected tropical disease research with an affi liation to Germany. PLoS neglected tropical diseases, 9(12).
Borgatti, S. P., & Halgin, D. S. (2011). On network theory. Organization science, 22(5), 1168-1181.
Figure 1 – Interorganizational collaboration network for innovation in solid biofuels
Source: (Gomes, 2017 p. 158)
Note: Th e colors represent the clustering calculated by the modularity, the size of the node represents the measurement of interme-diation and the thickness of the tie represents the volume of patents.
537
v. 8, n. 3 (2019): set./dez
Cantner, U., & Graf, H. (2006). Th e network of innovators in Jena: An application of social network analysis. Research Policy, 35(4), 463-480.
CNIPA - China National Intellectual Property Administration, & WIPO - World Intellectual Property Organization. (2019). Intellectual Property Basics: A Q&A for Students. Switzerland.
Fischer, F. (2005). O Regime de co-propriedade em patentes. Rev. Assoc. Bras. Propr. Intel.
Granovetter, M. S. (1977). Th e strength of weak ties. In Social networks (pp. 347-367). Academic Press.
Gomes, R. C. (2017). Redes de cooperação para desenvolvimento tecnológico dos biocombustíveis: mapeamento a partir de cotitularidade em patentes (Dissertação de Mestrado, Universidade de São Paulo).
__________, Galina, S. V. R., Vicentin, F. O. D. P., & Porto, G. S. (2017). Interorganizational innovation networks of Brazilian and Spanish biotechnology companies: Dynamic comparative analysis. International Journal of Engineering Business Management.
__________, & Visnardi, F. (2019). Convert two-mode networks to one-mode networks - vba macro (Version V1.0.0) [Software]. Zenodo. http://doi.org/10.5281/zenodo.3475658. Van Hooland, S., Verborgh, R., De Wilde, M., Hercher, J., Mannens, E., & Van de Walle, R. (2013). Evaluating the success of vocabulary reconciliation for cultural heritage collections. Journal of the American Society for Information Science and Technology, 64(3), 464-479.
Jackson, M. O. (2010). Social and economic networks. Princeton University Press.
João, I. S., Porto, G. S., & Galina, S. V. R. (2012). A posição do Brasil na corrida pelo etanol celulósico: mensuração por indicadores C&T e programas de P&D. Revista Brasileira de Inovação, 11(1), 105-136.
Kim, H. S. (2019). How a fi rm’s position in a whole network aff ects innovation performance. Technology Analysis & Strategic Management, 31(2), 155-168.
Kumar, S. (2015). Co-authorship networks: a review of the literature. Aslib Journal of Information Management, 67(1), 55-73.
Levenshtein, V. I. (1966). Binary codes capable of correcting deletions, insertions, and reversals. In Soviet physics doklady (Vol. 10, No. 8, pp. 707-710).
Lindberg, V. (2008). Intellectual property and open source: A practical guide to protecting code. “ O’Reilly Media, Inc.”. Li, M., Chen, X., Li, X., Ma, B., & Vitányi, P. (2004). Th e similarity metric. IEEE transactions on Information Th eory. Newman, M. E. J. (2010). Networks an Introduction. Nova York: Oxford University Press.
Philips, L. B. F. (2009). U.S. Patent Application No. 11/890,334.
Souza, L. G. A., Moraes, M. A. F. D., Dal Poz, M. E. S., & Silveira, J. M. F. J. (2015). Collaborative Networks as a measure of the Innovation Systems in second-generation ethanol. Scientometrics, 103(2), 355-372.
Stonebraker, I. (2015). Good Library Data Made Better With Technology! Using OpenRefi ne and Google Fusion Tables in Academic Business Libraries Instruction. Academic BRASS.
Wang, G., & Guan, J. (2011). Measuring science–technology interactions using patent citations and author-inventor links: an exploration analysis from Chinese nanotechnology. Journal of Nanoparticle Research, 13(12), 6245-6262.
WIPO- World Intellectual Property Organization. (2019) Guide to International Patent Classifi cation. Disponível em: <https://www.wipo.int/export/sites/www/classifi cations/ipc/ en/guide/guide_ipc.pdf>
Wong, C. K., Ho, S. S., Saini, B., Hibbs, D. E., & Fois, R. A. (2015). Standardisation of the FAERS database: a systematic approach to manually recoding drug name variants. Pharmacoepidemiology and drug safety, 24(7), 731-737. Van Der Valk, T., & Gijsbers, G. (2010). Th e use of social network analysis in innovation studies: Mapping actors and technologies. Innovation, 12(1), 5-17.
Vanderelst, D. (2015). Social Network Analysis as a tool for research policy. PLoS neglected tropical diseases, 9(12). Zuniga, P., Guellec, D., Dernis, H., Khan, M., Okazaki, T., & Webb, C. (2009). OECD patent statistics manual. França: OECD Publications.