Article
An Evaluation System for University–Industry
Partnership Sustainability: Enhancing Options for
Entrepreneurial Universities
Art ¯uras Kaklauskas1,*, Audrius Banaitis1 ID, Fernando A. F. Ferreira2,3, João J. M. Ferreira4, Dilanthi Amaratunga5, Natalija Lepkova1, Ieva Ubart˙e1and Nerija Banaitien˙e1
1 Department of Construction Management and Real Estate, Faculty of Civil Engineering,
Vilnius Gediminas Technical University, Saul ˙etekio al. 11, 10223 Vilnius, Lithuania; audrius.banaitis@vgtu.lt (A.B.); natalija.lepkova@vgtu.lt (N.L.); ieva.ubarte@vgtu.lt (I.U.); nerija.banaitiene@vgtu.lt (N.B.)
2 ISCTE Business School, BRU-IUL, University Institute of Lisbon, Avenida das Forças Armadas,
1649-026 Lisbon, Portugal; fernando.alberto.ferreira@iscte.pt
3 Fogelman College of Business and Economics, University of Memphis, Memphis, TN 38152-3120, USA 4 Department of Business and Economics, NECE Research Unit, University of Beira Interior, Estrada do Sineiro,
6200-209 Covilhã, Portugal; jjmf@ubi.pt
5 Global Disaster Resilience Centre, School of Art, Design and Architecture, University of Huddersfield,
QSBG/22 Queens Street Building, Queensgate, Huddersfield HD1 3DH, UK; d.amaratunga@hud.ac.uk
* Correspondence: arturas.kaklauskas@vgtu.lt; Tel.: +370-5-274-5234
Received: 7 December 2017; Accepted: 3 January 2018; Published: 5 January 2018
Abstract: The concept of university-industry partnership sustainability (UIPS) stands for
well-adjusted progress among key players from universities and industry by sustaining their welfare, both in the present and in the future. This paper sought to develop an evaluation system for UIPS. The need for such a system is justified at three levels: the micro level (i.e., research and innovation performance, transfer and absorptive capability, and technology development), the meso level (i.e., institutional arrangements, communication networks, and local and indigenous rules) and the macro level (i.e., supply and demand, regulations, financing, taxes, culture, traditions, market, climate, politics, demographics, and technology). The UIPS evaluation system developed in this study offers the possibility of calculating a fair value of UIPS and providing recommendations for improving university–industry (U–I) partnerships. This can be of great importance for entrepreneurial universities that would like to strengthen their corporate links and/or reduce/reverse the “hollowing effect” of globalisation in disadvantaged regions. Additionally, this paper also contains discussions on the advantages, limitations, and managerial implications of this proposal.
Keywords: entrepreneurial universities; university–industry partnership sustainability; multiple criteria decision analysis; micro, meso, and macro environments
1. Introduction
Analyses of university–industry partnership sustainability (UIPS) have been discussed from different perspectives over the years [1–9]. This phenomenon is influenced by different integrated macro-level contexts (e.g., supply and demand, regulations, financing, taxes, culture, tradition, market, climate, political, demographics, and technology). It also depends on various factors on the micro level (e.g., research and innovation performance, transfer and absorptive capability, and technology development) and the meso level (e.g., institutional arrangements, communication networks, and local and indigenous rules) [10–16]. Salleh and Omar [17] present a review of various models that focus on collaboration management, the formation of a knowledge integration community, and research
collaboration activities between academia and industry. Plewa et al. [18] analysed the evolution of university industry linkage phases: pre-linkage that leads to an agreement to work together, establishment that leads to a contract, engagement that leads to the delivery of a project, advancement that leads to an ongoing partnership as well as word of mouth, and the latent phase that means potential future cooperation should a suitable project arise, with continuing personal linkage. Ankrah and Al-Tabbaa [19] employed a systematic procedure to review the literature on university–industry (U–I) collaboration. Ankrah and Al-Tabbaa [19] examined three main phases in U–I collaboration: formation (identifying partners, making contact, assessing partners, negotiation, agreement signing), organisational forms (informal and formal personal relationships, third party, targeted and untargeted formal agreements, focussed structures), and operational phase activities (meetings, communication, trainings, personal mobility, employment, other activities).
The effort to make the life cycle of U–I partnerships and their components more sustainable involved the development of a wide range of different databases, evaluation techniques and intelligent systems (i.e., expert, knowledge, fuzzy, embedded, and decision support mechanisms) [20–23]. The U–I interface system and the interactive academic–industry partnership database enable academic investigators and industry to match up their needs based on complementary knowledge, initiate contact, and work to develop effective partnerships [24].
U–I partnership approaches (e.g., multidisciplinary, linear, market-led, bottom–up, top–down, and cross-disciplinary, among many others) have limitations in terms of results, generalisations and practical impacts on the community [11,15,25]. The present study sought to address this gap by analysing some of the existing multiple criteria decision analysis (MCDA) methods and identifying possibilities for improving the effectiveness of the approaches towards UIPS evaluation. Specifically, the literature review suggests that the methods and systems currently available offer no possibility to calculate a fair UIPS value, and provide recommendations for improving U–I partnerships. Furthermore, the available techniques and software packages are unable to optimise the selected criteria, which might otherwise generate an opportunity for further developments.
The INvestment Value Assessments along with Recommendation provisions (INVAR) method [26] can be used for assessing a U–I partnership by using the same data as other MCDA methods. However, by applying the INVAR method, it is additionally possible to determine the fair value of a U–I partnership under consideration, optimise the parameters and composite parts of mutual cooperation, and provide well-informed recommendations for improving cooperative work. This means that the INVAR method can support the evaluation of U–I partnerships in a new form, thereby adding to the extant literature on U–I collaboration, entrepreneurship, and operational research.
The structure of the remainder of this paper is as follows. Section 2 presents a review of related work. Section 3presents the methodology and the INVAR method along with sketches of the components of the multiple criteria assessment system developed for UIPS. Section4presents a practical application of the developed UIPS system, and discusses its impact for entrepreneurial universities. Section5concludes the paper and lays the groundwork for future research.
2. Related Work
U–I collaborations have increased in number and variety over the past few decades [20,21,27–29]. These involve a wide range of UIPS variables, including databases and knowledge tools (e.g., software, expert, fuzzy, embedded, and decision support mechanisms). Figure 1 presents some of these elements, which are considered of extreme importance for increasing the entrepreneurial activity of universities [10,13,30].
Figure 1. Databases and datasets of university–industry partnership sustainability (UIPS) [31–40]. Garousi et al. [21] identify a significant number of themes and best practices in a U–I partnership by thematic analysis. These are namely: (1) holding regular workshops and seminars with industry; (2) assuring continuous learning from industry and academia; (3) ensuring management engagement basing research on real-world problems and showing explicit benefits to an industry partner; (4) exhibiting agility during a collaboration; and (5) co-locating the researcher on the industry side.
Several studies about entrepreneurial universities in high-impact journals from the Scopus database were analysed in order to identify research gaps and highlight forthcoming research. UIPS data and software are at the heart of an examination of an entrepreneurial university. However, it is worth noting that the level of U–I collaborations in software engineering is still relatively low compared with the amount of activity in each of the two communities separately [18,21,41]. Indeed, the analysis of prior research included Chen and Lin [20], Banal-Estañol et al. [31], Callaert et al. [32], Fuentes, Dutrénit [33], Hemmert et al. [34], Myneni et al. [35] and Perkmann et al. [36]. These papers suggest that the methods and systems currently available offer no possibilities to calculate a UIPS fair value, and provide recommendations for improving U–I partnerships. Furthermore, the currently available techniques and software packages are unable to optimise the selected criteria [23,37,38,42,43]. In other words, this means that the current methods and systems are not able to calculate the fair value of a UIPS under deliberation (for further discussion, also see [21,22,24,39,40,44–48]). This study aims to contribute to this under-researched area. These limitations can be resolved by applying the INVAR method. Following this method, the present study sought to develop an UIPS evaluation system and outline the possibilities for applying the system in real settings.
Figure 1.Databases and datasets of university–industry partnership sustainability (UIPS) [31–40].
Garousi et al. [21] identify a significant number of themes and best practices in a U–I partnership by thematic analysis. These are namely: (1) holding regular workshops and seminars with industry; (2) assuring continuous learning from industry and academia; (3) ensuring management engagement basing research on real-world problems and showing explicit benefits to an industry partner; (4) exhibiting agility during a collaboration; and (5) co-locating the researcher on the industry side.
Several studies about entrepreneurial universities in high-impact journals from the Scopus database were analysed in order to identify research gaps and highlight forthcoming research. UIPS data and software are at the heart of an examination of an entrepreneurial university. However, it is worth noting that the level of U–I collaborations in software engineering is still relatively low compared with the amount of activity in each of the two communities separately [18,21,41]. Indeed, the analysis of prior research included Chen and Lin [20], Banal-Estañol et al. [31], Callaert et al. [32], Fuentes, Dutrénit [33], Hemmert et al. [34], Myneni et al. [35] and Perkmann et al. [36]. These papers suggest that the methods and systems currently available offer no possibilities to calculate a UIPS fair value, and provide recommendations for improving U–I partnerships. Furthermore, the currently available techniques and software packages are unable to optimise the selected criteria [23,37,38,42,43]. In other words, this means that the current methods and systems are not able to calculate the fair value of a UIPS under deliberation (for further discussion, also see [21,22,24,39,40,44–48]). This study aims to contribute to this under-researched area. These limitations can be resolved by applying the INVAR method. Following this method, the present study sought to develop an UIPS evaluation system and outline the possibilities for applying the system in real settings.
3. Methodology and System Development
3.1. Methodological Processes
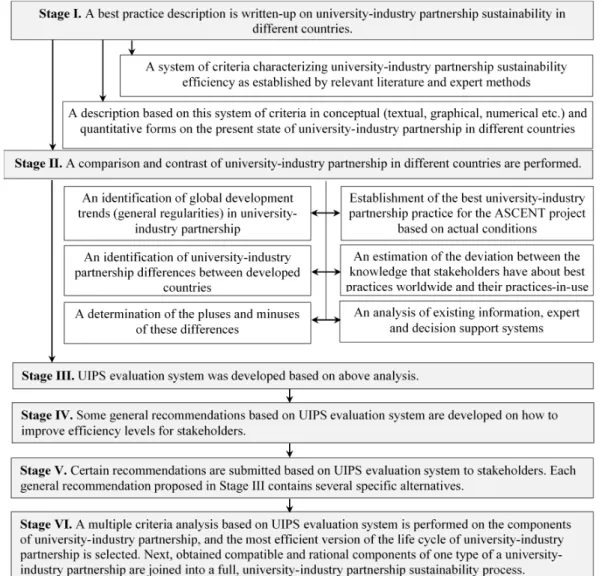
Johnson [49,50] investigated a U–I partnership spanning five stages. These are: (1) awareness, which includes career fairs and interviews; (2) involvement, which is related to industry affiliates, advisory programs, research grants, internships, and software grants; (3) support, which has to do with student consultancy, hardware grants, curriculum development, workshops and seminars, student organisation sponsorships, philanthropic support, and guest speaking/lectures; (4) sponsorship, which relates to university initiative sponsorships, undergraduate research program support, graduate fellowships, collaborative research programs, outreach programs, and support for education proposals; and (5) strategic partners, which involves executive sponsorships, joint partnerships, state education lobbying, major gifts, and business development. The author’s proposal was later adapted by Kaklauskas [26], Zavadskas and Kaklauskas [51], Kanapeckien ˙e et al. [52] and Urbanaviˇcien ˙e et al. [53]. This allowed a sequence of methodological procedures to be followed in order to address some of the limitations of the current UIPS evaluation systems. Figure2presents this sequence of methodological procedures specifically.
Sustainability 2018, 10, 0119 10.3390/su10010119 4 of 17
3. Methodology and System Development
3.1. Methodological Processes
Johnson [49,50] investigated a U–I partnership spanning five stages. These are: (1) awareness, which includes career fairs and interviews; (2) involvement, which is related to industry affiliates, advisory programs, research grants, internships, and software grants; (3) support, which has to do with student consultancy, hardware grants, curriculum development, workshops and seminars, student organisation sponsorships, philanthropic support, and guest speaking/lectures; (4) sponsorship, which relates to university initiative sponsorships, undergraduate research program support, graduate fellowships, collaborative research programs, outreach programs, and support for education proposals; and (5) strategic partners, which involves executive sponsorships, joint partnerships, state education lobbying, major gifts, and business development. The author’s proposal was later adapted by Kaklauskas [26], Zavadskas and Kaklauskas [51], Kanapeckienė et al. [52] and Urbanavičienė et al. [53]. This allowed a sequence of methodological procedures to be followed in order to address some of the limitations of the current UIPS evaluation systems. Figure 2 presents this sequence of methodological procedures specifically.
Figure 2. Sequence of methodological procedures adopted in this study.
A wide range of different MCDA methods have been applied for analysing UIPS alternatives. For example, Karsak and Dursun [54] use a fuzzy multi-criteria group decision making approach.
A wide range of different MCDA methods have been applied for analysing UIPS alternatives. For example, Karsak and Dursun [54] use a fuzzy multi-criteria group decision making approach. Chithambaranathan et al. [55] employ the ELimination Et Choix Traduisant la REalité (ELECTRE) (in English, ELimination and Choice Expressing Reality) and VIseKriterijumska Optimizacija I Kompromisno Resenje (VIKOR) (in English, Multiple criteria optimisation and compromise solution) approaches. Prakash and Barua [56] utilise the fuzzy Analytic Hierarchy Process (fuzzy AHP) and VIKOR methods. Deveci et al. [57] use the interval type-2 and fuzzy Technique for Order of Preference by Similarity to Ideal Solution (TOPSIS) methods. Büyüközkan et al. [58] integrate the fuzzy Axiomatic Design (fuzzy AD) and fuzzy AHP techniques, and the group decision making (GDM) approach. Yazdani et al. [59] exploit the COmplex PRoportional ASsessment (COPRAS) method. According to Mendoza and Prabhu [60], widespread use of these methods is due to a number of reasons, including the possibility of quantifying complex phenomena and supporting decision-makers in situations where multiple—and possibly conflicting—criteria and alternatives need to be regarded.
Frequently different results are obtained using different multiple criteria decision-making (MCDM) methods when solving the same problem with identical criteria, the same values, and the same weights. The determination of the best multiple criteria analysis method always caused many disagreements and endless discussions. There is always an array of competing methods. It is usually very difficult to ascertain whether the answer obtained by the application of some specific multiple criteria analysis method is correct or incorrect. The COPRAS method has been applied sufficiently broadly in scientific research worldwide, and it has been compared to other methods many times [61–65], etc. These scientific studies have shown that the COPRAS method is reliable.
However, it is worth noting that an application of the different functions of the INVAR method can expand the possibilities inherent in all of these methods (i.e., calculation of fair value, optimisation of different criteria, and provision of digital recommendations). The INVAR method has been applied in this study to strengthen the internal coherence of this evaluation system.
The main steps of the INVAR method are shown in Figure3.
The significances and priorities of the alternatives under deliberation are calculated in the first four stages based on data from the decision matrix (alternatives, criteria values, and weights). In the third stage, the significance/effectiveness (Qj) is established for each variant under comparison, whereas in the fourth stage, the priority of an alternative is established instead. The greater the Qj, the greater the effectiveness (priority) of an alternative. The generalised criterion Qjdepends directly and proportionately on the values xijand weights qiof the criteria under comparison.
In the fifth stage, the calculated utility degrees (Uj) of the variants under comparison directly depend on the criteria system, values, and weights defining them. The effort to determine the investment value of an object under assessment that would make it equally competitive on the market involved comprehensively assessing all of the positive and negative features of the objects under deliberation, which led to the recommended sixth stage for determining investment value. This stage involves calculating the investment value x1j (cycle e) by e cycles based on the decision matrix data (alternatives, criteria values and weights) and the utility degrees (Uj) of the alternatives, until the alternative aj under deliberation becomes equally competitive on the market with the candidate alternatives (a1–an).
The data from the decision matrix and the utility degrees (Uj) of the alternatives serve as the basis for performing the seventh and tenth stages, correspondingly as follows:
- the optimisation of value xijfor any criteria during e approximations;
- the calculation by approximation e cycle to determine what the value xij (cycle e)should be for the alternative ajto become the best among all of the candidate alternatives.
The criteria values and weights serve as the basis for calculating the minimising attributes S−j and the maximising attributes S+j that define the j variant. These serve as the basis for providing the quantitative recommendations in Stage 8 and Stage 9.
No No No No Yes Yes Yes Yes
Step 1. Calculation of the weighted normalized decision matrix, D. The weighted normalized value dij is calculated as: 𝑑𝑖𝑗= 𝑥𝑖𝑗∙𝑞𝑖
∑𝑛𝑗=1𝑥𝑖𝑗
,𝑖 = 1, 𝑚̅̅̅̅̅̅ , 𝑗 = 1, 𝑛̅̅̅̅̅ (1) and ∑𝑛𝑗=1𝑑𝑖𝑗= 𝑞𝑖 (2), where xij is the value of the i-th criterion in the j-th alternative of a solution; m is the number of criteria; n is the number of the alternatives compared;
qi is weight of i-th criterion.
Step 2. Calculation of the sums of beneficial attributes (S+j) and non-beneficial attributes (S-j). The greater the value S+j, the better is attainment of goals. On the other hand, the lower the value S-j, the better is attainment of goals. The values S+j and S-j are calculated as 𝑆+𝑗= ∑𝑖=1𝑚 𝑑+𝑖𝑗, 𝑆−𝑗= ∑𝑚𝑖=1𝑑−𝑖𝑗, 𝑖 = 1, 𝑚̅̅̅̅̅̅ , 𝑗 = 1, 𝑛̅̅̅̅̅ (3). The
sums of ‘pluses’ and ‘minuses’ of the alternatives are calculated, respectively, as 𝑆+= ∑𝑛𝑗=1𝑆+𝑗= ∑𝑚𝑖=1∑𝑛𝑗=1𝑑+𝑖𝑗, 𝑆−= ∑𝑛𝑗=1𝑆−𝑗= ∑𝑚𝑖=1∑𝑛𝑗=1𝑑−𝑖𝑗, 𝑖 = 1, 𝑚̅̅̅̅̅̅ , 𝑗 =
1, 𝑛 ̅̅̅̅̅ (4).
Step 4. Determination of the priority of the alternative. The greater significance Qj, the higher is the priority (rank) of the alternative. The relative significance Qj of the alternative j-th shows the degree of satisfaction attained by that alternative. The alternative with the highest relative significance value (Qmax) is the best choice among the candidate alternatives.
Step 3. Determination of the relative significances or priorities of the alternatives based on positive and negative alternatives characteristics. The relative significance
value (priority), Qj of each alternative j-th is defined as 𝑄𝑗= 𝑆+𝑗+ 𝑆−𝑚𝑖𝑛∙∑ 𝑆−𝑗 𝑛 𝑗=1 𝑆−𝑗∙∑ 𝑆−𝑚𝑖𝑛 𝑆−𝑗 𝑛 𝑗=1
, 𝑗 = 1, 𝑛̅̅̅̅̅ (5), where S─min is minimum value of S-j.
Step 5. Calculation of the quantitative utility degree of each alternative. The degree of an alternative’s utility is determined by comparing the candidate alternatives with
the most efficient one. Utility values of the candidate alternatives range from 0% to 100%. The utility degree Uj of each alternative j-th is calculated as 𝑈𝑗= (𝑄𝑗: 𝑄𝑚𝑎𝑥) ∙
100% (6), where Qj and Qmax are the significance of alternatives obtained from Eq. (5). The decision approach proposed in this section allows evaluating the direct and
proportional dependence of the significance and the utility degree of alternatives on a system of criteria, weights and values of the criteria.
Step 6. Determining the fair value x1j (cycle e) of the alternative aj can be by means of e approximation. The problem can be expressed as follows: What fair value x1j(cycle e) of the evaluated alternative aj will make it
equally competitive on the market with the candidate alternatives (a1-an)?
Step 8. Presenting indicator xij of the quantitative recommendation iij showing the percentage of a possible improvement in the value of indicator xij for it to become equal to the best value xi max of criteria Xi of the candidate alternatives is by the equation: iij = xij - xi max : xij × 100% (11).
Step 9. Indicator xij of quantitative recommendation rij showing the percentage of possible improvement of the utility degree Uj of the alternative aj upon presentation of xij = xi max. In other words, rij shows the percentage of possible improvement in the utility degree Uj of the alternative aj, supposing the value of xij can be improved up to the best value xi max of the indicator of criteria Xi. Calculation is by the equation:
rij = (qi × xi max) : (S-j + S+j) × 100% (12).
The quantitative recommendations iij and rij of value xij is presented in a matrix form.
Step 10. Step involves calculation by approximation e cycle to determine, what the value xij (cycle e) should be for the alternative aj to become the best among all the candidate alternatives. The problem can be expressed as follows: What value xij (cycle e) of the analysed alternative aj will make it the best, as per the candidate alternatives (a1-an)?
Reduction in the value xij (cycle e) of this alternative per 1 unit continues until the utility degree Uj e of the alternative under the alternative aj equals 100%.
Step 7. Carrying out the optimization of value xij is possible for any criteria during e approximations. It is necessary to calculate, what the optimized value xij (cycle e) should
be for alternative aj to be equally competitive with the candidate alternatives (a1 - an). Optimization of the value xij for any criteria relevant to the alternative aj may be determined by analysing beneficial and non-beneficial attributes of the candidate alternatives. Development of a grouped decision making matrix for the multicriteria analysis of the alternative occurs by calculating the optimization of value xij during e approximations of the analysed alternative. Steps 1-5 and 7 attains a set assessment
of all the beneficial and non-beneficial attributes of the alternative.
The corrected optimization of value xij (cycle e) for any criteria aj are calculated using the following equations:
Supposing 𝑈𝑗𝑒> ∑𝑛𝑗=1𝑈𝑗: 𝑛 and Xi is Xi-, then xij (cycle e) = xij (cycle 0) × (1 +e × r), 𝑒 = 1, 𝑟, Supposing 𝑈𝑗𝑒> ∑𝑛𝑗=1𝑈𝑗: 𝑛 and Xi is Xi+, then xij (cycle e) = xij (cycle 0) × (1 -e × r), 𝑒 = 1, 𝑟 (8a). Supposing 𝑈𝑗𝑒< ∑𝑛𝑗=1𝑈𝑗: 𝑛 and Xi is Xi-, then xij (cycle e) = xij (cycle 0) × (1 - e × r), 𝑒 = 1, 𝑟, Supposing 𝑈𝑗𝑒< ∑𝑛𝑗=1𝑈𝑗: 𝑛 and Xi is Xi+, then xij (cycle e) = xij (cycle 0)
× (1 + e × r), 𝑒 = 1, 𝑟 (8b), where r is the amount by which the optimization value xij (cycle e) of the alternative aj increases (decreases) by means of cycling, to satisfy Imparity
9. Xi+ (Xi-) – indicates that a greater (lower) criteria value corresponds to a greater (lower) significance for stakeholders.
Supposing the utility degree Uje of the alternative aj is greater than the average utility degree (Eq. 8a) of the candidate alternatives, it means the alternative aj is more favourable on average than the candidate alternatives. For the alternative aj to be equally competitive with the candidate alternatives (a2-an), reduce (increase) the value xij (cycle e) of its criteria (Eq. 8a) under analysis by an r amount over e approximations, until satisfying the following Imparity: |𝑈𝑗𝑒− ∑𝑛𝑗=1𝑈𝑗𝑒: 𝑛| < 𝑠 (9), where s is the
accuracy, by %, to be achieved by calculating the value xij (cycle e) of the analysed criteria of the alternative aj.
Supposing the utility degree Uje of the alternative aj is lower than the utility degree (Eq. 8b) is on average of the candidate alternatives, it means the alternative aj is less favourable on average than the candidate alternatives. For the alternative aj to be equally competitive with candidate alternatives (a1-an), increase (reduce) the value xij (cycle e) of its criteria (Eq. 8b) under analysis by an r amount over e approximations, until satisfying Imparity 9.
Supposing Imparity 9 is not satisfied, it means calculation of the value xij (cycle e) of the criteria under analysis of the alternative aj is not sufficiently accurate, and it is necessary to repeat the approximation cycle. By that the corrected revision of value xij (cycle e) of the alternative substitutes into a grouped decision making matrix of an
alternative’s multiple criteria analysis. Recalculate Eqs. (1-8) until satisfying Imparity 9.
There is a calculation of the optimization value xij (cycle e) for any criteria of the alternative aj. Upon satisfaction of Imparity 9, the use of Eq. (10) is to determine the optimization value xij (cycle e) for any criteria of the alternative aj: xij (opt value) = xij (cycle e) (10).
Supposing 𝑈𝑗𝑒> ∑𝑛𝑗=1𝑈𝑗: 𝑛, then continue increasing the value x1j (cycle e) of the
alternative aj by 1 unit and calculating as per Steps 1-6 with the gained decision making matrix until arriving at Imparity 𝑈𝑗𝑒< ∑𝑛𝑗=1𝑈𝑗: 𝑛 during e
approximations. Then the final value x1j (cycle e) equals the fair value: x1j iv = x1j (cycle e) (7).
Supposing 𝑈𝑗𝑒< ∑𝑛𝑗=1𝑈𝑗: 𝑛, then continue reducing the value x1j (cycle e) of the
alternative aj by 1 unit and calculating as per Steps 1-6 with the gained decision making matrix until arriving at Imparity 𝑈𝑗𝑒> ∑𝑛𝑗=1𝑈𝑗: 𝑛, during e
approximations. Then the final value x1j (cycle e) equals the fair value (Eq. 7).
Is the Imparity 𝑈𝑗𝑒< ∑𝑛𝑗=1𝑈𝑗: 𝑛 during e approximations satisfied? Is the Imparity 𝑈𝑗𝑒> ∑𝑛𝑗=1𝑈𝑗: 𝑛 during e approximations satisfied?
Is the Imparity |𝑈𝑗𝑒− ∑𝑛𝑗=1𝑈𝑗𝑒: 𝑛| < 𝑠 (9) satisfied?
Use of Eq. (10) is to determine the optimization value xij (cycle e) for any criteria of the alternative aj: xij (opt value) = xij (cycle e) (10).
Does the alternative aj become the best among all the candidate alternatives?
END
Figure 3. Key steps of the INvestment Value Assessments along with Recommendation provisions
(INVAR) method [26].
One of the most important stages of an MCDA application involves the establishment of a system of criteria describing the alternatives, measurement units, weights, and values. U–I partnerships relate directly to the quantitative and qualitative data of these alternatives by comprehensively describing
the alternatives under consideration. The system captures criteria X1–Xtalong with the information describing them (measuring units of the criteria [m1–mt], values [x11–xtn], and weights [q1–qt]) from the U–I partnership database (see Table1).
Table 1.Decision matrix [66].
Criteria Describing the
Candidate Alternatives * Weight Units
U–I Partnership Alternatives under Comparison
1 2 . . . j . . . n
University–Industry Partnership Database
X1 – q1 m1 x11 x12 . . . x1j . . . x1n X2 + q2 m2 x21 x22 . . . x2j . . . x2n . . . . Xi + qi mi xi1 xi2 . . . xij . . . xin . . . . Xt + qt mt xt1 xt2 . . . xtj . . . xtn Vk V1 V2 . . . Vj . . . Vn
*: The symbol “+/−” specifies that a bigger (smaller) criterion value corresponds to a bigger (smaller) importance for a user (stakeholder).
Based on this methodology, the INVAR method examines the existing intelligent and decision support systems in order to identify the most rational alternative, allowing a UIPS evaluation system to be developed. A step-by-step description of this process is presented in the next subsection.
3.2. Development of a UIPS Evaluation System
The analysis of information systems previously used in U–I partnerships (e.g., Kaklauskas and Zavadskas [67]) and the methodology presented in Section3.1helped to develop a new multiple criteria analysis system for U–I partnerships. This new system differs in the use of new, original, and MCDA methods. Specifically, it involves the analysis of a U–I partnership life cycle and its components (i.e., awareness, involvement, support, sponsorship, and strategic partner, as suggested by Johnson [49,50]). Following this, a UIPS evaluation system was developed based on the analysis of existing information and with the support of expert decision systems, as described in Figures2and3. This was accomplished to determine the most efficient alternatives of U–I partnerships.
4. Practical Application
4.1. Background
The Department of Construction Management and Real Estate (hereafter, CMRE) of Vilnius Gediminas Technical University (hereafter, VGTU) works in close collaboration with companies and organisations (e.g., Lithuanian Real Estate Development Association (LREDA), UAB Consultus Magnus, UAB EIKA, and Capital Experts) that operate in different fields. UAB Consultus Magnus operates in the sectors of transportation, education, social services, human resources, information technologies, environmental protections, business environments, and tourism. UAB Consultus Magnus provides consultations for preparing and implementing various projects with consideration of the needs and environmental features of specific companies, organisations, or public sector institutions. UAB EIKA is one of the largest real estate development and construction groups in Lithuania developing residential, commercial, and public sector building projects. Capital Experts assists in selling, purchasing, and leasing real estate, and offers consulting on different issues relevant to real estate. Together, the Lithuanian Real Estate Development Association (hereafter, Association), UAB EIKA, and Capital Experts participate in career fairs, where they always emphasise in their interviews the importance of CMRE-educated experts in real estate and construction management to the Lithuanian market. They also consult the CMRE Department students on different issues regarding their professional careers and other matters. Members of the Association and UAB Consultus Magnus, UAB EIKA, and Capital Experts companies participate in workshops and seminars held
by the CMRE department, deliver targeted lectures to CMRE students, take part in the Career Days held by VGTU, and engage in curriculum development studies programs of the CMRE Department. They are preparing the collaborative research program report in joint with the CMRE. Furthermore, these companies consult CMRE students and employees on business development issues.
The CMRE, the Association, UAB Consultus Magnus, UAB EIKA, and Capital Experts have jointly signed a partnership and support contract. These companies invite CMRE academics and students to conferences, seminars, and fairs that they organise in the fields of real estate and construction management and development. Each academic year, the head of the Association serves as chairperson of the defense committee that hears the oral defenses of the final projects for graduating the Property Management study program with a Bachelor’s degree. Additionally, the Association, UAB Consultus Magnus, UAB EIKA, and Capital Experts support the university and the CMRE department by offering suggestions for the undergraduate research program in consideration of Lithuanian market needs. The Association promotes state education. Furthermore, the Association, UAB Consultus Magnus, UAB EIKA, and Capital Experts help provide practice positions for students.
These U–I agents have recently signed a joint partnership agreement. UAB EIKA has established the EIKA Academy earmarked for first–fourth-year students who want not only to acquire theoretical knowledge at the university, but also to apply it in practice. This is an ongoing practice, which provides students with the opportunity to try out working at jobs tailored to their expertise. The EIKA Academy partnership can last from a half-year to several years, or until graduation. The Academy organises tours of objects under construction, and introduces the latest technologies that the construction sector has been applying.
4.2. Calculation of the UIPS Utility Degree
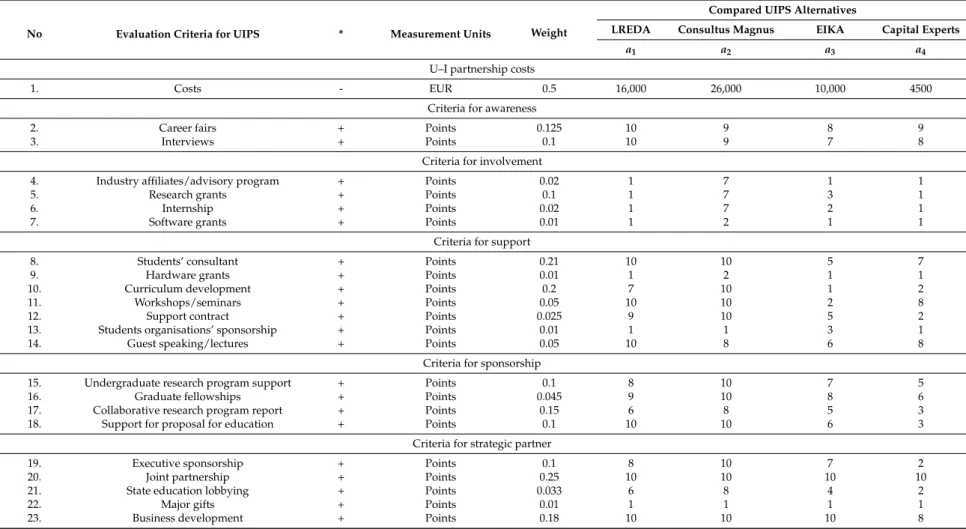
The present study analyses four alternative U–I partnerships (i.e., a1, a2, a3, and a4). Table2shows the data, which sums up the details about the four organisations in question related to a sustainable VGTU–industry partnership. The system of criteria was based on the partnership chart, which is also the source that served as the basis for the system of criteria developed by Johnson [49,50].
The following groups of criteria were analysed: awareness, involvement, support, sponsorship, and strategic partner. The criteria weights were determined by means of expert methods. A five-point Likert scale was used to capture the importance, or weights, of the evaluation criteria for UIPS. Thirty-nine UIPS experts contributed to the anonymous survey. Eighteen experts were representing the Department of Construction Management and Real Estate of the VGTU’s Civil Engineering faculty. Another 21 experts came from industry, representing the Lithuanian Real Estate Development Association, Consultus Magnus, UAB EIKA, and Capital Experts. For the evaluation of compared UIPS alternatives, a group of three experts was formed that consisted of university representatives (one head of department, and two professors). The group had to evaluate all criteria on a 10-point scale, where the least relevant criteria scored one point each and very important criteria scored 10 points each. The agreed integer number was used for further calculations. Table2enables a comparison of alternative U–I partnerships.
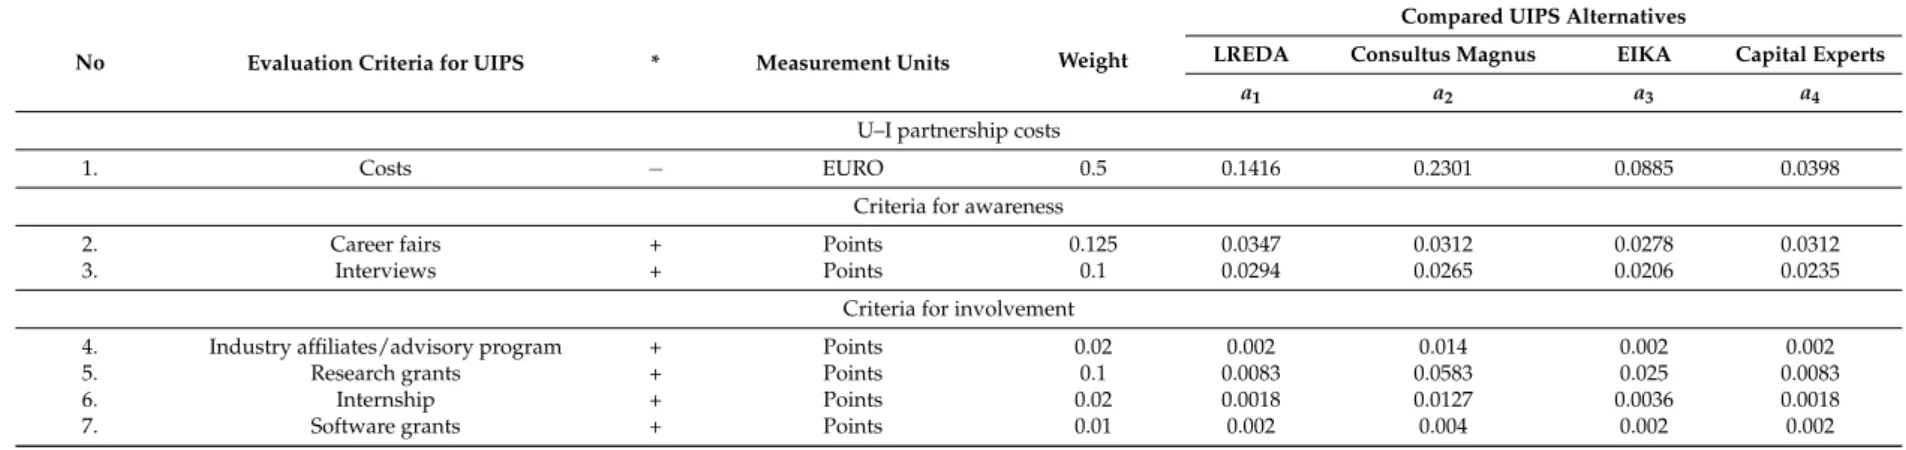
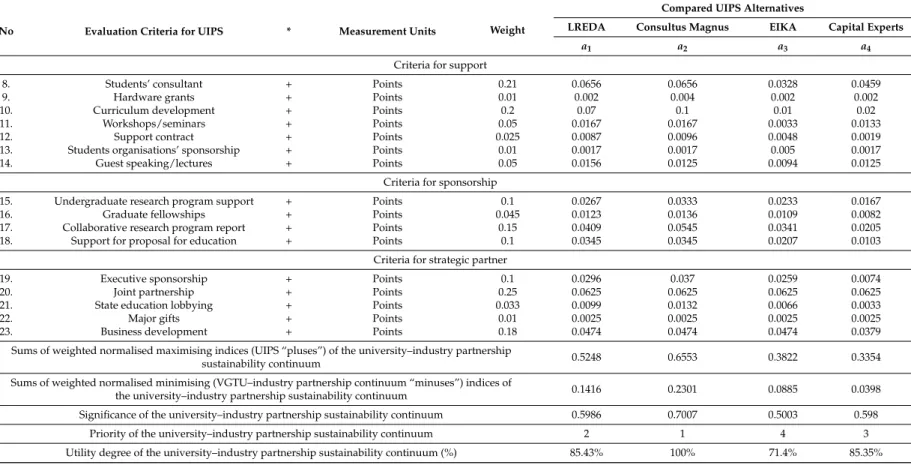
The information included in Table2(i.e., partnership evaluation criteria, as well as respective values and weights) is the basis for performing an assessment of the VGTU–industry partnership. Tables3and4present the results of the calculations conducted using INVAR.
As shown in Table4, a2presents the highest utility degree (U2= 100%).
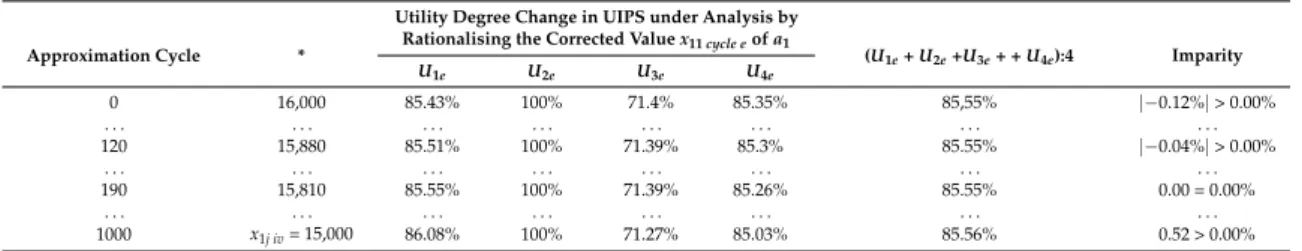
4.3. Calculation of the VGTU–LREDA UIPS Fair Value
The calculation of the fair value of a1with respect to the other U–I partnerships under analysis is presented in Table5, which shows that the imparity was inadequate for the first 120 cycles. Indeed, for the 120th approximation cycle, the results are as follows: U1|120cycle= 85.51%; U2|120cycle= 100%; U3|120cycle= 71.39% and U4|120cycle= 85.3%. At the 190th approximation cycle, the utility degree of a1is U1= 85.55%, showing that a1is more beneficial than a3and a4.
Table 2.Initial data matrix for INVAR method calculations.
No Evaluation Criteria for UIPS * Measurement Units Weight
Compared UIPS Alternatives
LREDA Consultus Magnus EIKA Capital Experts
a1 a2 a3 a4
U–I partnership costs
1. Costs - EUR 0.5 16,000 26,000 10,000 4500
Criteria for awareness
2. Career fairs + Points 0.125 10 9 8 9
3. Interviews + Points 0.1 10 9 7 8
Criteria for involvement
4. Industry affiliates/advisory program + Points 0.02 1 7 1 1
5. Research grants + Points 0.1 1 7 3 1
6. Internship + Points 0.02 1 7 2 1
7. Software grants + Points 0.01 1 2 1 1
Criteria for support
8. Students’ consultant + Points 0.21 10 10 5 7
9. Hardware grants + Points 0.01 1 2 1 1
10. Curriculum development + Points 0.2 7 10 1 2
11. Workshops/seminars + Points 0.05 10 10 2 8
12. Support contract + Points 0.025 9 10 5 2
13. Students organisations’ sponsorship + Points 0.01 1 1 3 1
14. Guest speaking/lectures + Points 0.05 10 8 6 8
Criteria for sponsorship
15. Undergraduate research program support + Points 0.1 8 10 7 5
16. Graduate fellowships + Points 0.045 9 10 8 6
17. Collaborative research program report + Points 0.15 6 8 5 3
18. Support for proposal for education + Points 0.1 10 10 6 3
Criteria for strategic partner
19. Executive sponsorship + Points 0.1 8 10 7 2
20. Joint partnership + Points 0.25 10 10 10 10
21. State education lobbying + Points 0.033 6 8 4 2
22. Major gifts + Points 0.01 1 1 1 1
23. Business development + Points 0.18 10 10 10 8
*: The symbol “+/−” specifies that a bigger (smaller) criterion value corresponds to a bigger (smaller) importance for a user (stakeholder); LREDA: Lithuanian Real Estate Development Association.
Table 3.Five INVAR technique steps.
Steps Equations Calculations
Step 1 Equation (1)
d11= 0.5 × 16,000:(16,000 + 26,000 + 10,000 + 4500) = 0.1416
d12= 0.5 × 26,000:(16,000 + 26,000 + 10,000 + 4500) = 0.2301
d13= 0.5 × 10,000:(16,000 + 26,000 + 10,000 + 4500) = 0.0885
d14= 0.5 × 45,000:(16,000 + 26,000 + 10,000 + 4500) = 0.0398
Step 1 Equation (2) For example, q2= 0.0347 + 0.0312 + 0.0278 + 0.0312 = 0.125
q4= 0.002 + 0.014 + 0.002 + 0.002 = 0.02, etc. Step 2 Equation (3) S+1= 0.0347 + 0.0294 + 0.2709 + 0.002 + 0.0083 + 0.0018 + 0.002 + 0.0656 + 0.002 + 0.07 + 0.0167 + 0.0087 + 0.0017 + 0.0156 + 0.0267 + 0.0123 + 0.0409 + 0.0345 + 0.0296 + 0.0625 + 0.0099 + 0.0025 + 0.0474 = 0.5248 S−1= 0.1416, etc. Step 2 Equation (4) S+= 0.5248 + 0.6553 + 0.3822 + 0.3354 = 1.8977 S−= 0.1416 + 0.2301 + 0.0885 + 0.0398 = 0.5 Step 3 Equation (5) Q1= 0.5248 +0.03980.1416·(0.1416·(0.0398+0.2301+0.0885+0.0398) 0.1416+0.03980.2301+0.03980.0885+0.03980.0398) = 0.5986 etc. Q2= 0.6553 +0.03980.2301·(0.1416·(0.0398+0.2301+0.0885+0.0398) 0.1416+0.03980.2301+0.03980.0885+0.03980.0398) = 0.7007
Step 4 Q2> Q1> Q4> Q3(see Table4: 0.7007 > 0.5986 > 0.598 > 0.5003)
Step 5 Equation (6)
U1= (0.5986:0.7007) × 100% = 85.43%
U2= (0.7007:0.7007) × 100% = 100%
U3= (0.5003:0.7007) × 100% = 71.4%
U4= (0.598:0.7007) × 100% = 85.35%
Table 4.INVAR method calculation results.
No Evaluation Criteria for UIPS * Measurement Units Weight
Compared UIPS Alternatives
LREDA Consultus Magnus EIKA Capital Experts
a1 a2 a3 a4
U–I partnership costs
1. Costs − EURO 0.5 0.1416 0.2301 0.0885 0.0398
Criteria for awareness
2. Career fairs + Points 0.125 0.0347 0.0312 0.0278 0.0312
3. Interviews + Points 0.1 0.0294 0.0265 0.0206 0.0235
Criteria for involvement
4. Industry affiliates/advisory program + Points 0.02 0.002 0.014 0.002 0.002
5. Research grants + Points 0.1 0.0083 0.0583 0.025 0.0083
6. Internship + Points 0.02 0.0018 0.0127 0.0036 0.0018
Table 4. Cont.
No Evaluation Criteria for UIPS * Measurement Units Weight
Compared UIPS Alternatives
LREDA Consultus Magnus EIKA Capital Experts
a1 a2 a3 a4
Criteria for support
8. Students’ consultant + Points 0.21 0.0656 0.0656 0.0328 0.0459
9. Hardware grants + Points 0.01 0.002 0.004 0.002 0.002
10. Curriculum development + Points 0.2 0.07 0.1 0.01 0.02
11. Workshops/seminars + Points 0.05 0.0167 0.0167 0.0033 0.0133
12. Support contract + Points 0.025 0.0087 0.0096 0.0048 0.0019
13. Students organisations’ sponsorship + Points 0.01 0.0017 0.0017 0.005 0.0017
14. Guest speaking/lectures + Points 0.05 0.0156 0.0125 0.0094 0.0125
Criteria for sponsorship
15. Undergraduate research program support + Points 0.1 0.0267 0.0333 0.0233 0.0167
16. Graduate fellowships + Points 0.045 0.0123 0.0136 0.0109 0.0082
17. Collaborative research program report + Points 0.15 0.0409 0.0545 0.0341 0.0205
18. Support for proposal for education + Points 0.1 0.0345 0.0345 0.0207 0.0103
Criteria for strategic partner
19. Executive sponsorship + Points 0.1 0.0296 0.037 0.0259 0.0074
20. Joint partnership + Points 0.25 0.0625 0.0625 0.0625 0.0625
21. State education lobbying + Points 0.033 0.0099 0.0132 0.0066 0.0033
22. Major gifts + Points 0.01 0.0025 0.0025 0.0025 0.0025
23. Business development + Points 0.18 0.0474 0.0474 0.0474 0.0379
Sums of weighted normalised maximising indices (UIPS “pluses”) of the university–industry partnership
sustainability continuum 0.5248 0.6553 0.3822 0.3354
Sums of weighted normalised minimising (VGTU–industry partnership continuum “minuses”) indices of
the university–industry partnership sustainability continuum 0.1416 0.2301 0.0885 0.0398
Significance of the university–industry partnership sustainability continuum 0.5986 0.7007 0.5003 0.598
Priority of the university–industry partnership sustainability continuum 2 1 4 3
Utility degree of the university–industry partnership sustainability continuum (%) 85.43% 100% 71.4% 85.35%
Table 5.Revised changes in fair value calculations for LREDA under analysis a1.
Approximation Cycle *
Utility Degree Change in UIPS under Analysis by Rationalising the Corrected Value x11 cycle eof a1
(U1e+ U2e+U3e+ + U4e):4 Imparity U1e U2e U3e U4e 0 16,000 85.43% 100% 71.4% 85.35% 85,55% |−0.12%|> 0.00% . . . . 120 15,880 85.51% 100% 71.39% 85.3% 85.55% |−0.04%|> 0.00% . . . . 190 15,810 85.55% 100% 71.39% 85.26% 85.55% 0.00 = 0.00% . . . . 1000 x1j iv= 15,000 86.08% 100% 71.27% 85.03% 85.56% 0.52 > 0.00%
* Revised changes in value and fair value x11 cycle e(EURO) of LREDA under valuation a1.
According to Table5, calculations were repeated according to steps 1–6 (see Figure 2) until imparity was fulfilled in the 190th cycle.
4.4. Value Optimisation
Based on steps 1–5 and 7, the x104 cycle eshows the UIPS value that is necessary for a4to be equally competitive on the market, as related to the other UIPSes (a1, a2, a3) under analysis (see Table6). The followed procedures allowed for the calculation of what the optimised curriculum development score x104 cycle eshould be for a4.
Table 6.Value optimisation processes.
Approximation Cycle x104 cycle e U4e U1e U2e U3e (U1e+ U2e+ U3e+ + U4e) : 4 Imparity
0 2 85.35 85.43 100 71.4 85.55 |−0.19%|> 0.01% . . . . 10 2.1 85.53 85.45 100 71.45 85.61 |−0.08%|> 0.01% . . . . 14 2.14 85.62 85.44 100 71.46 85.63 |−0.01%|= 0.01% . . . . 20 2.2 85.72 85.45 100 71.49 85.67 |0.05%|= 0.01%
As Table 6shows, the imparity was inadequate for the first 10 cycles. The score x104 was increased in every cycle (from x104 cycle 0= 2) by an amount of 0.01 until the imparity was fulfilled (x104 cycle 14= 2.14). Scores x104 cycle e(respectively, 2 . . . and 2.14) were then checked for consistency in the decision-making matrix.
4.5. Recommendations
The results of the INVAR application for the UIPS evaluation are presented in Table7, where a2 stands as the best alternative for VGTU–industry cooperation.
Table 7.Quantitative recommendations presented in a matrix form.
Criteria Describing the
Candidate Alternatives * Measurement Units
Criterion Value (xij) Possible Improvement of the Analysed Criterion xij, by % (iij) Possible Increase in Utility Degree Ujof the Candidate Alternative aj, by % (rij)
a1 a2 a3 a4
5. Research grants + Points
1 x52= 7 x53= 3 1
(600%) (0%) (i53= 133.33%) (600%)
(25.0209%) (0%) (r53= 5.5602%) (25.0209%)
*: The symbol “+/−” specifies that a bigger (smaller) criterion value corresponds to a bigger (smaller) importance for a user (stakeholder).
In practice, the methodological processes that were followed for this study allowed for an integrated assessment of the U–I partnership life cycle (i.e., awareness, involvement, support, sponsorship, and strategic partner). This was conducted according to a system of criteria (i.e., innovative, economic, managerial, technical, economic, legal/regulatory, educational, social, cultural, ethical, psychological, emotional, religious, and ethnic aspects) and in conformity with the requirements and opportunities of different stakeholders. Additionally, the INVAR method allows
the strongest and weakest points of each UIPS, along with its basic components, to be established and managed. This can be extremely important for entrepreneurial universities aiming to strengthen their corporate links and/or reduce/reverse the “hollowing effect” of globalisation in some regions.
5. Conclusions
This study sought to create a neural system for a multiple criteria analysis of UIPS. An analysis of prior research [1–3] suggests that the systems available globally have offered no possibilities to execute a multi-variant design and a multiple criteria assessment of alternative iterative life cycles of U–I partnerships, calculate their market and fair value, conduct online negotiations, and select options that offer the best efficiency. Proposing a process-oriented framework that allows overcoming these limitations is the main contribution of this study to theory and practice.
A U–I partnership iterative life cycle may have many alternatives. The basis for the variants consists of an alternative’s components—awareness, involvement, support, sponsorship, and strategic partners, among others. The above solutions and processes may be further considered in more detail. Thus, a wide range of U–I partnership iterative life cycle alternatives can be obtained. However, it is worth noting that the development of a potential U–I partnership is complicated, because alternatives for awareness, involvement, support, sponsorship, and strategic partners are plentiful and not continuously well matched. In this regard, the University (including its students, governing board, rector, vice-rectors, deans, chairs, teaching and research staff, and administrative and support staff) and industry stakeholders (including their top management (e.g., chairman, vice-presidents, board of directors, chief executive officer), middle management (e.g., general managers, regional managers), and first line management (e.g., supervisors, office managers, team leaders and employees)) are forced to develop and analyse alternative UIPS solutions.
This research applied the INVAR method for a UIPS evaluation. The resulting new system makes it possible to perform a multi-variant design, as well as a multiple criteria assessment of alternative U–I partnership life cycles, calculate their market and fair values, and conduct online negotiations to select the most efficient alternatives. This results in quantitative information that entrepreneurial universities can use to strengthen their corporate links and/or reduce/reverse the “hollowing effect” of globalisation in disadvantaged regions. Therefore, the UIPS evaluation system developed in this study contributes to the theory and practice of entrepreneurial universities by introducing the INVAR method and its respective framework to different classes of informational systems and decision-making problems. Naturally, it also causes managerial implications for U–I stakeholders, namely in terms of research and innovation performances.
Although the results are encouraging, the UIPS evaluation system developed in this study does have some limitations. Among them, the ones requiring highlighting are the following: (1) the number of participants in the experiment was small; (2) the processes followed require the collection of much unstructured and semi-structured data from many sources, along with their analyses to support stakeholders in decision-making; (3) stakeholders need to be aware of the broader context of decision-making, which includes lifestyle, behavioral, cognitive, social, emotional, psychological, cultural, and ethical factors that impact the success of entrepreneurial universities; and (4) the proposal is process-oriented, which can be a disadvantage during the system’s implementation.
Future research is foreseen as moving in three main directions. First, the development of similar experiments that also involve the comparison of other multiple criteria decision methods (for a review, see Zavadskas and Turskis [68], Zavadskas et al. [69]), surveys of comparisons among different methods and sensitivity and robustness analyses in order to explore which method provides more robust and reliable risk assessments. Second, the existing database and the model-base under adaptation should be extended. Third, development of the opinion analytics based on the new UIPS evaluation system is expected. Opinion analytics will empower the automatic detection of opinions expressed in articles, reviews, surveys, comments, opinions, notices, papers, researches, studies, blogs, online forums, Facebook, Twitter, and other social media channels, thereby allowing for the visualisation
of the opinions held by stakeholders on issues regarding a U–I partnership. The innovativeness of opinion analytics will be primarily for automatically determining the level of sustainability of the U–I partnership, compiling numerous alternative recommendations applicable to a specific user, performing a multiple criteria analysis of these recommendations, and selecting the 10 most rational ones for that user. Advancements and updates will be of particular interest to U–I stakeholders, i.e., entrepreneurial universities in particular.
Acknowledgments: This research was funded as part of the “Advancing Skill Creation to ENhance
Transformation—ASCENT” Project No. 561712-EPP-1-2015-UK-EPPKA2-CBHE-JP, which has received funding from the European Union’s Erasmus + program.
Author Contributions:Art ¯uras Kaklauskas, Audrius Banaitis, Dilanthi Amaratunga, Natalija Lepkova and Ieva
Ubart ˙e together designed the research and wrote the paper. F.A.F.F., J.J.M.F. and N.B. provided extensive advice throughout the study regarding the abstract, introduction, literature review, research methodology and system development, practical application and conclusions of the manuscript. The discussion was a team task.
Conflicts of Interest:The authors declare no conflict of interest. The founding sponsor had no role, neither in
the design of the study or in the collection, analyses or interpretation of data. There was no participation in the writing of the manuscript or in the decision to publish the results.
References
1. Bstieler, L.; Hemmert, M.; Barczak, G. The changing bases of mutual trust formation in inter-organizational relationships: A dyadic study of university-industry research collaborations. J. Bus. Res. 2017, 74, 47–54. [CrossRef]
2. Rajalo, S.; Vadi, M. University-industry innovation collaboration: Reconceptualization. Technovation 2017, 62–63, 42–54. [CrossRef]
3. Sarpong, D.; AbdRazak, A.; Alexander, E.; Meissner, D. Organizing practices of university, industry and government that facilitate (or impede) the transition to a hybrid triple helix model of innovation. Technol. Forecast. Soc. Chang. 2017, 123, 142–152. [CrossRef]
4. Lee, Y.S. ‘Technology transfer’ and the research university: A search for the boundaries of university-industry collaboration. Res. Policy 1996, 25, 843–863. [CrossRef]
5. Mowery, D.C.; Sampat, B.N. The Bayh-Dole Act of 1980 and university-industry technology transfer: A model for other OECD governments? J. Technol. Transf. 2004, 30, 115–127. [CrossRef]
6. Malairaja, C.; Zawdie, G. Science parks and university-industry collaboration in Malaysia. Technol. Anal. Strateg. Manag. 2008, 20, 727–739. [CrossRef]
7. Bruneel, J.; d’Este, P.; Salter, A. Investigating the factors that diminish the barriers to university-industry collaboration. Res. Policy 2010, 39, 858–868. [CrossRef]
8. Freitas, I.M.B.; Marques, R.A.; Silva, E.M.D.P. University-industry collaboration and innovation in emergent and mature industries in new industrialized countries. Res. Policy 2013, 42, 443–453. [CrossRef]
9. Galati, F.; Bigliardi, B.; Petroni, A.; Marolla, G. Which factors are perceived as obstacles for the growth of Italian academic spin-offs? Technol. Anal. Strateg. Manag. 2017, 29, 84–104. [CrossRef]
10. Albats, E.; Fiegenbaum, I.; Cunningham, J. A micro level study of university industry collaborative lifecycle key performance indicators. J. Technol. Transf. 2017, 1–43. [CrossRef]
11. Burton, L.; Pope, S.; Kateeb, I.; Rhodes, C.; Cobb, R.; Graham, T.; Tsay, L.; Seay, C. A college-industry partnership for enterprise computing. In Proceedings of the 2012 ASEE Annual Conference & Exposition; Article Number: AC 2012-3509; ASEE: Washington, DC, USA, 2012.
12. Giuliani, L.; Revez, A.; Sparf, J.; Jayasena, S.; Faber, M.H. Social and technological aspects of disaster resilience. Int. J. Strateg. Prop. Manag. 2016, 20, 277–290. [CrossRef]
13. Harwood, J.; Smith, D.; Henderson, D. Building community cyclone resilience through academic and insurance industry partnership. Aust. J. Emerg. Manag. 2016, 31, 24–30.
14. Iwatsuki, K. The projects of Disaster-Resistant Information Communication Network at the Research Organization of Electrical Communication, Tohoku University. In Proceedings of the SPIE Conference on Optical Metro Networks and Short-Haul Systems V; Article Number: UNSP 86460B; SPIE OPTO: San Francisco, CA, USA, 2013.
15. Mortazavi-Ravari, S.; Mehrabanfar, E.; Banaitis, A.; Banaitien ˙e, N. Framework for assessing technological innovation capability in research and technology organizations. J. Bus. Econ. Manag. 2016, 17, 825–847. [CrossRef]
16. Tan, A.; Udeaja, C.; Babatunde, S.O.; Ekundayo, D. Sustainable development in a construction related curriculum—Quantity surveying students’ perspective. Int. J. Strateg. Prop. Manag. 2017, 21, 101–113. [CrossRef]
17. Salleh, M.S.; Omar, M.Z. University-industry collaboration models in Malaysia. Procedia Soc. Behav. Sci. 2013, 102, 654–664. [CrossRef]
18. Plewa, C.; Korff, N.; Johnson, C.; Macpherson, G.; Rampersad, G. The evolution of university-industry linkages: A framework. J. Eng. Technol. Manag. 2013, 30, 21–44. [CrossRef]
19. Ankrah, S.; AL-Tabbaa, O. Universities-industry collaboration: A systematic review. Scand. J. Manag. 2015, 31, 387–408. [CrossRef]
20. Chen, S.; Lin, W. The dynamic role of universities in developing an emerging sector: A case study of the biotechnology sector. Technol. Forecast. Soc. Chang. 2017, 123, 283–297. [CrossRef]
21. Garousi, V.; Petersen, K.; Ozkan, B. Challenges and best practices in industry-academia collaborations in software engineering: A systematic literature review. Inf. Softw. Technol. 2016, 79, 106–127. [CrossRef] 22. Irani, Z.; Kamal, M. Intelligent Systems Research in the Construction Industry. Expert Syst. Appl. 2014, 41,
934–950. [CrossRef]
23. Wolf, C.; Pomponi, F.; Moncaster, A. Measuring embodied carbon dioxide equivalent of buildings: A review and critique of current industry practice. Energy Build. 2017, 140, 68–80. [CrossRef]
24. Minnillo, R. Academic Industry Partnership Project. 2015. Available online:http://www.sidnet.org/page/AIPP (accessed on 3 October 2017).
25. Ahrweiler, P.; Pyka, A.; Gilbert, N. A New Model for University-Industry Links in Knowledge-Based Economies. J. Prod. Innov. Manag. 2011, 28, 218–235. [CrossRef]
26. Kaklauskas, A. Degree of Project Utility and Investment Value Assessments. Int. J. Comput. Commun. Control
2016, 11, 666–683. [CrossRef]
27. Berbegal-Mirabent, J.; Sánchez García, J.; Ribeiro-Soriano, D. University-industry partnerships for the provision of R&D services. J. Bus. Res. 2015, 68, 1407–1413.
28. Del Río, P.; Carrillo-Hermosilla, J.; Könnölä, T.; Bleda, M. Resources, capabilities and competences for eco-innovation. Technol. Econ. Dev. Econ. 2016, 22, 274–292. [CrossRef]
29. Zemlickien ˙e, V.; Maˇciulis, A.; Tvaronaviˇcien ˙e, M. Factors impacting the commercial potential of technologies: Expert approach. Technol. Econ. Dev. Econ. 2017, 23, 410–427. [CrossRef]
30. Muscio, A.; Quaglione, D.; Scarpinato, M. The effects of universities’ proximity to industrial districts on university–industry collaboration. China Econ. Rev. 2012, 23, 639–650. [CrossRef]
31. Banal-Estañol, A.; Jofre-Bonet, M.; Lawson, C. The double-edged sword of industry collaboration: Evidence from engineering academics in the UK. Res. Policy 2015, 44, 1160–1175. [CrossRef]
32. Callaert, J.; Landoni, P.; van Looy, B.; Verganti, R. Scientific yield from collaboration with industry: The relevance of researchers’ strategic approaches. Res. Policy 2015, 44, 990–998. [CrossRef]
33. Fuentes, C.; Dutrénit, G. Best channels of academia-industry interaction for long-term benefit. Res. Policy
2012, 41, 1666–1682. [CrossRef]
34. Hemmert, M.; Bstieler, L.; Okamuro, H. Bridging the cultural divide: Trust formation in university-industry research collaborations in the US, Japan, and South Korea. Technovation 2014, 34, 605–616. [CrossRef] 35. Myneni, S.; Patel, V.; Bova, G.; Wang, J.; Ackerman, C.; Berlinicke, C.; Chen, S.; Lindvall, M.; Zack, D.
Resolving complex research data management issues in biomedical laboratories: Qualitative study of an industry-academia collaboration. Comput. Methods Progr. Biomed. 2016, 126, 160–170. [CrossRef] [PubMed]
36. Perkmann, M.; King, Z.; Pavelin, S. Engaging excellence? Effects of faculty quality on university engagement with industry. Res. Policy 2011, 40, 539–552. [CrossRef]
37. Dornbusch, F.; Neuhäusler, P. Composition of inventor teams and technological progress—The role of collaboration between academia and industry. Res. Policy 2015, 44, 1360–1375. [CrossRef]
38. Feng, F.; Zhang, L.; Du, Y.; Wang, W. Visualization and quantitative study in bibliographic databases: A case in the field of university-industry cooperation. J. Informetr. 2015, 9, 118–134. [CrossRef]
39. D’Este, P.; Guy, F.; Iammarino, S. Shaping the Formation of University-Industry Research Collaborations: What Type of Proximiy Does Really Matter? 2012. Available online:http://druid8.sit.aau.dk/acc_papers/ soj71aahjen3994vu7p484x83uba.pdf(accessed on 11 October 2017).
40. Prigge, G.; Torraco, R. University-Industry Partnerships: A Study of How Top American Research Universities Establish and Maintain Successful Partnerships. J. High. Educ. Outreach Engagem. 2006, 11, 89–100.
41. Schoen, A.; Potterie, B.; Henkel, J. Governance typology of universities’ technology transfer processes. J. Technol. Transf. 2014, 39, 435–453. [CrossRef]
42. Teller, R.; Validova, A. Innovation Management in the Light of University-Industry Collaboration in Post-Socialist Countries. Procedia Econ. Financ. 2015, 24, 691–700. [CrossRef]
43. Giuliani, E.; Morrison, A.; Pietrobelli, C.; Rabellotti, R. Who are the researchers that are collaborating with industry? An analysis of the wine sectors in Chile, South Africa and Italy. Res. Policy 2010, 39, 748–761. [CrossRef]
44. Bumblauskas, D.; Gemmill, D.; Igou, A.; Anzengruber, J. Smart Maintenance Decision Support Systems (SMDSS) based on corporate big data analytics. Expert Syst. Appl. 2017, 90, 303–317. [CrossRef]
45. Calabrese, F.; Corallo, A.; Margherita, A.; Zizzari, A. A knowledge-based Decision Support system for shipboard damage control. Expert Syst. Appl. 2012, 39, 8204–8211. [CrossRef]
46. Horváth, G.; Harazin, P. A framework for an industrial ecological Decision Support system to foster partnerships between businesses and governments for sustainable development. J. Clean. Prod. 2016, 114, 214–223. [CrossRef]
47. Prince, R. Fleshing out expertise: The making of creative industries experts in the United Kingdom. Geoforum
2010, 41, 875–884. [CrossRef]
48. Rong, K.; Shi, Y.; Shang, T.; Chen, Y.; Hao, H. Organizing business ecosystems in emerging electric vehicle industry: Structure, mechanism, and integrated configuration. Energy Policy 2017, 107, 234–247. [CrossRef] 49. Johnson, W. The Collaboration Imperative: Universities and Industry as Partners in the 21st Century Knowledge Economy. 2006. Available online: http://sites.nationalacademies.org/cs/groups/pgasite/ documents/webpage/pga_051414.pdf(accessed on 11 October 2017).
50. Johnson, W. Research: Open Innovation, Open Collaboration, Trends, Challenges, and Advances in the Global Landscape. 2008. Available online: https://www.ncsu.edu/iucrc/Jan\T1\textquoteright08/WayneJohnson-IUCRCtalk-10JAN08.pdf(accessed on 11 October 2017).
51. Zavadskas, E.; Kaklauskas, A. Model for Lithuanian construction industry development. Transform. Bus. Econ.
2008, 7, 152–168. [CrossRef]
52. Kanapeckien ˙e, L.; Kaklauskas, A.; Zavadskas, E.; Raslanas, S. Method and system for multi-attribute market value assessment in analysis of construction and retrofit projects. Expert Syst. Appl. 2011, 38, 14196–14207. [CrossRef]
53. Urbanaviˇcien ˙e, V.; Kaklauskas, A.; Zavadskas, E. The conceptual model of construction and real estate negotiation. Int. J. Strateg. Prop. Manag. 2009, 13, 53–70. [CrossRef]
54. Karsak, E.; Dursun, M. An integrated fuzzy MCDM approach for supplier evaluation and selection. Comput. Ind. Eng.
2015, 82, 82–93. [CrossRef]
55. Chithambaranathan, P.; Subramanian, N.; Gunasekaran, A.; Palaniappan, P. Service supply chain environmental performance evaluation using grey based hybrid MCDM approach. Int. J. Prod. Econ.
2015, 166, 163–176. [CrossRef]
56. Prakash, C.; Barua, M. A combined MCDM approach for evaluation and selection of third-party reverse logistics partner for Indian electronics industry. Sustain. Prod. Consum. 2016, 7, 66–78. [CrossRef]
57. Deveci, M.; Demirel, N.Ç.; Ahmeto ˘glu, E. Airline new route selection based on interval type-2 fuzzy MCDM: A case study of new route between Turkey- North American region destinations. J. Air Transp. Manag. 2017, 59, 83–99. [CrossRef]
58. Büyüközkan, G.; Karabulut, Y.; Arsenyan, J. RFID service provider selection: An integrated fuzzy MCDM approach. Measurement 2017, 112, 88–98. [CrossRef]
59. Yazdani, M.; Chatterjee, P.; Zavadskas, E.; Zolfani, S. Integrated QFD-MCDM framework for green supplier selection. J. Clean. Prod. 2017, 142, 3728–3740. [CrossRef]
60. Mendoza, G.A.; Prabhu, R. Multiple criteria decision making approaches to assessing forest sustainability using criteria and indicators: A case study. For. Ecol. Manag. 2000, 131, 107–126. [CrossRef]
61. Wang, L.-E.; Liu, H.-C.; Quan, M.-Y. Evaluating the risk of failure modes with a hybrid MCDM model under interval-valued intuitionistic fuzzy environment. Comput. Ind. Eng. 2016, 102, 175–185. [CrossRef]
62. Qiu, N.; Gao, Y.; Fang, J.; Feng, Z.; Sun, G.; Li, Q. Crashworthiness analysis and design of multi-cell hexagonal columns under multiple loading cases. Finite Elem. Anal. Des. 2015, 104, 89–101. [CrossRef]
63. Nuuter, T.; Lill, I.; Tupenaite, L. Comparison of housing market sustainability in European countries based on multi-criteria assessment. Land Use Policy 2015, 42, 642–651. [CrossRef]
64. Chatterjee, P.; Athawale, V.M.; Chakraborty, S. Materials selection using complex proportional assessment and evaluation of mixed data methods. Mater. Des. 2011, 32, 851–860. [CrossRef]
65. Yin, H.; Xiao, Y.; Wen, G.; Qing, Q.; Deng, Y. Multiobjective optimization for foam-filled multi-cell thin-walled structures under lateral impact. Thin-Walled Struct. 2015, 94, 1–12. [CrossRef]
66. Kaklauskas, A.; Zavadskas, E.; Banaitis, A.; Meidut ˙e-Kavaliauskien ˙e, I.; Liberman, A.; Dzitac, S.; Ubart ˙e, I.; Binkyt ˙e, A.; Cerkauskas, J.; Kuzminsk ˙e, A.; et al. A neuro-advertising property video recommendation system. Technol. Forecast. Soc. Chang. 2017, in press.
67. Kaklauskas, A.; Zavadskas, E. Decision support system for innovation with a special emphasis on pollution. Int. J. Environ. Pollut. 2007, 30, 518–528. [CrossRef]
68. Zavadskas, E.; Turskis, Z. Multiple criteria decision making (MCDM) methods in economics: An overview. Technol. Econ. Dev. Econ. 2011, 17, 397–427. [CrossRef]
69. Zavadskas, E.K.; Antucheviciene, J.; Vilutiene, T.; Adeli, H. Sustainable Decision-Making in Civil Engineering, Construction and Building Technology. Sustainability 2018, 10, 14. [CrossRef]
© 2018 by the authors. Licensee MDPI, Basel, Switzerland. This article is an open access article distributed under the terms and conditions of the Creative Commons Attribution (CC BY) license (http://creativecommons.org/licenses/by/4.0/).
![Figure 1. Databases and datasets of university–industry partnership sustainability (UIPS) [31–40]](https://thumb-eu.123doks.com/thumbv2/123dok_br/18041033.862147/3.892.156.735.129.664/figure-databases-datasets-university-industry-partnership-sustainability-uips.webp)
![Figure 3. Key steps of the INvestment Value Assessments along with Recommendation provisions (INVAR) method [26].](https://thumb-eu.123doks.com/thumbv2/123dok_br/18041033.862147/6.892.134.755.112.1039/figure-investment-value-assessments-recommendation-provisions-invar-method.webp)
![Table 1. Decision matrix [66].](https://thumb-eu.123doks.com/thumbv2/123dok_br/18041033.862147/7.892.160.733.246.414/table-decision-matrix.webp)