Education
An Introduction to Bioinformatics for Glycomics Research
Kiyoko F. Aoki-Kinoshita*
Department of Bioinformatics, Soka University, Tokyo, Japan
Introduction
Carbohydrates are considered the third class of information-encoding biological macromolecules. ‘‘Glycomics,’’ the scientific attempt to characterize and study carbohy-drates, is a rapidly emerging branch of science, for which informatics is just begin-ning. Glycomics requires sophisticated algo-rithmic approaches. Several algorithms and models have been developed for glycobiol-ogy research in the past several years. This tutorial will provide a brief introduction to the field of glycome informatics, which will include a primer on glycobiology as well as descriptions of the algorithms and models that have been developed in this field.
The four essential molecular building blocks of cells are nucleic acids, proteins, lipids, and carbohydrates, often referred to as glycans. Nucleotide and protein sequenc-es are at the heart of nearly all bioinfor-matics applications and research, whereas glycan and lipid structures have been widely neglected in bioinformatics. However, gly-cans are the most abundant and structurally diverse biopolymers formed in nature. Bound to proteins, as glycoproteins, they are known to affect the functions of proteins. More than half of all protein sequences deposited in the SWISS-PROT databank include potential glycosylation sites and thus may be glycoproteins. Based on an analysis of well-annotated and characterized glyco-proteins in SWISS-PROT, it was concluded that more than half of all proteins are glycosylated [1].
The development and use of informatics tools and databases for glycobiology and glycomics research has increased consider-ably in recent years. However, the general development in this field can still be considered as being in its infancy when compared to the genomics and proteomics areas. In terms of bioinformatics in glyco-biology, there are several paths of research that are currently in progress. The develop-ment of algorithms to reliably support the
characterization of glycan structures for high-throughput applications is the most immediate demand of the glycomics com-munity. Additionally, several major glyco-related projects (Consortium for Functional Glycomics [2], KEGG Glycan [3], GLY-COSCIENCES.de [4]) are maturing and provide well-structured glyco-related data that are awaiting data mining and analysis. With the exciting new developments in carbohydrate arrays and automated MS annotation, the analysis of the glycome has reached a new level of sophistication, which requires broader informatics support. This tutorial aims to give an overview of the current status of carbohydrate databases, the newest analytical techniques, as well as the informatics needed for rapid progress in glycomics research.
Background
Complex carbohydrates are chains of monosaccharides, often called glycans, and are often found attached to proteins (to form glycoproteins) and lipids (glyco-lipids, glycosphingo(glyco-lipids, etc.). Glycopro-teins are usually on the cell surface, where they are recognized by bacteria, viruses, and other proteins, such as lectins, in order to facilitate various crucial functions. It is also known that glycans are involved in a variety of biological processes including protein folding and signalling events.
The complex structure of glycans has been a bottleneck in the structure deter-mination and thus data accumulation of glycan structures. This is confounded by the complex biosynthetic pathways of glycans. It is known that glycan-specific diseases called CDGs (congenital disorders of glycosylation) are caused by defects in these pathways [5]. Furthermore, there have been many reports on glycan
mark-ers related to human diseases such as cancer and autoimmune diseases [6,7].
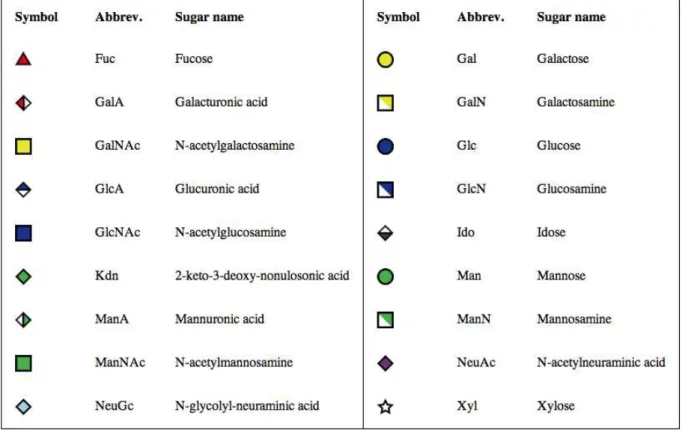
Carbohydrate Structure Notation. Complex carbohydrates are composed of monosaccharides that are covalently linked by glycosidic bonds, either in the a or b form. Unlike DNA and proteins, however, monosaccharides may be linked to one or more other monosaccharides, such that they form a branched tree structure. In order to formulate a standardized notation for glycans, the Consortium for Functional Glycomics (CFG) proposed a standard symbolic representation for those monosaccharides that are found most in nature, which has been employed in [8]. This representation (as given in Figure 1) will be utilized throughout this tutorial.
Carbohydrates are most classically drawn as a tree in a two-dimensional plane, with the root monosaccharide placed at the right-most position and children branching out toward the left. Each node represents a monosaccharide, and each edge represents a glycosidic linkage, which includes the carbon numbers that are bound and the conformation. An example of an N-linked glycan is given in Figure 2.
Although the two-dimensional notation is nice and pretty, it is not suitable for storage in a database, let alone for bioinformatic analysis. The IUPAC–IUBMB (Interna-tional Union of Pure and Applied Chemis-try–International Union of Biochemistry and Molecular Biology) has specified the ‘‘Nomenclature of Carbohydrates’’ to uniquely describe complex oligosaccharides based on a three-letter code to represent monosaccharides (e.g., ‘‘gal’’ for galactose and ‘‘man’’ for mannose). Each monosac-charide code is preceded by the anomeric descriptor and the configuration symbol. The ring size is indicated by an italicffor furanose or p for pyranose. The carbon
* E-mail: [email protected]
Citation:Aoki-Kinoshita KF (2008) An Introduction to Bioinformatics for Glycomics Research. PLoS Comput Biol 4(5): e1000075. doi:10.1371/journal.pcbi.1000075
PublishedMay 30, 2008
Copyright: ß2008 Kiyoko Aoki-Kinoshita. This is an open-access article distributed under the terms of the Creative Commons Attribution License, which permits unrestricted use, distribution, and reproduction in any medium, provided the original author and source are credited.
Funding:This work was partly funded by NIH grant GM62116 (Consortium Functional Glycomics).
Competing Interests:The author has declared that no competing interests exist.
numbers that link the two monosaccharide units are given in parentheses between the symbols separated by an arrow. For exam-ple, the structure in Figure 2 would be represented as: b-D-GlcpNAc-(1R4)-[b
-D-GlcpNAc-(1R2)-a-D-Manp-(1R3)][a
-D-Manp-(1R3)-[a-D-Manp-(1R6)]-a
-D-Man-(1R6)]-b-D-Manp-(1R4)-b
-D-GlcpNAc-(1R4)-b-D-GlcpNAc. In such a
way, long carbohydrate sequences can be adequately described in abbreviated form using a sequence of letters.
However, as we discuss in the next section, it is not always possible to obtain a full and exact representation of carbohy-drates due to the difficulties in sequencing them. Currently, the most popular method
for complex carbohydrate sequencing is mass spectroscopy (MS). However, this process is often incomplete and error-prone. For example, unless one uses MS in tandem it is nearly impossible to distin-guish between isomeric monosaccharides (e.g., glucose, galactose, and mannose are all hexoses with the same mass). As any spectrometrist will state, MS in tandem is a rather tedious process, even for one carbohydrate structure. Thus, for those developing databases, the notation for carbohydrates must be flexible enough to capture all the data at hand but also be able to account for ambiguities.
There are currently in use several different notations for carbohydrates, which
developed out of the construction of some major databases during a time when no standard notation for carbohydrates existed. Briefly, these notations are KEGG Chem-ical Function (KCF) format, which repre-sents glycans using a connected graph, LINUCS (Linear Notation for Unique Description of Carbohydrate Sequences), which provides a unique and linear notation for glycans, and Linear Code by Glyco-Minds, which provides a commercial com-plex carbohydrate database [9].
Databases
As of the time of this writing, there are three major databases for complex carbo-hydrates, Glycosciences.de, KEGG GLY-CAN, and the database developed by the Consortium for Functional Glycomics (CFG). All three databases are based on the CarbBank database developed in the 1990s by the Complex Carbohydrate Research Center (CCRC) at the Univer-sity of Georgia [10]. These databases have been summarized in Table 1.
The major issue that was facing the glyco-informatics community was the fact that each of these databases represented their glycan structures in different formats. Glycosciencse.de uses the LINUCS format, KEGG the KEGG Chemical Function Figure 1. Standard representation of carbohydrate chains as proposed by the Consortium for Functional Glycomics.
doi:10.1371/journal.pcbi.1000075.g001
Figure 2. An example of an N-linked glycan, illustrated as a tree structure rooted at the right side and branching toward the left.
(KCF) format, and CFG the IUPAC format. In September 2006, a workshop was held at the National Institutes of Health (NIH), United States, where glycobiologists and glyco-informaticians gathered to discuss a standard exchange format for carbohy-drate structures. At this meeting, the GLYDE-II XML format for glycans and glycoconjugates, developed by the CCRC, was agreed upon as the standard format for exchanging carbohydrate data [11].
Glycome Informatics Methods
Along with the development of these glycan databases over the past few years, bioinformatic methods for analyzing glycan structures have also appeared. In general, these can be classified into the following six categories: glycosylation analysis, glycomics, glycan biomarker prediction, glycan struc-ture analysis, glyco-gene expression analy-sis, and glycan structure mining.
In the area of research in the first three categories of glycosylation analysis, glyco-mics and glycan biomarker prediction may be of most interest to biologists, whereas the latter are (currently) active areas of research in the informatics community. Thus, the literature is rich in research in the former areas, and it is hoped that the latter areas
will be able to develop and produce more interesting results as these technologies advance. In any case, these areas are all covered equally in this section.
Glycosylation Analysis. Since the methods in this section have been summar-ized nicely in two previous reviews [12,13], they are only briefly mentioned for reference. Prediction of glycosylation binding sites on proteins. As one form of post-translational modification, glycosylation affects the function of the modified protein. Thus, many methods have been developed to predict glycosylation sites based on the amino acid sequence. These methods have been summarized in Table 2. Statistical analysis of amino acids surrounding the glycosylation binding site of a glycoprotein. The statistical analysis of amino acids surrounding glyco-sylation binding sites has been an active area of research by the German Cancer Research Center. One of their tools called GlySeq [14] statistically analyzes the amino acids surrounding the glycosylation sites based on protein sequences from Swiss-Prot and the Protein Data Bank (PDB). These statistics are publicly available in the GlySeqDB database.
In addition to analyzing the surround sequence, a tool called GlyVicinity performs
a statistical analysis of a PDB entry by computing the frequency of amino acids within a user-definable distance up to 10 A˚ of carbohydrate residues. This tool per-forms on top of the data in GlyVicinityDB, which contains distance information of the amino acids in the spatial vicinity of carbohydrate residues in PDB entries [14]. Mathematical modeling of glyco-sylation. In other work at Johns Hopkins University, a model to mathe-matically formulate N-glycosylation was developed [15] based on a previous model that formulated the initial stages of N-glycosylation up to the first galactosylation of an oligosaccharide [16]. This new model characterizes the substrate specifi-cities of known glycosyltransferases as a rule table. Thus, given a set of expressed genes, the list of possible glycans synthe-sized by the input can be predicted. This model was further enhanced to incorpor-ate enzyme kinetics such that concentra-tions of structures could be computed using nonlinear algebra. The results were supported by experimental evidence.
Glycomics (Mass Analytics). The field of glycomics can be defined as the technology to determine carbohydrate sequences (structures) using mass spectral data. This area of research has been the Table 1.The Three Major Publicly Available Carbohydrate Databases Are Listed Along with the URLs and Literary References.
Database Name Description URL Reference
Glycosciences.de Database of glycan structures and mass spectral data, based at the German Cancer Research Center
http://www.glycosciences.de [4]
KEGG GLYCAN A part of the KEGG database containing glycan structures extracted from CarbBank and subsequently linked with the GENES and PATHWAY information in KEGG. Glycosyl-transferases and glycan binding protein data have also been organized in KEGG BRITE
http://www.genome.jp/kegg/glycan/ [3]
CFG Developed by the Bioinformatics Core of the CFG, this database contains structures from CarbBank and a seed database provided by GlycoMinds. They have been subsequently linked with tissue and cell data, glycan array information, and glycans specifically synthesized by the CFG.
http://www.functionalglycomics.org/ [2]
doi:10.1371/journal.pcbi.1000075.t001
Table 2.Glycosylation Prediction Programs.
Name Description URL
Big-PIPredictor [41] GPI-anchor prediction http://mendel.imp.univie.ac.at/sat/gpi/gpi_server.html
GlyProt [42] In-silico glycosylation http://www.glycosciences.de/modeling/glyprot/
GlySeq [14] Statistical analysis of glycosylation sites http://www.glycosciences.de/tools/glyseq/
GPI-SOM [43] Identification of GPI-anchor signals using a Self Organizing Map (SOM) http://gpi.unibe.ch
NetNGlyc [44] and NetOGlyc [45]
N- and O-glycosylation prediction; also available as SOAP-based web services
http://www.cbs.dtu.dk/services/NetNGlyc/ and http://www.cbs.dtu.dk/services/NetOGlyc/
NetCGlyc [46] C-mannosylation site prediction from mammalian proteins http://www.cbs.dtu.dk/services/NetCGlyc/
YinOYang [44] Neural network predictions for O-b-GlcNAc binding sites in eukaryotic proteins, using predicted phosphorylation sites
http://www.cbs.dtu.dk/services/YinOYang/
most desired by the glycobiology community due to the tedious process traditionally being used to characterize glycans and glycoproteins. In particular, each mass peak was manually annotated by experts, resulting in months of analysis for one mass spectrum.
This problem was conventionally solved by developing a database of theoretical mass spectra corresponding to known glycan structures. Thus newly produced MS data could be compared with the theoretical spectra to find the most similar one, thus providing a clue as to the structures behind the new spectra [17].
More recently, as a result of the large volumes of MS data being produced by the CFG, the Cartoonist program was developed to automatically annotate N-glycans in MALDI-MS data [18]. The Cartoonist labels peaks in MALDI spectra of permethylated N-glycans with dia-grams, or cartoons, of the most plausible glycans consistent with the peak masses and the types of glycans being analyzed. There are three main parts to Cartoonist: (i) select annotations from a library of biosynthetically plausible cartoons, (ii) determine the precision and calibration of the machine used to generate the spectrum automatically based on the spectrum itself, and (iii) assign a confidence score to each annotation. As a result, the Cartoonist provides a list of all plausible annotations for each peak, associating each annotation with a confidence score.
In an attempt to predict any type of glycan structure from mass spectra, the GLYCH method was developed to use a dynamic programming method and a listing of all possible fragment types of glycans [19]. There are still difficulties, however, in distinguishing between differ-ent branches. Other online tools for annotating glycan structures from mass peaks include GlycoPep ID [20], Glyco-Mod [21], and GlycoPeakFinder [22].
Glycan Biomarker Prediction. Many glycan motifs are known to be involved in a variety of diseases including cancer [23]. Thus it came about that methods to predict characteristic glycan substructures from sets of known glycans may be useful in predicting such biomarkers. From the bioinformatics side, kernels are well-known as useful classifiers for large sets of data given a vector of features from which to extract the most likely candidates. Thus, several kernel methods for glycan biomarker prediction and classification have been developed. For an introduction to kernel methods, the interested reader is referred to the book Learning with Kernels by
Scholkopf and Smola [24]. Support vector machines (SVMs) are the most popular kernel method, where two (or more) classes of objects can be trained such that new objects can be classified according to the trained features of the objects. In addition to training and classification, new methods for ‘‘feature extraction’’ have been utilized in SVMs such that the most relevant features to the classification problem can be identified to improve training. This feature extraction method has subsequently been used, as will be described here, to extract possible glycan features that may serve as biomarkers. More details on feature extraction for computational biology can be found in the literature [25].
In glycome informatics, the layered-trimer kernel was first developed and used to verify the utility of using kernels for glycan biomarker prediction [26]. This method was further expanded as the q -gram distribution kernel [27], and a separate method combining multiple ker-nels was later used for glycan structure classification [28].
Layered-trimer kernel. Taking advantage of the fact that the glycan substructures at the leaves are more prone to be recognized compared to the root structures attached to proteins, a weighting scheme was employed that differentiated substructures based on their ‘‘depth’’ or the ‘‘layer’’ of the substructure, the number of glycosidic linkages between the substructure and the root. Furthermore, it is known that glycosyltransferases interact with three monosaccharides on average. Thus, glycan structures were decomposed into trimers. This produced a feature vector of trimers distinguished by layer, which was tested using a dataset of glycans related to different blood components as well as to leukemic cells. These annotations were retrieved from the original CarbBank database.
The kernel was defined using a weight-ing parameter for the layer of each glycan substructure, according to the following equation. Given the feature vectors for two glycans X and Y, their inner product is calculated asSwkxkyk, wherekis a feature, and so the summation is taken over all features. The weighting parameterwkis set to 1 when the layer of feature k is 1. Otherwise,wk=12exp(2ah), whereais a
positive constant to weighth, the layer of the matching substructures.
Using this kernel on the leukemia dataset described above, the model was able to extract a feature that was highly characteristic of leukemia, which was corroborated by experimental evidence.
Q-gram distribution kernel. This method extended the layered-trimer kernel in order to account for potential glycan biomarkers that were smaller or larger than trimers, without the use of layers, since it was assumed that layer information could be subsumed by the wider distribution of features. As a result, theq-gram distribution kernel could predict leukemia markers as equally well as the previous model, and, in addition, it found that sulfation was a major marker for cystic fibrosis, which is smaller than a trimer. Thus, a more flexible kernel was developed.
Multiple kernel. Finally, to more efficiently handle the large number of features required by the q-gram distribution kernel, a hierarchical model was developed, where a kernel for eachq was first developed, upon which another kernel was trained to extract the best feature from the best kernel. This model was again shown to produce similar results to the original layered-trimer kernel.
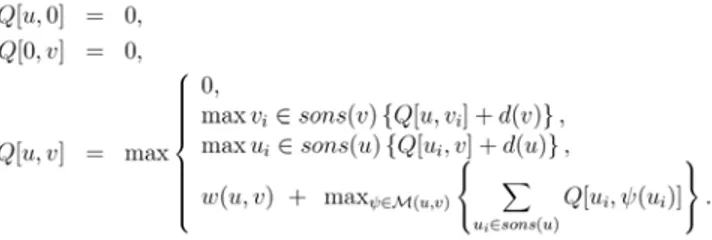
Glycan Structure Analysis. The tree structure of glycans has been a topic of interest especially for bioinformaticians interested in trees. Traditionally, RNA structures and phylogenetic analyses have been the focus of tree-based algorithms. However, these structures result in trees with information at the leaves, with internal nodes representing relationships between the leaves. Thus, glycans have provided a structure where internal and external nodes all represent the same type of object: monosaccharides. As a result, glycan structure alignment using tree alignment algorithms and glycosidic linkage score matrices has been developed and analyzed.
Glycan substitution matrix. This algorithm may now be used to analyze monosaccharide similarity, as in amino acid similarity, as represented by amino acid substitution matrices such as PAM [30] and BLOSUM [31]. However, unlike proteins, there are not functionally distinguished families of glycans, as they are considered more as modifiers of protein functions as opposed to function-regulating molecules in and of themselves. Furthermore, the linkage conformation information should also be taken into consideration. Therefore, an appropriate glycan score matrix would be one where glycosidic linkages and the monosac-charides being linked should be used as the basic unit for comparison. Glycan families can be defined computationally or be generated based on the classic
classi-fication of glycans, which is derived from the core structure, determined by the conjugate to which the glycans are bound. Once the appropriate classes of glycans are defined, the KCaM alignment results can be used to calculate the frequency of alignment of glycosidic linkages, which includes the full linkage information (car-bon numbers and conformation), as well as the two monosaccharide names which are linked (hereafter called ‘‘links’’). This score matrix of links is thus the log odds score of the expected frequency of alignment of link pairs [32]. From this matrix, we expect to find those links that are posi-tioned similarly, and thus those that are potentially ‘‘functionally’’ similar. This matrix can also be used to improve the KCaM algorithm to produce more bio-logically meaningful results.
Glyco-Gene Expression Analysis. In an attempt to overcome one of the major issues in glycomics, glycan structure characterization through MS, a bioinformatic method to predict glycan structures in a particular cell through the gene expression profiles was developed [33]. In this method, the concept of a ‘‘co-occurrence score’’ was calculated based on the co-occurrence of pairs of links within the same glycan structures. It was expected that by doing so the substrate specificity of glycosyltransferases could be captured in a single numerical matrix. Once this co-occurrence score matrix was developed, it could be used to make predictions from expression data.
This method was further improved such that (i) the database of glycans were augmented with new glycans that should exist and (ii) the prediction score for glycans used the expression values directly as opposed to using binary values. The first step was performed by analyzing the database of glycans and finding those that differed by more than one link. That is, considering the fact that glycosyltransfer-ases typically catalyze only one link at a time, if two similar glycans in the database existed, but differed by say two to four links, then ‘‘intermediate’’ glycans that should be catalyzed in the process of synthesizing the larger structure should Figure 3. Dynamic programming algorithm for aligning two tree structures, where
sons(x) refers to the children of nodex,d(x)is a gap penalty, andM(u,v)refers to all mappings between the children of nodesuandv.
doi:10.1371/journal.pcbi.1000075.g003
Figure 4. An example of the generation of a new glycan entry given two similar glycans.Since Entry 2 contains just two more nodes than Entry 1, and since in almost all cases glycosidic linkages are synthesized one by one, we can assume that the New Entry exists and can be added as a new structure.
also exist, and these ‘‘intermediate’’ gly-cans are added to the database. Figure 4 is an example, where a new entry can be presumed to exist and thus added to the database based on the two existing entries Entry 1 and 2. With this augmented database, it is hoped that better scoring results will be obtained. As a result, using a dataset of acute lymphocytic and myelo-cytic leukemia, those structures containing Lewis-a, Lewis-x, or sialyl-Lewis-x epi-topes, which are known to be related to cancer, were often ranked more highly compared to the original method. Fur-thermore, the newly added glycan entries were also found to be ranked highly in the results [34].
Glycan Structure Mining. Lectins are known to recognize specific glycan structures, whose binding events trigger signalling processes to occur. However, oftentimes the specific structures being recognized are unknown. For example, siglecs are suspected to recognize patterns not only at the leaves of glycans but also further deeper in the chain [35]. In order to find such patterns, which may not necessarily form a connected tree, a
tree-structure probabilistic model was developed, called the probabilistic sibling-dependent tree Markov model, or PSTMM [36,37]. This method not only included dependencies between parent and child, as in the hidden tree Markov model (HTMM) [38], but also included dependencies between consecutive siblings. Efficient algorithms were accord-ingly developed for the estimation of parameters and for training the model. This model was later improved for computational complexity while also maintaining the same level of perfor-mance. In this new ordered tree Markov model (OTMM) [39], instead of incor-porating dependencies to both elder sibling and parent from each node, only one dependency was used, where the eldest sibling depended only on the parent, and each younger sibling only depended on its older sibling.
In order to retrieve the learned patterns directly from the model, a profile version of these models, called ProfilePSTMM, was subsequently developed to add inser-tion and deleinser-tion states in addiinser-tion to the
original match state. This model was tested on binding affinity data of galectins, which are known to recognize galactose residues, but had not been analyzed for longer patterns. In this experiment, a dimer structure was found to appear highly in the data, which was corroborated by experimental results [40].
Conclusion
This tutorial briefly described several different bioinformatic methods for gly-come research. With the further develop-ment of data resources and standards for data exchange, we hope that even better and newer methods to help understand the functioning of the glycome can be devel-oped.
Acknowledgments
The author would like to dedicate this tutorial to Dr. Claus-Wilhelm von der Lieth of the German Cancer Research Center, with whom this tutorial was first presented at ISMB 2007 in Vienna, Austria. Dr. von der Lieth passed away in November 2007, leaving behind many great contributions to the field of glycomics.
References
1. Apweiler R, Hermjakob H, Sharon N (1999) On the frequency of protein glycosylation, as deduced from analysis of the SWISS-PROT database. Biochimica et Biophysica Acta 1473: 4–8. 2. Raman R, Venkataraman M, Ramakrishnan S,
Lang W, Raguram S, et al. (2006) Advancing glycomics: Implementation strategies at the Con-sortium for Functional Glycomics. Glycobiology 16: 82R–90R.
3. Hashimoto K, Goto S, Kawano S, Aoki-Kinoshita KF, Ueda N, et al. (2006) M KEGG: A glycome informatics resource. Glycobiology 16: 63R–70R.
4. Lu¨tteke T, Bohne-Lang A, Loss A, Goetz T, Frank M, et al. (2006) GLYCOSCIENCES.de: An Internet portal to support glycomics and glycobiol-ogy research. Glycobiolglycobiol-ogy 16: 71R–81R. 5. Freeze HH (2006) Genetic defects in the human
glycome. Nat Rev Genet 7: 537–551. 6. Green RS, Stone EL, Tenno M, Lehtonen E,
Farquhar MG, et al. (2007) Mammalian N-glycan branching protects against innate im-mune self-recognition and inflammation in auto-immune disease pathogenesis. Immunity 27: 308–320.
7. Hakomori S (2002) Glycosylation defining cancer malignancy: New wine in an old bottle. Proc Natl Acad Sci U S A 99: 10231–10233.
8. Varki A, Cummings R, Esko J, Freeze H, Hart G, et al. (1999) Essentials of glycobiology. Cold Spring Harbor (New York): Cold Spring Harbor Laboratory Press.
9. Banin E, Neuberger Y, Altshuler Y, Halevi A, Inbar O, et al. (2002) A novel linear code nomenclature for complex carbohydrates. Trends Glycosci Glycotech 14: 127–137.
10. Doubet S, Albersheim P (1992) CarbBank. Glycobiology 2: 505.
11. Packer NH, von der Lieth CW, Aoki-Kinoshita KF, Lebrilla CB, Paulson JC, et al. (2008) Frontiers in glycomics: Bioinformatics and biomarkers in disease. Proteomics 8: 8–20. 12. von der Lieth CW, Bohne-Lang A, Lohmann KK,
Frank M (2004) Bioinformatics for glycomics:
Status, methods, requirements, and perspectives. Brief Bioinform 5: 164–178.
13. von der Lieth CW, Lu¨tteke T, Frank M (2006) The role of informatics in glycobiology research with special emphasis on automatic interpretation of MS spectra. Biochimica et Biophysica Acta 1760: 568–577.
14. Lu¨tteke T, Frank M, von der Lieth CW (2005) Carbohydrate Structure Suite (CSS): Analysis of carbohydrate 3-D structures derived from the PDB. Nucleic Acids Res 33: D242–D246. 15. Krambeck FJ, Betenbaugh MJ (2005) A
mathe-matical model of N-linked glycosylation. Biotech-nol Bioeng 92: 711–728.
16. Umana P, Bailey JE (1997) A mathematical model of N-linked glycoform biosynthesis. Bio-technol Bioeng 55: 890–908.
17. Lohmann KK, von der Lieth CW (2003) GLYCO-FRAGMENT: A web tool to support the interpretation of mass spectra of complex carbohydrates. Proteomics 3: 2028–2035. 18. Goldberg D, Sutton-Smith M, Paulson J, Dell A
(2005) Automatic annotation of matrix-assisted laser desorption/ionization N-glycan spectra. Proteomics 5: 865–875.
19. Tang H, Mechref Y, Novotny M (2005) Auto-matic interpretation of MS/MS spectra of oligosaccharides. Bioinformatics 21 (Supplement 1): i431–i439.
20. Irungu J, Go EP, Dalpathado DS, Desaire H (2007) Simplification of mass spectral analysis of acidic glycopeptides using GlycoPep ID. Anal Chem 79: 3065–3074.
21. Cooper CA, Gasteiger E, Packer NH (2001) GlycoMod: A software tool for determining glycosylation compositions from mass spectromet-ric data. Proteomics 1: 340–349.
22. Maass K, Ranzinger R, Geyer H, von der Lieth CW, Geyer R (2007) ‘‘Glyco-Peakfin-der’’—De novo composition analysis of glyco-conjugates. Proteomics 7: 4435–4444. 23. Ohtsubo K, Marth J (2006) Glycosylation in
cellular mechanisms of health and disease. Cell 126: 855–867.
24. Scholkop B, Smola AJ (2002) Learning with kernels: Support vector machines, regularization, optimization, and beyond. Cambridge (Massa-chusetts): MIT Press.
25. Scholkopf B, Tsuda K, Vert JP (2004) Kernel methods in computational biology. Cambridge (Massachusetts): MIT Press.
26. Hizukuri Y, Yamanishi Y, Nakamura O, Yagi F, Goto S, et al. (2005) Extraction of leukemia-specific glycan motifs in humans by com-putational glycomics. Carbohydr Res 340: 2270–2278.
27. Kuboyama T, Hirata K, Aoki-Kinoshita KF, Kashima H, Yasuda H (2006) A gram distribution kernel applied to glycan classification and motif extraction. Genome Inform 17: 25–34. 28. Yamanishi Y, Bach F, Vert JP (2007) Glycan
classification with tree kernels. Bioinformatics 23: 1211–1216.
29. Aoki KF, Yamaguchi A, Ueda N, Akutsu T, Mamitsuka H, et al. (2004) KCaM (KEGG Carbohydrate Matcher): A software tool for analyzing the structures of carbohydrate sugar chains. Nucleic Acids Res 32: W267–W272. 30. Dayhoff M (1978) Atlas of Protein Sequence and
Structure. Volume 5: Supplement 3. Washington (D.C.): National Biomedical Research Foundation. 31. Henikoff S, Henikoff JG (1992) Amino acid substitution matrices from protein blocks. Proc Natl Acad Sci U S A 89: 10915–10919. 32. Aoki KF, Mamitsuka H, Akutsu T, Kanehisa M
(2005) A score matrix to reveal the hidden links in glycans. Bioinformatics 21: 1457–1463. 33. Kawano S, Hashimoto K, Miyama T, Goto S,
Kanehisa M (2005) Prediction of glycan structures from gene expression data based on glycosyl-transferase reactions. Bioinformatics 21: 3976– 3982.
34. Suga A, Yamanishi Y, Hashimoto K, Goto S, Kanehisa M (2007) An improved scoring scheme for predicting glycan structures from gene ex-pression data. Genome Inform 18: 237–246. 35. Varki A (1997) Sialic acids as ligands in
36. Aoki KF, Ueda N, Yamaguchi A, Kanehisa M, Akutsu T, et al. (2004) Application of a new probabilistic model for recognizing complex patterns in glycans. Bioinformatics 20: i6–i14. 37. Ueda N, Aoki KF, Mamitsuka H (2004) A general
probabilistic framework for mining labelled ordered trees. Proceedings of the Fourth SIAM International Conference on Data Mining; April 2004; Orlando, Florida, United States. SDM 2004: 357–368.
38. Diligenti M, Frasconi P, Gori M (2003) Hidden tree Markov models for document image classi-fication. Trans Pattern Anal Mach Intell 25: 519–523.
39. Hashimoto K, Aoki-Kinoshita KF, Ueda N, Kanehisa M, Mamitsuka H (2006) A new efficient
probabilistic model for mining labeled ordered trees. International Conference on Knowledge Discovery and Data Mining; August 2006; Philadelphia, Pennsylvania, United States. pp 177–186.
40. Aoki-Kinoshita KF, Ueda N, Mamitsuka H, Kanehisa M (2006) ProfilePSTMM: Capturing tree-structure motifs in carbohydrate sugar chains. Bioinformatics 22: e25–e34.
41. Eisenhaber B, Bork P, Yuan Y, Loeffler G, Eisenhaber F (2000) Automated annotation of GPI anchor sites: Case studyC. elegans. TIBS 25: 340–341.
42. Bohne-Lang A, von der Lieth CW (2005) GlyProt: In silico glycosylation of proteins. Nucleic Acids Res 33: W214–W219.
43. Fankhauser N, Ma¨ser P (2005) Identification of GPI anchor attachment signals by a Kohonen self-organizing map. Bioinformatics 21: 1846– 1852.
44. Gupta R, Brunak S (2002) Prediction of glycosyl-ation across the human proteome and the correlation to protein function. Pac Symp Bio-comput 7: 310–322.
45. Hansen JE, Lund O, Tolstrup N, Gooley AA, Williams KL, et al. (1998) NetOglyc: Prediction of mucin type O-glycosylation sites based on sequence context and surface accessibility. Glycocon J 15: 115–130.