Dimitra Alkisti Pliatsika
Aeolian sediment transport potentials and dune evolution
in Ancão Peninsula (Ria Formosa), Portugal
Master in Marine and Coastal Sciences
Work performed under the supervision of
Dr. Susana Costas, PhD and Prof. Dr. Óscar Ferreira
UNIVERSIDADE DO ALGARVE
FACULDADE DE CIÊNCIAS E TECNOLOGIA
Copyright ©
Declaro ser a autora deste trabalho, que é original e inédito. Autores e trabalhos consultados estão devidamente citados no texto e constam da listagem de referências incluída.
I declare to be the author of this work, which is original and unpublished. Authors and works consulted are duly cited in the text and are included in the list of references.
A Universidade do Algarve reserva para si o direito, em conformidade com o disposto no Código do Direito de Autor e dos Direitos Conexos, de arquivar, reproduzir e publicar a obra, independentemente do meio utilizado, bem como de a divulgar através de repositórios científicos e de admitir a sua cópia e distribuição para fins meramente educacionais ou de investigação e não comerciais, conquanto seja dado o devido crédito ao autor e editor respetivos.
The University of Algarve reserves the right, in accordance with the provisions of the Code of the Copyright Law and related rights, to file, reproduce and publish the work, regardless of the used mean, as well as to disseminate it through scientific repositories and to allow its copy and distribution for purely educational or research purposes and non-commercial purposes, although be given due credit to the respective author and publisher.
____________
Dimitra Alkisti Pliatsika
i
Table of Contents
1. Introduction……...………...……...……….…1
2. Objectives……...………...……...…………..………...…3
3. State of the Art……...………...……...………..……....…...5
3.1. Dune morphology………..……...……….…..5
3.1.1. Incipient/ Embryo Dunes ……...……….……….…....6
3.1.2. Foredunes………..….……….…...………....…...7
3.1.3. Hind dunes………...….………...……….………8
3.2. Beach-dune interaction ……...………...……...…...…8
3.4. Shear velocity and threshold of sand movement………...………..……...…..14
3.5. Sediment Transport…………...………...………...……...………...16
3.5.1. Aeolian transport modes………...…………...………...…...………..……16
3.5.2. Sediment transport factors…………...……….…...…....……...…….16
4. Study Area...…………...………...…………...……...………...18
4.1. Geographical and geomorphological setting …………...……….…..18
4.2. Oceanographic setting…………...………...………...….…...……....23
4.3. Ancão Inlet…………...………...……...……….…………..23
4.4. Vegetational setting…………...………...……...………....24
5. Methodology…………...………...……...…...….……….25
5.1. Evaluation of dune geomorphology and morphological changes………..26
5.2. Dune geomorphology …………...………...……...……....28
5.3. Vegetation communities mapping…………...………….………....……..31
5.4. Textural analysis…………...………..…………...…...……...…………....35
5.5. Wind field regime…………...………...……...…………...36
5.6. Aeolian sediment transport potentials and dune activity…………...………...…...37
5.7. Shoreline evolution…………...………...……...………….39
6. Results…………...………...……...……….……..42
6.1. Textural analysis…………...………...………...……...……….…….42
6.2. Wind field regime…………...………...………...……...………..…...45
6.3. Dune morphology…………...………...………...……...………..…...49
6.4. Shoreline evolution…………...………...……...…….……55
6.5. Vegetation identification and mapping…………...………...…………..…..62
6.6. Aeolian sediment transport potentials estimation…………...………..…65
6.7. Volumetric changes…………...………...……...………....66 7. Discussion…………...………...……...……….…73 8. Conclusions………....84 Bibliography …………...…………...………...………...……...………….…87 Annex 1……...………...99 Annex 2……….………..100
ii
List of Figures
Figure 1.1: Image of Ria Formosa showing the peninsulas, inlets and barrier islands (Ceia et al.,
2010). ... 3
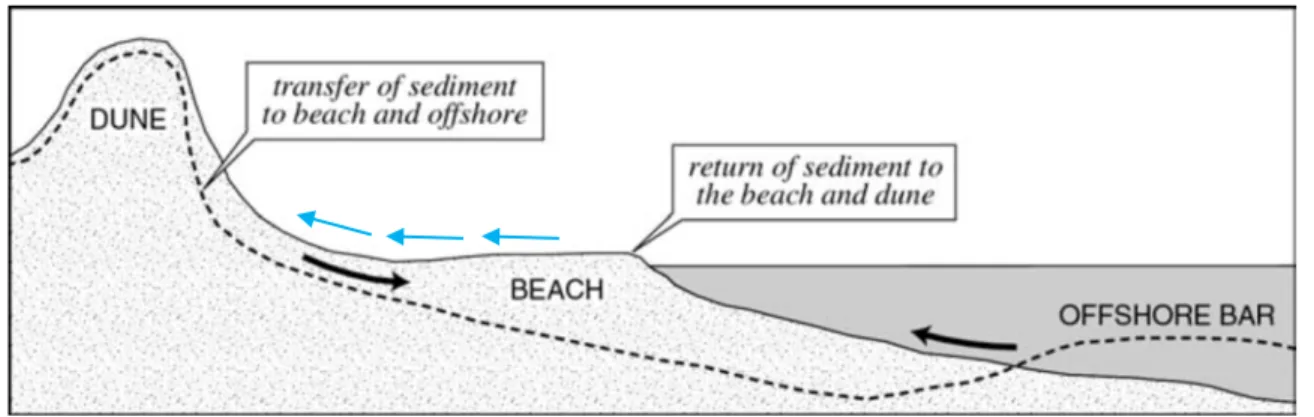
Figure 3.1: Exchange of sand within the sand-sharing system, the arrows represent the sediment
exchange derived from wave (black arrows) and from wind processes (blue arrows) (modified from Psuty, 2004)…...……….……….6
Figure 3.2: Illustration of the three geomorphological zones of the backshore. (adapted from
http://www.mrstevennewman.com/geo/Stockton/Biophysical_Interactions/geomorphological_pr ocesses)...7
Figure 3.3: In a stable dune ecosystem the landform consists of an incipient dune, followed by the
foredune and landward by a hind dune………..………..………..……..…8
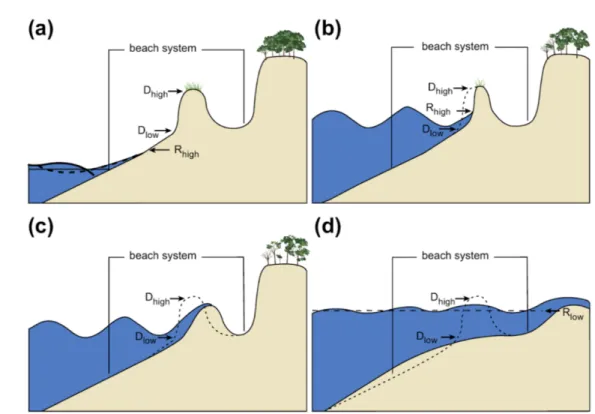
Figure 3.4: Sallenger's (2000) regimes and predictions of beach changes applied for barrier
islands. (a) Swash regime: wave run-up confined to beach, temporary erosion, offshore sediment transport followed by non-storm return and no net change to the system. (b) Collision regime: wave run-up exceeds the elevation of the base of the dune, run-up collision causes erosion and occasionally net or (semi-) permanent dune retreat, depending on the sediment availability. (c) Overwash regime: wave run-up exceeds the dune elevation or beach berm, overtopping transports the sand landward to produce net profile change and eventually landward barrier migration. (d) Inundation regime: combined wave run-up and storm surge exceeds the elevation of low seaward dunes to inundate the entire beach; if the barrier is also narrow, the entire island may be inundated, which can result in net change and landward barrier migration landward. Rhigh is the maximum Runup elevation and Rlow is the effective still-water level during a storm, Dhigh is the elevation of the dune crest and Dlow is the elevation of the dune toe. (Credit: (USGS) United States Geological Survey, in: Hansom et al., 2015)………...…….9
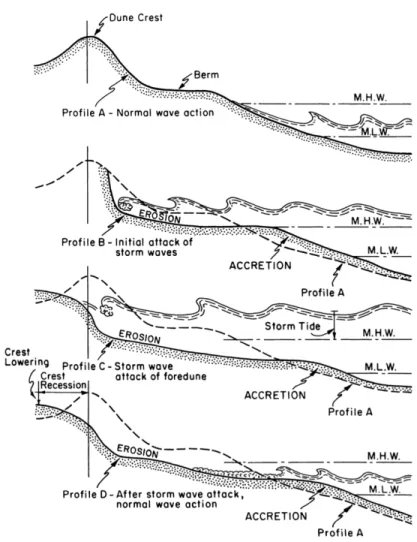
Figure 3.5: Schematic diagram showing the progressive effect of storm waves on a foredune/beach
system. During the initial stages of wave attack, the average level of the foreshore is lowered and the berm is removed as sand is moved offshore (after CERC, 1977 in Pye & Tsoar, 2009)………..………...…...11
Figure 3.6: Scheme of sand transport by aeolian mechanisms over foredunes, for bare and
vegetated foredunes, with different combinations of wind speed (high-low). + : potential deposition, - : erosion; Ø : no transport (Arens, 1996)………..13
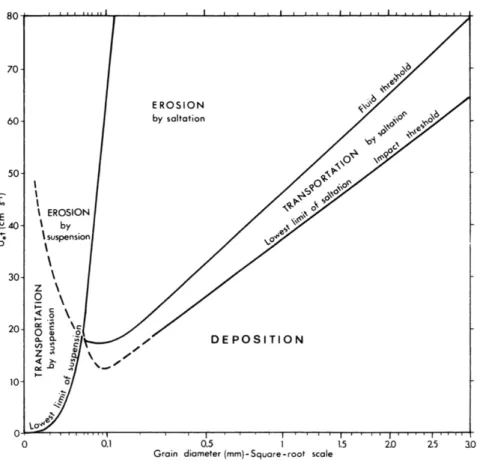
Figure 3.7: Variation of the fluid threshold velocity and the impact threshold velocity with grain
size. The distinctions between the saltation and suspension modes of transport, and between erosion, transportation and deposition are also shown. (Data partly from Bagnold (1941) and Chepil (1945b) in Pye & Tsoar, 2009)……….………..15
Figure 3.8: Schematic diagram illustrating the drag force (FD), lift force (FL) and gravitational
force (FG) exerted on a static grain by wind flow, as the arrows indicate. On the upper left are the wind profile and the streamlines ensuing from it. The grain starts to role when the drag and lift force exceed the gravitational force………..…….………..……..17
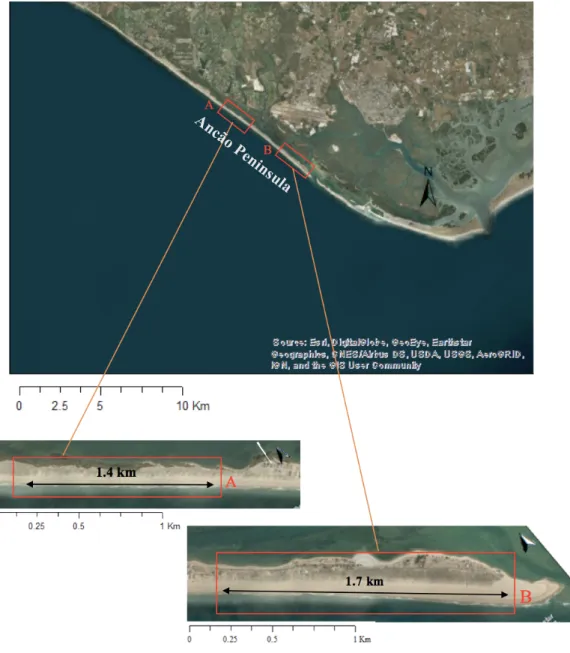
Figure 4.1: Close up view (upper panel) of the study area of Ancão Peninsula, including the two
parts of interest (sectors A: western and B: eastern) at the lower panels (map: www.bing.com/maps). ... 19
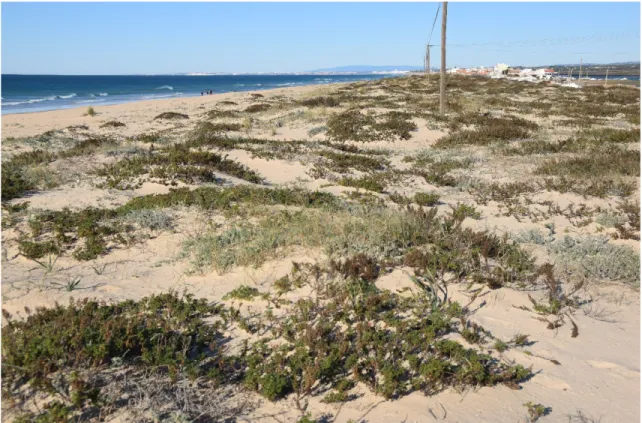
Figure 4.2: Perspective of the western side of the peninsula. The early vegetation zone is quite
narrow and well defined and the ridge is distinct and continuous with some evidence of ancient dune scarping. ... 21
iii
Figure 4.3: Dune setting in the east sector at a stable dune position. The subtle undulations are
evident. Praia de Faro settlement (central sector) is visible at the top-wright corner of the picture. ... 22
Figure 4.4: Map of the Iberian Peninsula coastline divided in stretches of specified bioclimatic
and biogeographic features. The study area lies within the ‘Iberian Atlantic Coast’ section that stretches between Ria de Aveiro, Portugal (6) and Punta de Tarifa, Spain (17). Adapted from Asensi & Diez-Garretas, 2017. ... 25
Figure 5.1: Overall illustrative map of the used dataset (Orthophoto of 2014). ... 28 Figure 5.2: Detailed map of vegetation sampling locations in eastern and western sector at seven
selected sites. ... 32
Figure 5.3: Scheme of a typical coastal zonation representing EU habitats complementing Table
2. In Ancão Peninsula the given developed habitat types extend until the fixed dunes (code 2130) (adapted from Prisco et al., 2012). ... 34
Figure 5.4: The profiles in Ancão Peninsula, across which the sand samples were acquired
(beachface, backshore and dune toe), with the positions being obtained by RTK-GPS (photo from 2011 Lidar dataset). ... 36
Figure 6.1: Mean Grain size (µm) vs sorting per zone. ... 42 Figure 6.2: Grain size distribution per site and morphology of all samples in respect to their
sampling date. The vertical dashed lines discriminate each profile. BF: beachface, BS: backshore, D: Dune toe/Dune ... 43
Figure 6.3: Mean grain size (µm) versus sorting per profile for 29 beach samples of 2016-2017.
... 44
Figure 6.4: Skewness vs mean grain size per position plot for all sites. ... 44 Figure 6.5: Wind rose showing the speed and frequency of wind blowing for the study area. ... 45 Figure 6.6: a) Wind velocities distribution of favourable directions (1997-2016). The dark blue
line represents the shoreline orientation. b) Wind velocities direction above the threshold (>8.9 m/s). ... 46
Figure 6.7: Average monthly velocities for events above the threshold (8.9 m/s), in blue, and
number of these events per month (in green) for the 1997-2016 period. The gaps in the graph line represent either absence of windy events in the corresponding month or as referred in the ‘Methodology’ section for November and December 2013 and for 2014 a deficiency of the direction data. On the graph, the months with more than 180 windy events are noted. ... 48
Figure 6.8: Location of the six extracted profiles in the study area (UAV dataset, 2016). ... 50 Figure 6.9: Cross-shore profiles at four selected sites in the eastern area of Ancão Peninsula
extracted from Lidar datasets (2009 and 2011) and DTM (2016). ... 52
Figure 6.10: Cross-shore profiles at two selected sites in the western area of Ancão Peninsula
extracted from Lidar datasets (2009 and 2011) and RTK-GPS surveyed cross-shore profiles (2016). ... 53
Figure 6.11: Dune ridge elevation at the eastern (upper panel) and western (lower panel) areas.
The primary dune area is not depicted, rather the height of the dune ridge is emphasized. The studied profiles are depicted as well for each side respectively. ... 55
Figure 6.12: Net shoreline movement (NSM) between 1952 and 2014, using the dune vegetation
line proxy (Orthophoto of 2014). ... 56
Figure 6.13: Linear regression rate variation (vegetation line approach) between 1952-2014
iv
Figure 6.14: Shoreline movement rates per year using the vegetation line proxy, for the analysed
periods. ... 58
Figure 6.15: Net shoreline movement (NSM) for 1952-2014 period using the tide mark line
approach. ... 60
Figure 6.16: Linear regression rate using the tide mark line approach for 1952-2014 period. .... 61 Figure 6.17: Representation of the correlation coefficient ranges (no threshold application). .... 61 Figure 6.18: Annual sediment transport potentials for 1997-2016 by use of one mena grain size
(beachface environment) and the cosine of the angle of wind perpendicular to the shore. For the 11th and 12th month of 2013 and for 2014 the sediment transport potentials were not calculated and thus not presented, due to gap in the data. The plot is presented in kg/m and m3/m. ... 65
Figure 6.19: Annual sediment transport potentials using the percentages of weights presented for
the western area. ... 66
Figure 6.20: Polygon R5 of the western area. The elevation of the specified surface is displayed
for 2009 and 2011 in the top panels. The vertical difference for this period is presented in the bottom left polygon. Lidar dataset of 2009 had a higher grid resolution compared to the 2011 dataset, hence the representation of raster polygon (top right) for 2011 is poorer. ... 67
Figure 6.21: R3 polygon for the eastern area is demonstrated for years 2009, 2011 and 2016. The
vertical difference is presented in the bottom polygons for periods 2009-2011 (left) and 2011-2016 (right). ... 69
Figure 6.22: Surface vertical elevations for polygon R2 for the 2009-2011 (down left) and
v
List of Tables
Table 1: Unified applied dataset with all constituents used for the investigation of the dune system
state, development and sediment transport potentials………...…26
Table 2: Habitat type classification (within the Natural Park of Ria Formosa) in dune systems of
the surveyed areas according to EU Habitats Directive (92/43/EEC) (European Environmental Agency (EEA)). ………36
Table 3: Supplementary table of existing species in Ancão Peninsula. ………...…38 Table 4: Morphological zones of distinct dune habitats at the selected transects in the western area.
The (-) sign signifies the absence of that morphological zone at the specific transect. The numbering of the morphologies starts from the shore. Transect 5 is the most eastern transect in the western area (near the bridge) and Transect 8 is the most westward……...………..…53
Table 5: Geomorphological zone classification with distinct dune habitats at the selected transects
in the eastern area. The numbering of the morphologies starts from the shore. The (-) sign signifies the absence of that morphological zone at the specific transect. ……..………54
Table 6: Average annual evolution rates for the western, middle and eastern area of Ancão
Peninsula in four distinct periods of examination. ………63
Table 7: Volumetric difference as resulted for the respective polygons and periods. ………….75 Table 8: Comparison table of results from formula estimations (two methods of calculation) and
from the Lidar and UAV datasets for volumes and average annual transport rates. For the period 2009-2011 computations, the percentages-of-weights approach was applied using the grain size results of the western area, as R5 site (of western area) was included. Conversely, for the period 2011-2016, the results of the eastern grain size analysis were used. ………75
Table 9: Comparison table of average annual velocity of windy events, sum of windy events
vi
Acknowledgments
I am thankful to my supervisors, Susana Costas for all her guidance and assistance and Professor Óscar Ferreira for his constant help and detailed explanations. Appreciation is also owed to Katerina Kombiadou (CIMA, University of Algarve) for her instructions and support in GIS. A hearty thanks to my parents for always being present.
vii
Abstract
In the present study is attempted to examine aeolian sediment transport potential and to determine the constituents that promote/restrict the dune system development of Ancão Peninsula, where, apparent alongshore geomorphological differences, i.e. western and eastern sector, exist. In this study were investigated: wind potential for sediment transfer over the last 20 years (1997-2016) using recent granulometric data, dune morphology and elevation changes obtained from RTK-GPS beach profiles (2016), volumetric changes in three backshore polygons extracted from Lidar and UAV datasets (2009-2011 and 2011-2016) in both sectors. Presence of species communities of vegetation and shoreline evolution rates (1958-2014) as an indirect indicator for dune morphology were also used. Additional key parameters, namely littoral drift, updrift nourishment interventions and effect of Ancão Inlet were also considered.
A windy event was defined at velocity above 8.9 m/s for a mean beachface grain size of 466 µm. Accounting for onshore winds and steering of the peninsula, only 1.7% of the winds was responsible for potential sediment transport. Moreover, the wind records, revealed that the windier years for potential transfer were 2002 (1.7 m3/m), 2009 (2.1 m3/m) and 2010 (1.8 m3/m). Shoreline evolution showed negative values (retreat) for the western and central sector of the peninsula (-0.2 m/yr and -0.25 m/yr respectively) and accretional (+0.79 m/yr) for the eastern. The volume change rates for 2009-2011 show accumulation with very low positive values for the western sector that progressively increase towards the eastern (from eastern polygon: 0.85 m3/(m.yr) to western: 7.32 m3/(m.yr)). The vegetational communities in the two sectors are compatible to the respective morphologies. In the western sector the absence of typical embryo dune vegetation (e.g. Elymus
farctus, Eryngium maritimum) conforms with the absence of new foredune development. In the
western part of the eastern sector, sparse embryo dune vegetation with low density is present, whereas in the most eastward part of the peninsula -in the inlet vicinity- two seaward developing foredunes are formed.
Assembling all elements, it is concluded that the mild wind regime in conjunction with the existing coarse grain size permits the development of relatively small dunes. In the western sector the vegetation suggests dune maturity, however the updrift nourishments have contributed to shoreline stabilization and subsequently to restriction of dune erosion. On the eastern sector nevertheless, the presence of Ancão inlet fostered creation of accommodation space through shoreline progradation, and hence incipient dune vegetation and new embryo dunes formation.
vii
Resumo
No presente estudo avaliou-se o potencial eólico de transporte sedimentar e determinaram-se os fatores responsáveis pela promoção/restrição do desenvolvimento do sistema dunar da Península do Ancão, onde se verificam diferenças geomorfológicas, por exemplo entre os sectores este e oeste. Este estudo analisou o potencial eólico na transferência de sedimentos nos últimos 20 anos (1997-2016), utilizando para tal dados granulométricos recentes, a morfologia dunar e variações de elevação obtidas a partir de perfis de praia efetuados com RTK-GPS (2016) e a determinação de mudanças volumétricas em três polígonos costeiros extraídos de conjuntos de dados de Lidar e UAV (2009-2011 e 2011-2016). Utilizou, ainda, a presença de comunidades de espécies de vegetação dunar e taxas de evolução da linha de costa (1958-2014) como indicadores indiretos para a evolução da morfologia das dunas. Parâmetros-chave adicionais, nomeadamente a deriva litoral, as intervenções de realimentação de praia e o efeito da Barra do Ancão foram também considerados na análise.
Foram definidos como eventos com capacidade de transporte eólica os registos em que a velocidade do vento foi superior a 8,9 m/s, para um tamanho médio de grão de praia de 466 µm. Tendo em consideração os ventos dirigidos para terra e a direção da península, verifica-se que apenas 1,7 % dos ventos foram responsáveis por transporte potencial de sedimentos. Os registos de vento revelaram que os anos com maior potencial de transporte eólico foram 2002 (1,7 m3/m), 2009 (2,1 m3/m) e 2010 (1,8 m3/m). A evolução da linha de costa mostrou valores negativos (recuo) para os setores ocidental e central da península (-0,2 m/ano e -0,25 m/ano, respetivamente) e avanço da linha de costa (+0,79 m/ano) no sector este. As taxas de variação volumétrica, entre 2009 e 2011, mostram acumulação, com valores positivos muito baixos para o setor ocidental que aumentam progressivamente em direção a leste (R5: 0,85 m3/m ano, R3: 1,2 m3/m ano, R2: 7,32 m3/m ano). As comunidades vegetais dos dois setores são compatíveis com as respetivas morfologias. No sector ocidental, a ausência de vegetação típica das dunas embrionárias (por exemplo Elymus farctus, Eryngium maritimum) está em conformidade com a ausência de desenvolvimento de um novo cordão dunar frontal. Para oeste do setor oriental, verifica-se a existência de vegetação de dunas embrionárias, com baixa densidade, enquanto que na parte mais a leste da península - na vizinhança da barra de maré – se desenvolveram duas crista de dunas frontais, em direção ao mar.
ix
Conclui-se que o regime de ventos moderado, em conjunção com o tamanho de grão grosseiro existente, limita a promoção do crescimento dunar. No setor ocidental, a vegetação sugere que as dunas apresentam um elevado estado de maturidade. As realimentações de praia efetuadas a barlamar contribuíram para a estabilização da evolução da linha de costa e, subsequentemente, para a redução da erosão das dunas. No sector oriental, a presença da Barra do Ancão fomentou a criação de espaço de acomodação, através da progradação da linha de costa e permitiu, consequentemente, a formação de vegetação dunar incipiente e a formação de novas dunas embrionárias.
1
1. Introduction
A large proportion of the world population lives at, or near, the coastal zone, which results in high impact and degradation of coastal ecosystems, such as the coastal dunes. These ecosystems are particularly threatened by the impact of human activities, because of increasing demand of sun and beach tourism throughout the world, and also by residential, touristic or industrial purposes (e.g. Martínez et al., 2004; Martinez et al., 2013).
It has been also widely demonstrated that coastal dune systems represent beach sand reservoirs, especially during extreme episodes of wave storms, equinoctial spring tides or overwashes, including those generated by tsunamis (Navarro et al., 2015). Therefore, sand dunes play an essential role in sedimentary beach equilibrium protecting the littoral fringe from erosion (Navarro et al., 2015), especially on low-lying coasts. In many cases, opposed to sea dikes, dunes have the advantage of being built by naturally occurring processes and are in favour of recreational use. The disadvantage is that dune systems are dynamic and the safety level provided by dunes is variable in time. Therefore, significant management and frequent safety assessments are needed (de Vries et al., 2012). As an example, in many parts of the western Netherlands, where extensive areas of agricultural land and urban development lie at or below mean high water level (MHWL), and up to 5 m below storm surge level, the primary sea defence system depend on great extent on sandy beaches and dunes (see Pye & Tsoar, 2009). For instance, at the northern coastline of France, an 8-km preserved dune barrier is not only an appreciated recreational area and a ‘natural’ landscape, but mostly a protective natural barrier against marine intrusion (Ruz et al., 2005). Also, along large sections of the Atlantic East and Gulf Coasts (USA), barrier dune systems have been erected as stabilizing agents (Leatherman, 1979).
Under this perspective, a continuous belt of coastal dunes acts as a barrier to wave overwash and flooding of the inland area, performing a similar function as a seawall, but representing a nature-based solution. In many situations coastal dunes have a number of advantages over seawalls: (a) they are considerably less expensive to construct and maintain (Sutton-Grier et al., 2015); (b) dunes act as a sand store which can release sand to the beach during periods of storm wave attack, thereby helping to dissipate wave energy (Leatherman, 1979); (c) they are more flexible than seawalls and can adjust to changing conditions, such as a long-term fall in beach levels or a natural tendency for shoreline retreat; and (d) they have a less damaging visual impact on the coastline
2
(Pye & Tsoar, 2009). Additionally, although dunes reflect some wave energy during storms, the degree of wave reflection and consequent beach scouring is less severe than that induced by seawalls (Leatherman, 1979).
Another undeniable aspect is that coastal dunes and adjacent broad sandy beaches due to their attractiveness have provided settings for permanent residential development, holiday homes, caravan parks and camping sites. Such developments not only have a direct physical impact arising from the levelling of dunes and extraction of sand for construction, but also have a number of indirect effects which arise when large numbers of residents or visitors are attracted to the area (Nordstrom & McCluskey, 1985). Damaging effects associated with a large number of pedestrians include picking and trampling of vegetation, physical erosion by the passage of feet and initiation of wind funnelling along trackways, leading to the development of blowouts. Pressure is particularly severe around beach access points, and great care must be taken to ensure that public facilities are properly sited and cordoned off from adjoining sensitive areas (see Pye & Tsoar, 2009). Additionally, they may serve as groundwater rechargeareas and storage against saltwater intrusion (Martínez et al., 2004).
In the present study, the aeolian activity that is responsible for dune formation and development, will be investigated for Ancão Peninsula of the Ria Formosa barrier island system (Figure 1.1) Principally, wind is the main contributor to dune formation or modification. Sand blown from the beach or foreshore is transferred to accumulate on the zone above high tide level, and developed as dunes, which may remain deposited or be swept further inland or along the coast by wind action. Dune growth and shaping is related to a source of, usually, dry sand that can be moved by wind, governed by wind flow characteristics, rates of aeolian transport, vegetation and patterns of erosion and deposition. Dune development takes place in the backshore and is aided by frequent strong onshore winds and by availability of a wide sandy beach as a source area (long fetch distance). It is also influenced by wave processes, especially when storm waves trim back the seaward dune margins. They are more often found behind wide gently sloping dissipative beaches than behind steeper, coarser and narrower reflective. Therefore, newly formed dunes are usually associated with prograding sandy coasts (Bird, 2008).
The multiple array of contributions that dune ecosystems provide are at risk, either if induced from erosional processes, related to climatic and hydrodynamic conditions, or caused from man constructions and interference. Yet, erosion is probably the most substantial factor of dune
3
shrinkage and retreat. Sediment erosion dominates over accretion on at least 70% of the world’s sandy shorelines, which results in an inland displacement of the shoreline (Bird, 1985) and consequently coastal dune retreat is a major concern along coastlines. In addition, among the causes behind coastal erosion, sea level rise is one of the major global concerns that is likely to affect coastlines and barrier islands throughout the world in the upcoming years. Hence, no barrier island system is immune to erosional or sea level rise threats; however, some areas will be affected more than others and only the most robust systems will be able to withstand sea level rise without sustaining great damage (Greene, 2002). Such systems will be to a lesser or greater extend preserved by providing adequate sediment supply (Ceia et al., 2010).
The dune system of Ancão Peninsula of Ria Formosa barrier island system is therefore attempted for investigation to render explanations regarding its activity and whether dune development is governed by aeolian sand transfer or further components, as shoreline evolution and present geomorphological features, i.e. Ancão Inlet. Within this framework, understanding the processes that occur and affect a dune system in a low-lying peninsula, will give additional insights into vulnerabilities and impacts on coastal dunes.
Figure 1.1: Image of Ria Formosa showing the peninsulas, inlets and barrier islands (Ceia et al., 2010).
4
2. Objectives
More specifically, the present study is aiming to:
i. characterise the morphology of the sand dunes of the east and western part of Ancão Peninsula based on aerial photographs and Lidar data.
ii. estimate the evolution of the dunes and their vertical variation within two pre-selected areas, using available Lidar datasets (2009 and 2011), UAV (Unmanned aerial vehicle, “UAV”) dataset (2016) and cross-shore profiles surveyed during 2016 and 2017.
iii. determine recent (decadal) shoreline changes and compare the obtained trends with the observed dune morphologies.
iv. characterize the wind field regime and determine the conditions under which aeolian sediment transport can occur, based on observations from the meteorological station located at Faro airport (1997-2016).
v. evaluate aeolian sediment transport potentials based on windfield regimes, sediment texture and observed morphological changes.
vi. classify the vegetation cover and correlate the different species with dune morphology and evaluate linkages with dune maturity.
Finally, all above results will be integrated to determine which factors may have a major impact on aeolian sediment transport and dune growth within the explored areas.
5
3. State of the Art
3.1. Dune morphology
Aeolian sand dunes can be discriminated in continental and coastal, depending on the setting where they form and evolve, and depending on the major processes responsible for their shaping and growth. The present study will focus on coastal dunes.
Coastal sand dunes are aeolian land formations of accumulated sand sized sediments in coastal areas, where, provided the adequate sediment supply, energetic/strong enough onshore winds can move the sand (Pye, 1983; Kocurek & Lancaster, 1999; Martínez et al., 2004). The sediments for the development and evolution of most dunes are derived from material transported by fluvial or littoral processes (Lancaster, 2009). Their deposition occurs against obstacles such as driftwood or within vegetation or strand litter (Bird, 2008). Coastal dunes are broadly distributed ecosystems, notably along the Atlantic coasts of Europe, the Pacific coast of America, or the SE Australia and southern Africa coasts, and feature great diversity in terms of geomorphological dimensions and environmental heterogeneity (Martínez et al., 2004; Bird, 2008).They occur more extensively on the windward coasts behind sandy beaches and in a variety of dimensions from minor hummocks of 0.5 m to huge ridges measuring more than 100 m in elevation; from a single, shore-parallel, linear ridge with a width of a few tens of meters to a complex of dune forms that extend inland tens of kilometers (Psuty, 2004; Bird, 2008). Psuty (2004) proposed the conceptual setting of the dune morphological development; the geomorphology of the coastal dunes is shaped by the action of wind, waves and currents upon sediments to produce a set of landforms that are causally related. To particularize it, in coastal areas of adequate sediment supply, Psuty’s coastal process-response conceptual model is applied on the beach profile: the accumulation of sand that extends from the offshore bar, through the dry beach, and into the adjacent coastal foredune. If the foredune is vegetated, its stabilisation is further enhanced and additionally it is actively affecting the foredune morphological shaping. This dune-beach profile is the basic sand-sharing system whose components respond to variations in energy level and to mobilization of sand from one portion to another. Each component episodically stores and releases sand in an exchange of sediment, i.e. in sediment budget terms, the beach is the source and the dunes represent the sink (Davidson-Arnott, 2010) (Figure 3.1).
6
availability of sand; (b) sufficient wind energy to transport the sand or rework it in situ and (c) suitable topographic and climatic conditions maintained over a long period, which allow accumulation of sand (Pye & Tsoar, 2009). On the other hand, coastal dunes are reformed with wave processes, changing wind patterns, sediment supply, and human impact. Their presence or absence, vegetation cover, volume and elevation, and even their precise positional changes are important (Bush & Young, 2009) for nature conservation (Pye & Neal, 1994), socio-economic and ecological system services (Everard et al., 2010).
Figure 3. 1:Exchange of sand within the sand-sharing system, the arrows represent the sediment exchange derived from wave (black arrows) and from wind processes (blue arrows) (modified from Psuty, 2004).
3.1.1 Incipient/ Embryo Dunes
Incipient or embryo dunes (also referred as white dunes) are new or developing dunes forming within pioneer plant communities reaching 1 to 2 m height (Hesp, 2002; Maun, 2009). They form by sand deposition within discrete or relatively discrete clumps of vegetation, individual plants, driftwood, flotsam, etc. (Hesp, 1989), forming shadow dunes, or low unconnected mounds or hummocks of sand (Maun, 2009). Incipient dunes develop in the seaward most vegetated sand surface ranging from the immediate backshore to backbarrier sand flats (Carter et al., 1991; Hesp, 1989). There, the organic matter brought by the waves accumulates and decomposes, creating a substrate rich in sea salts and organic matter decomposition (Prisco et al., 2012). Their morphological development principally depends on a) plant species, b) density and architecture, c) distribution, d) height and cover, e) wind velocity and f) rates of sand transport. As an example, Hesp (2002) reviewed that most vegetation canopies can vary alongshore in intensity or distribution either because of variations in the vigour of a particular dominant species, or because the distribution of species varies spatially. As a result, the morphology of the foredune varies alongshore accordingly. The greater the variations in density or distribution or in sand supply, the
7
greater the morphological variation (see Hesp, 2002). Secondary factors such as the rate of occurrence of storm wave erosion, overwash incidence and wind direction can also be important in determining subsequent dune evolution (Pye & Tsoar, 2009; Maun, 2009).
3.1.2. Foredunes
Foredunes (usually mentioned yellow dunes) are actively growing dunes, developing from incipient dunes (Figure 3.2) and are characterized by the growth of intermediate, often woody plant species. They are commonly attributed by greater morphological complexity, height and width, in contrast to the incipient dunes (Short, 1999). Usually they are defined as shore-parallel dune ridges formed on the top of the backshore (above the dry sand beach) by aeolian sand deposition within vegetation (Hesp, 2002; Duran & Moore, 2013) or any other material and obstacle (Feagin, et al., 2015). They can form on any shore, as beaches, estuaries, lakes or lagoons and in almost any climate from tropical to arctic (Hesp, 2002). The morphological development and evolution of established foredunes depends on a number of factors including: a) sand supply, b) the degree of vegetation cover, c) present plant species, d) the rate of aeolian sand accretion and erosion, d) the frequency and magnitude of wave and wind forces, e) the occurrence and magnitude of storm erosion, dune scarping, and overwash processes, f) the medium to long-term beach or barrier state (stable, accreting or eroding), g) sea/lake/estuary water level and increasingly, h) the extend of human impact and use (Sherman & Bauer, 1993; Hesp, 2002) and j) the morphodynamic state of the beach (dissipative, intermediate or reflective) (Short & Hesp, 1982). In a simple profile, the foredune exists at the boundary between the marine processes to its seaward part and continental
processes to its landward (Psuty, 2004). Foredunes constitute the most stable/conservative
component of the coastal profile that undergo temporal and dimensional variations of far less
magnitude compared to the beach (Psuty, 2004).
Figure 3.2: Illustration of the three geomorphological zones of the backshore. (adapted from
8 3.1.3 Hind dunes
The hind dunes are usually extended tertiary foredunes occupied by more complex and developed vegetation such as scrubs, also with trees and forests at several coastal dune ecosystems. They are protected from the strong winds and salt spray experienced closer to the beach enabling for less hardy and specialised trees to survive. The more complex species in this area result in more humus and organic matter produced, thus providing sufficient nutrients for diversity of species. Eventually plant communities are established in this zone that further contribute to nutrient enhancement of the area (Beachapedia, 2013).
In Figure 3.3 a setting of a typical coastal zone cross-profile is demonstrated, with the distinct vegetational zones: the incipient dune with primary zone species (grasses and creepers) colonize the lower parts of the beach and trap abrasive sand particles forming a “foundation”. The foredune constitutes an elevated “wall” that can be colonized by secondary zone species (mainly shrubs) to provide a wind deflecting “shutter” near the shoreline. Finally, on the hind dunes, tertiary species are established (usually taller shrubs and/or trees) forming a “roof” from their canopy. By this, wind is additionally lifted and increased shelter is provided to vegetation, ecosystem or settlement farther inland (NSW Department of Land and Water Conservation, 2001).
Figure 3.3: In a stable dune ecosystem the landform consists of an incipient dune, followed by the foredune and landward by a hind dune.
3.2. Beach-dune interaction
Erosion of coastal dunes can be induced by several natural factors, such as storm events, elevated water levels and high wave run-up (e.g. Hesp, 1988; Psuty, 1988; Sherman & Bauer, 1993; Aagard et al., 2007) causing wave scarping or overwash. Both cross-shore and longshore components cause coastal erosion and accretion. Dune and soft cliff erosion during extreme events mainly is a
9
cross-shore process bringing the sediments from the immobile dune front into the mobile littoral system (van Rijn, 2010). There are several studies that have demonstrated the importance of storm events and storm-related variables as agents in dunes shape (Davidson-Arnott et al., 2005; Hesp, et al., 2005; Bauer, et al., 2009; Mathew et al., 2010; Davidson-Arnott, et al., 2012). Incipient dunes and foredunes are directly affected by storms, since they occupy the immediate landward position relatively to the beach and thus are exposed to coastal winds as well as to storm surge and wave impacts (Brinks et al., 2013). Sallenger (2000) defined an impact scale that relates sea level and runup level to the dune morphology, whereas four impact regimes are defined: swash, collision, overwash and inundation (Figure 3.4). Nevertheless, beach erosion also is an alongshore process due to the presence of eroding longshore currents including tidal currents (van Rijn, 2010).
Figure 3.4: Sallenger's (2000) regimes and predictions of beach changes applied for barrier islands. (a) Swash regime: wave run-up confined to beach, temporary erosion, offshore sediment transport followed by non-storm return and no net change to the system. (b) Collision regime: wave up exceeds the elevation of the base of the dune, run-up collision causes erosion and occasionally net or (semi-) permanent dune retreat, depending on the sediment availability. (c) Overwash regime: wave run-up exceeds the dune elevation or beach berm, overtopping transports the sand landward to produce net profile change and eventually landward barrier migration. (d) Inundation regime: combined wave run-up and storm surge exceeds the elevation of low seaward dunes to inundate the entire beach; if the barrier is also narrow, the entire island may be inundated, which can result in net change and landward barrier migration landward. Rhigh is the maximum Runup elevation and Rlow is the effective still-water level during a storm,
Dhigh is the elevation of the dune crest and Dlow is the elevation of the dune toe. (Credit: (USGS) United States
10
Model studies and field observations have articulately shown that the presence of a high foredune reduces foreshore lowering and shoreline recession during a storm (in Pye & Tsoar, 2009; p: 336), which is especially important during storm surges. For those conditions, waves may begin to break close to, or even against (Pye & Tsoar, 2009) the dune line (Figure 3.5), making the seaward dune foot unstable and causing erosion or dune openings and allowing scarp formation and sediment loss from the dune. Nevertheless, among others, Wolman and Gerson (1978) argued, that a large catastrophic event may alter the landscape significantly, but the system may rebuild to the pre-event state under every-day processes that cause landscape change, provided positive sediment budget. Contrarily, even small landscape disturbances may persist for decades if there is weak capacity in the system to recover to the prior state. A general remark is that wave-induced dune erosion leads to beach accretion and bar development when the beach and surf zone slopes are relatively flat (dissipative conditions), but in case of a steep surf zone slope the dune and beach are eroded simultaneously and the sediments are carried away to deeper parts of the profile (van Rijn, 2010).
11
Figure 3.5: Schematic diagram showing the progressive effect of storm waves on a foredune/beach system. During the initial stages of wave attack, the average level of the foreshore is lowered and the berm is removed as sand is moved offshore (after CERC, 1977 in Pye & Tsoar, 2009).
Time and space relationships between the beach and the dune systems’ sediment budget, are the foundation for foredune development and geomorphological evolution across the beach-dune profile (Psuty & Silveira, 2010). Coastal dunes develop as accumulating systems with very positive sediment budgets, i.e. input far exceeds output. Thus, a negative budget leads to a dissected dune system by erosion landforms: blowouts, deflation hollows and plains, reactivation dunes and scarping (Carter, 1991).
3.3. Dune formation/development and vegetation role
During onshore winds, sand is eroded from the beach and moves towards the foredunes mainly by saltation. Wolfe and Nickling (1993) recognized that the increased vegetation cover near the dune foot reduces wind velocity, blocks incoming grains and reduces the erodibility of the surface below it, because it acts as a friction element and slows down the wind enabling deposition to occur. As
12
a result, saltation usually fades out within a short distance from the first vegetation, leading to sedimentation over a width determined by wind velocity and vegetation density (Hesp, 1983, 1988; Sarre, 1989; Arens, 1996; Arens et al., 2001). The turbulence induced by vegetation and the upward velocities caused by the dune slope may also initiate grains transport in suspension (Arens, 1996; Arens et al., 2002). These grains may travel farther up the dune as they pass over the vegetation canopy, leading to deposition farther up the slope and near the crest (Arens, 1996; Arens et al., 1995; Hesp, 2002; Petersen et al., 2011; Ollerhead et al., 2013) (Figure 3.6). In addition, Hesp et al. (2009) and Petersen et al. (2011) postulated ‘modified saltation’, whereas storm winds may bend the foliage into their streamlines, reducing roughness and creating a secondary surface for saltation, allowing sand grains to proceed considerable distances downwind. Arens (1996) regarded that saltating grains will only reach the foredune if the surface is scarcely vegetated. However, field measurements on foredunes in monthly to yearly periods have shown transport and sand deposition (of large quantities) up the seaward slope of foredunes and over the crest onto the lee slope and beyond, even when vegetated by pioneer grasses (Arens et al., 2001; Kuriyama et al., 2005). Hence, airflow over a foredune is modified by both topography and vegetation (Keijsers et al., 2015). In general, a vegetated foredune induces flow deceleration upwind of the dune slope (Sarre, 1989; Wal & McManus, 1993; Arens, 1996; Davidson-Arnott & Law, 1996; Hesp, 1989 and 2002) and during onshore winds, wind is topographically accelerated due to flow compression over the seaward slope (Arens et al., 1995; Arens, 1996; Walker, et al., 2009). At the same time, vegetation roughness slows down the airflow, counteracting the topographic acceleration. In such events, it has been recorded that there was a marked speed up above the vegetation, which at times produced sediment entrainment within the canopy (Finnigan & Belcher, 2004).
Keijsers et al. (2015) reviewed that plant growth on the foredune is consecutively stimulated where an adequate amount of sand is deposited, while vegetation declines where tolerance limits are exceeded in either sedimentation or erosion. Hence, the pattern of sedimentation may define where vegetation thrives and where it subsides. Furthermore, variations in the tolerance to burial and exposure between species may contribute to the spatial distribution of plant species (Levin et al., 2008; Maun, 2009). Van Dijk et al. (1999) suggest in their modelling a correlation between plant and dune height, namely as plant height increases, dune height increases and dune length decreases, which was verified by field observations of Hesp (1989).Notwithstanding, as Bush and Young (2009) acknowledged, vegetation cover is a good indication of the relative stability of
13
coastal landforms. In general, the taller and thicker the vegetative growth, the more stable the site and the coastal geomorphic features.
Figure 3.6: Scheme of sand transport by aeolian mechanisms over foredunes, for bare and vegetated foredunes, with different combinations of wind speed (high-low). + : potential deposition, - : erosion; Ø : no transport (Arens, 1996).
Vegetation in the dune area catches windblown sand and binds it to the dune. Without plants to trap the sand, the sand is blown away and the dune erodes or migrates. Plants in this zone are extremely enduring with special adaptations that allow survival. They provide vital protection for fauna that live in this zone, and for other flora further back in the dunes. The dune crest is also anchored by vegetation, which plays a secondary role as a passive roughness element, when interacting with wind flow, and thus preventing dune motion (Duran & Moore, 2013). Sand-fixing plants (e.g. Atriplex sp.) are responsible for stabilizing surfaces and sand-building plants (e.g.
Ammophila sp. and Elymus sp.) are involved in accumulating sand (Carter, 1991). In conditions of
dynamic equilibrium (erosion equals accretion)1 (Feagin et al. 2005) the vegetation is mostly determined by environmental factors, as sea dynamics, sea proximity and sands mobility, which is expressed in specific plant associations, coverage and species compositions (Kim & Yu 2009). Contrarily, when beach faces severe erosive sea processes, very often the beach sediments and the foredune advance inland (Psuty & Silveira, 2010), overlapping the relatively stabilized dunes, in
1 Such gradients are created as a result of spatial shift in elevation, climate, soil and many other environmental factors
14
such situations their vegetation can mingle and coexist for a period of time. For the Portuguese coasts, it is acknowledged that native psammophilic flora and vegetation plays an essential role in the resilience and vitality of coastal social-ecological services (Feagin et al., 2010; Martins et al., 2013), for instance biodiversity maintenance (Til & Koojman 2007; Howe et al. 2009), sand fixation and dune construction.
3.4. Shear velocity and threshold of sand movement
As with all fluid flow, wind blowing across a surface is affected by friction with the bed, which leads to the generation of a boundary layer, in which flow speed is retarded by contact with the land surface and obstacles on it. Wind flow is affected by the topography of the bed over which it passes (Pye & Tsoar, 2009). Then the movement of sand by wind is caused by the transmission of impulse of the wind to the sand grains. Impulse (I) is the momentum,
I = m * U (1)
with mass (m) and velocity (U) over time. The change of impulse results into a force per unit area parallel to the flow called shear stress (τ)
'∗) = * + (2),
where U*t is the shear threshold velocity and ρ atmospheric density, that can be translated to “shear velocity”, u* (Hsu, 1971)) (see Equation 5, p. 37)
When the shear velocity over a loose sand surface is slowly increased, a critical point is reached where some grains begin to move. This critical wind velocity, necessary to induce sand movement, is known as the fluid threshold velocity u*th (Bagnold, 1941) or shear threshold velocity. This initiation of grain movement is explained by several theories, attributed to rolling (Bagnold, 1941; Malina, 1941; Chepil, 1959) or vibration of the particle before its “ejection” (Bisal & Nielsen, 1962; Lyles & Krauss, 1971) The initiation of grain motion is defined by the forces exerted on individual grains: a lift force, vertically upwards, constraining the horizontal movement by the adjacent grains and horizontally by a drag force acting in the direction of the flow (Figure 3.7 and 3.8) (Csahók et al., 2000).
15
Figure 3.7: Variation of the fluid threshold velocity and the impact threshold velocity with grain size. The distinctions between the saltation and suspension modes of transport, and between erosion, transportation and deposition are also shown. (Data partly from Bagnold (1941) and Chepil (1945b) in Pye & Tsoar, 2009).
Arens (1996) concluded that the landward decrease in flux is shown to depend on wind strength: low wind speeds result in a sharp decrease, high wind speeds in a gentler decrease; during high wind speeds the sand is transported over a longer distance from the dune foot than during low wind speeds. The landward decrease in transport is not linear. An initially strong decrease, between dune foot and crest is thought to be related to the saltation process. In respect to suspended grains, between crest and back of the foredune, their content in the air decreases at a much slower rate, depending on the settling velocity of the grains. The transport of fine and medium grained sand in suspension appears to be a common process, operating when wind speeds exceed a certain critical level.
It is presently recognized that micro-scale changes in topography and vegetation cover presented to winds blowing onshore across the beach and foredune produce large departures in the velocity profile from the ideal log-linear form (Bauer et al., 1996; Walker and Nickling, 2003; Hesp et al., 2009; Weaver and Wiggs, 2011), making it impossible to make an accurate determination of u*.
16 3.5. Sediment Transport
Foredune evolution is controlled by the local aeolian sediment transport regime, which is defined by the interaction of several factors including beach type, surface moisture content, wind regime, sand supply, sediment texture and density and spatial distribution of vegetation (Psuty, 1988; Hesp, 2002).
3.5.1. Aeolian transport modes
Sediment transport occurs by different modes defined by wind velocity and grain size. The layer of grains that move very close to the bottom is known as boundary layer. The bed load transportation within this boundary layer may be through saltation, in which grains move forward by a series of jumps, and surface traction, in which grains roll or slide along the surface, due either to direct fluid drag or the impact of saltating grains (Nichols, 2009, Pye & Tsoar, 2009).
Usually sand on the beach is transported in saltation (Arens, 1996). In "pure" saltation (Jensen & Sorensen, 1983), the grain trajectories are determined by the average wind profile, whereas in "modified" saltation (Nalpanis, 1985), the trajectories are modified by the turbulent characteristics of the wind. However, most of the upward momentum of the grains is received from frequent impacts with the sand bed.
Another major transport mode is suspension, the movement of usually smaller grains, lifted from the surface by a vertical gust, and transported over longer distances without any interaction with the sand bed (Arens, 1996; Pye & Tsoar, 2009). Turbulent airflow is able to keep a grain in suspension when the vertical fluctuating velocity component of the flow exceeds the settling velocity of the grain (wf) (Pye & Tsoar, 2009). So, movement of particles by the wind takes place by a combination of direct wind shear stress and atmospheric turbulence (Lancaster, 2009).
3.5.2. Sediment transport factors
As described by Pye and Tsoar (2009), the flow dynamics of sand movement can be explained considering wind flowing over a resting sand grain on a horizontal surface exerting two types of force on the grain: (a) a drag force acting horizontally in the direction of the flow, and (b) a lift force acting vertically upwards (Figure 3.8). Opposing these aerodynamic forces are inertial forces. grain's weight is defining isolated grains motion, whereas cohesion and friction are the most important for packed humid grains that act directly against the lift force. Then, the behaviour of a grain when acted on by a fluid is often more closely controlled by its mass, rather than by its
17
external dimensions. Mass represents a measure of the inertia of a body, i.e. the resistance that the body offers to a change to its velocity or position changed by the application of a force (Pye & Tsoar, 2009). Furthermore, the friction between the sand grains is also a transport impeding factor, as the densities of particles differ considerably depending on grain compaction or dilation, the fluid between the voids (water or air) and their elemental composition, size and heterogeneity (Pye & Tsoar, 2009; Stark et al., 2014).
Figure 3.8: Schematic diagram illustrating the drag force (FD), lift force (FL) and gravitational force (FG) exerted on
a static grain by wind flow, as the arrows indicate. On the upper left are the wind profile and the streamlines ensuing from it. The grain starts to role when the drag and lift force exceed the gravitational force.
Cohesive forces are significant for soft beaches (grains smaller than 0.1 mm), thus particular factors as moisture derived from precipitation and waves or tides hamper sand transfer. After wetting, moisture is retained by sand as a surface film, especially at points of grain contact resulting in tensile force between the water molecules and the sand grains (Chepil, 1956; Bisal & Hsieh 1966). Adding to the aforementioned the unsteady and non-uniform nature of coastal wind regime (Bauer et al., 1998; Davidson-Arnott et al., 2005) researchers have found poor agreement between measured and predicted sand flux on beaches (e.g. Svasek & Terwindt, 1974; Bauer et al., 1996; Davidson-Arnott & Law, 1996; Jackson and Nordstrom, 1998; Sherman et al., 1998).
Beach width and fetch are also worth mentioning components of sand transfer. At narrow beaches with onshore winds, the total sediment transport rate across the dune line will be less than that predicted for a wide beach because of the constraint imposed by the fetch distance (Navarro et al, 2015). By fetch is referred the downwind distance from the leading edge of the transport to any general point of interest on the beach (Bauer et al., 2009), is an additional varying factor of
18
sediment flux. It has been proven, by several simulations of flow over foredunes in computational fluid dynamics (CFD) modelling, that the critical fetch distance2 (Fc) exerts an important controlling effect on the amount of sand supply to the foredune. However, the proportion of the sediment delivered to the dune relative to the amount eroded from the beach is influenced dominantly by the angle of wind approach, and not by the fetch distance. So, when the angle of wind approach becomes more oblique, the downwind portion of the beach closest to the dunes, experiences enhanced sand transport rates. Yet, the total amount of sediment supplied to the foredune is decreased relative to that during cross-shore transport, as most of the sand is lost to the downwind margin of the beach (Walker et al., 2017).
4. Study Area
4.1. Geographical and geomorphological setting
The study area lies within Ancão Peninsula, being part of the Ria Formosa coastal lagoon system, which is located in the Algarve region in south-western Iberian Peninsula (Figure 4.1). Ria Formosa consists of a coastal lagoon bordered by five barrier islands and two peninsulas, Ancão Peninsula being the western and Cacela Peninsula the eastern boundary of the system. The lagoon connects to the sea by six tidal inlets (Figure 1.1): two relocated inlets (Ancão and Fuseta inlets), two artificially opened and stabilized inlets (Faro-Olhão and Tavira inlets) and two natural inlets (Armona and Lacém inlets) (Ferreira et al., 2016). The backbarrier is characterized by large salt marshes, sand flats and a complex network of natural and partially dredged channels, covering 8.4x10⁷ m2 (Andrade, 1990). Ria Formosa has a distinct triangular shape extended for 55 km, possibly related to the existence of a shallow shelf bounded by a relatively steep slope on the inner continental shelf (Dias & Gonzalez, 2000).
Ancão Peninsula (Figure 4.1) has a variable length of 8.5 to 12.8 km (approx.) and width of 50 to 200 m (Ferreira et al., 2016) and is positioned in a NW-SE direction. Its variable length is attributed to considerable morphological changes that the peninsula has undergone due to shoreline retreat, inlet migration and relocations and beach nourishment. Thus, its natural length has varied, as it was dependent on the Ancão Inlet position and migration. In a recent morphological analysis of
2 F
c is the critical fetch distance related to the maximum sediment transport delivered by aeolian processes, as described
19
Achab et al. (2014) the profile was characterised as steep with a beach face slope of tan β≈0.14 (a less steep slope of 0.11 in average was stated by Ferreira et al. (1997)). During storm events, the erosion affects mainly the beachface and backshore, and the beachface slope decreases to tan β≈0.07 (Achab, 2014). Nevertheless, Vousdoukas et al. (2012) asserted that in general the profiles recover from erosion in a few days.
Figure 4.1: Close up view (upper panel) of the study area of Ancão Peninsula, including the two parts of interest (sectors A: western and B: eastern) at the lower panels (map: www.bing.com/maps).
An additional factor to be remarked affecting Ancão Peninsula is coastal erosion, which was amplified after 1970s due to updrift construction of the Vilamoura jetties, riprap seawalls and
20
extensive groin field in front of Quarteira (Figure 1.1) (Dias & Neal, 1992; Ferreira et al., 2016). Thereafter the sand supply was downdrift reduced. The remarked erosive trend was responsible for shoreline retreat rates reaching in some locations values of 1 to 2 m/yr in the last 50 years (Pilkey et al., 1989; Bettencourt, 1994). The littoral drift southeast of Quarteira was impacted causing coastal recession and property damage, thus several beach nourishments have been carried out from local and national authorities in Vale do Lobo (8 km west of Ancão; Figure 1.1) to mitigate coastal erosion, namely in 1999, 2006 and lastly in 2010 (Ferreira & Matias, 2013). Beach and dune nourishment took place also along the Ria Formosa barrier islands for dune preservation and recovery purposes (April 1999-July 2000) (Ramos & Dias, 2000; Ferreira & Matias, 2013). Aeolian transport processes promote dune construction and regularly causing the burial of roads and house yards, whereas overwash has promoted property damage and barrier breaching (Almeida et al., 2012; Achab et al., 2014, Ferreira et al., 2016; Popesso et al., 2016). Foredune erosion has caused the destruction of houses, dwells and roads located at the shorefront. In order to diminish the vulnerability of the frontal dune ridge to coastal erosion, overwash and breaching, the Park Authority has put into practice management plans that include beach and dune nourishment which proved to be successful with respect to the proposed objectives (Dias et al., 2003). Ancão Peninsula can be divided in three sectors, west, central and east, in reference to the location of Praia de Faro (as the human occupied part is locally referred) in the central part. The study area focuses on two sites of interest, located within the western and the eastern part of Ancão Peninsula and extend approximately 2.6 km, namely 1.4 km at the eastern sector and 1.2 km at the western sector (Figure 4.1). The sites demonstrate high morphological diversity; the western part is characterised by stable foredunes and dune bluffs (Dias, 1988). More specifically, as descriptively portrayed in Ferreira et al. (2006), in the western sector (Figure 4.2), the peninsula presents principally a continuous ridge, which is mostly unoccupied except for a few bars and restaurants near the attachment to the mainland. An erosion scarp was defining the transition from the dune to the beach, as beach profiles of 2000 and 2001 showed, signifying shoreline retreat processes (Achab et al., 2014). Nevertheless, the beach and dune nourishment of 1999-2000 (Ramos & Dias, 2000) supported the recovery of the profile and the respective scarp is not existent anymore. In this segment, there is a large breach in the dune ridge that corresponds to the location of a relict ephemeral tidal inlet opened during the first half of the 20th century. Nowadays, the surface of this breach is completely vegetated and not overwashed. At Praia de Faro section
21
(central), the dune has been lowered or even destroyed and the human occupation is dominant. For that reason, overwashes are more frequent in this sector, resulting to severe consequences (Pilkey et al., 1989; Ferreira et al., 2006; Garcia et al., 2010; Rodriguez et al., 2012).
Figure 4.2: Perspective of the western side of the peninsula. The early vegetation zone is quite narrow and well defined and the ridge is distinct and continuous with some evidence of ancient dune scarping.
The central part includes also the Praia de Faro settlement, which is the only location accessible by car among the Ria Formosa barriers. Along the 3-km-long extent of this coastal segment the dune ridge has been almost completely destroyed by the construction of residential, tourist and recreational infrastructures. To prevent property damage, some parts of the oceanfront of this developed site have been artificially stabilised with revetments. These structures have inhibited further shoreline retreat, but are frequently overwashed (Ferreira, 2011) when high-energy stormy waves coincide with spring high tides (Dissanayake et al., 2015).
The eastern sector consists of lower and wider foredunes and accretion is indicated by a wide vegetated backshore (Ferreira et al., 2016). To the east of Praia de Faro (Figure 4.3), the peninsula has a low-density population consisting mainly of fishermen, most of whom reside at the lagoon margin. The eastern sandy spit next to Ancão Inlet, is the only area along the eastern sector of the
22
peninsula that is periodically overwashed due to its low-lying topography.
Figure 4.3: Dune setting in the east sector at a stable dune position. The subtle undulations are evident. Praia de Faro settlement (central sector) is visible at the top-right corner of the picture.
The beach of Ancão Peninsula was classified as Low Tide Terrace Beach (Martins et al., 1997; Vila et al., 1999) and is often reflective during high tide and intermediate during low tide (Ferreira, 2011). It has also presented a variable shoreline evolution with retreat at the western part (-0.8 m/yr), almost no variation at the central part and small accretion (+0.4 m/yr) at the eastern end (Ferreira et al., 2006). Sediments until 5-m depth are very homogenous, consisting of 80-90% of quartz along the barrier island system (Achab et al., 2014). Sediments from sampling along the peninsula were impacted by period (pre/after storm conditions) and profile (location) as grain size analysis as indicated by Achab et al. (2014). The results showed for Ancão Peninsula a mean grain size varying from 590 µm to 790 µm, while the modal class ranged from medium to very coarse sand. However, excluding the presence of coarse sediments, attributed to replenishment operations, the sampling at “natural” profiles, revealed a mean grain size of 560 µm to 650 µm (Achab et al., 2014).
4.2. Oceanographic setting
23
and neap tides respectively, reaching a maximum of 3.5 m in spring tides. The dominant incident wave direction is W-SW (71% of the year), however E-SE directions, corresponding to waves generated by local winds, occur during 27% of the year (Costa et al., 2001). Mean annual significant offshore wave height (Hs) is 1.0 m and the mean peak period is 8.2 s. The most significant storms (offshore Hs> 3m) that affect the Ancão Peninsula are events from W-SW (Costa et al., 2001). Net longshore drift, which is considered the main sand supplier for this coastal system, is eastward directed, being nourished by updrift cliff erosion (Dias & Neal, 1992, Vila-Concejo et al., 2003), that is mostly taking place westwards in the western zone of Olhos de Água-Vilamoura. Estimates of longshore sediment transport feeding Ancão Peninsula vary according to authors (Vila-Concejo et al., 2003) ranging from 6x10³ to 3x10⁵ m/yr (Achab et al., 2014; Popesso et al., 2016).
4.3. Ancão Inlet
Ancão Inlet is a small migrating inlet that has an average width of 300 m (Vila et al., 1999) with dynamic evolution in its morphology and position (Andrade, 1990; Vila-Concejo et al., 2002). The inlet undergoes a cyclic eastward migration (Weinholtz, 1964; 1968 and Esaguy, 1986 in Vila et al., 1999; Dias 1988; Pilkey et al., 1989; Popesso et al., 2016) until a limiting location where the infilling processes begin, and eventually force the shift to its earlier position or at the western part of the peninsula where a new inlet opens (Weinholtz, 1964; 1968 in Vila et al. 1999). Vila-Concejo et al. (2002) analysed the historical development of the Ancão Peninsula inlet from 1947 until 1996 and found that Ancão Inlet underwent two eastward migration cycles during this period. The eastward migration trends were very similar for both cycles, with the inlet showing an initial stage of readjustment (characterised by low migration rates), followed by a stage of high eastward migration rates, until reaching a limiting position; while migrating, Ancão Inlet maintains a stable cross-sectional area. This was distinguished as a high-energy migration pattern by Vila-Concejo et al. (2002; 2004). Due to coastal management measurements, the inlet was relocated 3.5 km westwards in June of 1997, to improve water exchange at the western part of Ria Formosa lagoon system (Dias et al., 2003; Ferreira, 2011). Since then the inlet has been migrating 80 m/yr to the East (Pacheco et al., 2007). In the winter of 2009/2010 the inlet experienced a migration jump3 of about 300 m eastwards and until 2010 it was displaced more than 1 km to the east from its