THE MODERATING EFFECT OF GROWTH NEED STRENGTH
A Case Study of Directorate General of Customs and Excise
in Indonesia
Nanang Suko Sadono
Project submitted as partial requirement for the conferral of Master of Science in Business Administration
Supervisor:
Prof. Shaozhuang Ma
ISCTE - Instituto Universitário de Lisboa
Spine
-Jo b C ha ra ct er is ti cs a nd A ff ec ti ve C om m it m en t: T he M od er at in g E ff ec t o f G ro w th N ee d S tr enN
an
an
g
Su
k
o
S
ad
on
o
Acknowledgements
Working on this project has been an incredible experience for me. I would like to express my gratitude to all of those who continuously supported me during this research. Without them, this would not have been possible.
My special thanks to my supervisor, Professor Ma, for the availability and concern demonstrated, for enriching this research and for providing me with the research autonomy that made me grow intellectually.
My loves and thanks to my parents, two elder sisters, and younger brother for supporting and encouraging me with their best wishes.
I would also like to thank my friends in Universitas Gadjah Mada and ISCTE for great experience in the last two years. I wish all of us the biggest slice of happiness and good luck in the future.
Finally, hugs and kisses for my lovely wife Aan and my beautiful little princess Hasna. I love you both.
Abstract
This study aims to comprehend the moderation effect of growth need strength in the relationship between job characteristics (skill variety, task identity, task significance, autonomy, and feedback) and employees’ affective commitment in the Indonesian Directorate General of Customs and Excise (DGCE), an agency under Ministry of Finance of Indonesia.
The findings indicate that growth need strength moderates the relationship of aggregated job characteristics, skill variety, task significance, and feedback with affective commitment. Autonomy is not significantly moderated by growth need strength. Instead, autonomy has direct positive effect on affective commitment. The remaining variable, task identity, does not have significant effect on affective commitment, either direct effect or indirect effect through its interaction with growth need strength. Management implications of the findings, limitations, and suggestions for future research are discussed in the end of the study.
Keywords: Job characteristics, growth need strength, affective commitment, moderation, public sector.
Thesis’ classification according to the categories defined by the Journal of Economics Literature (JEL Classification Systems): Labor Management (M54); Dissertations (Y40).
Resumo
Este estudo visa compreender o efeito de moderação do crescimento necessidade força na relação entre as características de trabalho (variedade de skills, identidade da tarefa, importância das tarefas, autonomia e feedback) e o empenho afetivo dos trabalhadores na Direcção-Geral das Alfândegas e Impostos Indonésia (DGCE), uma agência subordinada ao Ministério das Finanças da Indonésia.
Os resultados indicam que o crescimento necessidade força modera a relação das características agregadas do emprego, variedade de skills, identidade da tarefa, importância das tarefas, autonomia e feedback com o empenho afetivo. A autonomia não é significativamente moderada pelo crescimento necessidade força. Em vez disso, a autonomia tem efeitos diretos positivos sobre o empenho afetivo. A variável remanescente, identidade da tarefa, não tem efeito significativo sobre o empenho afetivo, ou efeito direto ou indireto através da sua interação com crescimento necessidade força. Implicações na gestão das conclusões, limitações e sugestões para futuras pesquisas são discutidas no final do estudo.
Palavras-chave: Características do trabalho, crescimento necessidade força, empenho afetivo, moderação, o setor público.
Classificação da tese de acordo com as categorias definidas pelo Journal of Economics Literature (JEL Classification Systems): Labor Management (M54); Dissertations (Y40).
Abstrak
Penelitian ini bertujuan untuk memahami efek moderasi dari growth neeed strength dalam hubungan antara karakteristik pekerjaan (variasi keahlian, identitas pekerjaan, signifikansi pekerjaan, otonomi, dan umpan balik) dengan komitmen afektif dari pegawai Direktorat Jenderal Bea dan Cukai (DJBC), sebuah institusi yang berada di bawah Kementerian Keuangan Republik Indonesia.
Hasil analisis menunjukkan bahwa growth need strength memoderasi hubungan antara karakteristik pekerjaan secara agregat, variasi keahlian, signifikansi pekerjaan, serta umpan balik dengan komitment afektif. Otonomi tidak dimoderasi growth need strength, tetapi justru mempunyai pengaruh langsung terhadap komitmen afektif. Selanjutnya, identitas pekerjaan tidak mempunyai pengaruh terhadap komitmen afektif, baik lansung ataupun tidak langsung melalui interaksi dengan growth need strength. Implikasi manajemen dari hasil analisis, keterbatasan, dan saran untuk penelitian selanjutnya dibahas pada bagian akhir dari penelitian ini.
Kata kunci: Karakteristik pekerjaan, growth need strength, komitment afektif, moderasi, sector publik.
Klasifikasi tesis berdasarkan kategori yang ditetapkan dalam Journal of Economics Literature (JEL Classification Systems): Labor Management (M54); Dissertations (Y40).
Table of Contents
Acknowledgements...i Abstract...ii Table of Contents...v List of Tables...vi List of Figures...vii 1. Introduction...1 1.1. Background...1 1.2. Structure...2 2. Literature Review...32.1. Job Characteristics Theory...3
2.2. Organizational Commitment...6
2.3. Relationship between Job Characteristics and Affective Commitment...7
3. Research Method...11
3.1. Sampling and Procedure...11
3.2. Measures...11
3.3. Statistical Analysis...12
4. Results...13
4.1. Participants...13
4.2. Factor Analysis and Internal Consistency...13
4.3. Correlation Analysis between Variables...17
4.4. Mean Comparison between Demographic Variables...17
4.5. Hypothesis Testing...18
5. Discussion and Conclusion...25
5.1. Discussion...25
5.2. Conclusion...27
6. Limitations and Future Directions...29
Bibliography...30
Appendix 1. Job Diagnostic Survey...35
List of Tables
Table 2.1. Comparison between JDS, JSI, and JCI ……….. 3
Table 4.1. Model fit criteria………..
……….
13
Table 4.2. Rotated Component Matrix – Job Characteristics ……….. 14 Table 4.3. Rotated Component Matrix – Affective Commitment………. 15 Table 4.4. Descriptive Statistics and Correlations between Variables……….. 16 Table 4.5. Hierarchical Linear Regression (Aggregated Job Characteristics)
…………..
18
Table 4.6. Hierarchical Linear Regression (Skill Variety) ………... 20 Table 4.7. Hierarchical Linear Regression (Task Identity) ……….. 21 Table 4.8. Hierarchical Linear Regression (Task Significance)
………
22
Table 4.9. Hierarchical Linear Regression (Autonomy)
………
23
List of Figures
Figure2.1.
Job Characteristics Model by Hackman & Oldham (1974) ……… 5
Figure 2.2.
Interaction between Job Characteristics and Growth Need Strength ………. 8
Figure 2.3.
Research Model ……….. 9
Figure 4.1.
The Effect of Aggregated Job Characteristics on Affective Commitment …. 19
Figure 4.2.
The Effect of Skill Variety on Affective Commitment ……….. 20
Figure 4.3.
The Effect of Task Significance on Affective Commitment ……….. 22
Figure 4.4.
1. Introduction
1.1. Background
Directorate General of Customs and Excise (DGCE) is an Agency (first echelon) under Ministry of Finance of Indonesia. DGCE has four essential tasks (Indonesian Law No.10, 1995) which are:
1) protects the community from the import of dangerous goods;
2) protects particular domestic industries from unfair competition with similar foreign industries;
3) carries out law enforcement related with restriction and prohibition regulation; 4) collects import duty and taxes for state revenue.
All of those duties are becoming more critical due to the rapid development of international trade, such as the establishment of ASEAN1 Economic Community (AEC) in December 2015. In general, AEC promotes a highly integrated economy with free flow of goods, services, and capital, which are implemented gradually until 2025 (ASEAN, 2015). To deal with this challenge, effective and efficient systems/procedures together with professional human resources play an important role. Commitment of all employees is also important since committed employees tend to be proud and have strong bonds with the goals or values of the organization that might encourage them to demonstrate their best performance and productivity (Mowday et al. in Steinhaus & Perry, 1996; Lee, 2010).
Among three types of commitment (affective, continuance, and normative) that were introduced by Allen & Meyer (1991), affective commitment is considered to have the strongest relationship with desirable organizational outcomes. The reason of that is affectively committed employees are seen as having a sense of belonging that increases their involvement in organization and also their willingness as well as efforts to pursue the goals of the organization (Allen & Meyer, 1991; Mowday et al. in Rhoades et al., 2001). Therefore, any organizations, including public institutions, should foster this commitment among their employees.
1 ASEAN (Association of Southeast Asian Nations) is an organization of countries in Southeast Asia set up to
promote economic growth, political stability, and cultural development in the region (www.asean.org).
To increase employees’ affective commitment, management should first understand what factors that influence the level of affective commitment of its employees. Allen & Meyer (1991) suggested that there are three important antecedents of affective commitment, which are personal characteristics, job characteristics & work experience, and organizational culture. In terms of job characteristics, its effectiveness in influencing affective commitment of an employee might be different from one to another. For instance, Zargar et al. (2014) suggested that the effects of job characteristics depend on “growth need strength” of each individual.
Unfortunately, study regarding job characteristics and their effects on affective commitment is rarely conducted in Indonesia, especially in public sector such as DGCE. In practical side, reviewing job characteristics is also infrequently implemented in DGCE. When performance is categorized as poor, the focus of investigation of that poor performance would be the employees, not the job itself. Similar to job characteristics, assessing affective commitment of the employees is rarely conducted in this institution. Moreover, employees are rotated mainly based on their hard skills, educational background, or experience. Emphasis on employees’ personality in job rotation is not a common practice in the organization.
In this study, therefore, we want to examine the relationship between job characteristics and affective commitment of the employees in DGCE. The impacts of job characteristics on affective commitment might depend on the personal value of each employee such as growth need strength (Zargar et al., 2014). Thus, the present study aims to answer the following questions: to what extend individuals’ difference in growth needs influences the relationship between job characteristics and employees’ affective commitment in DGCE? Furthermore, how can DGCE improve its performance by understanding the interactions between them?
1.2. Structure
Following this chapter, we will first review the existing literatures regarding job characteristics, affective commitment, and the relationship between them to develop theoretical framework of the present study. In the third chapter, we will explain the methodology used in this research. In more details, we will describe sampling, procedure, and analysis strategy used in this study. Finally, we will present the results of our research,
discuss their management implications, report limitations of the study and provide suggestions for future research.
2. Literature Review
In this chapter, previous studies regarding job characteristics theory and organizational commitment are discussed. In addition, some researches examining the relationship between them are presented to develop a theoretical framework of this study.
2.1. Job Characteristics Theory
Hackman & Oldham (1976) defined job characteristics as a set of environmental variables that are considered to be important causes of employees’ affection and behavior. These variables include activities required in carrying out the work, completion of identifiable piece of work, substantial impacts of the job, independence in doing the job, and also information about the performance. There have been many studies discussing job characteristics and its importance in workplace (Johari et al., 2011).
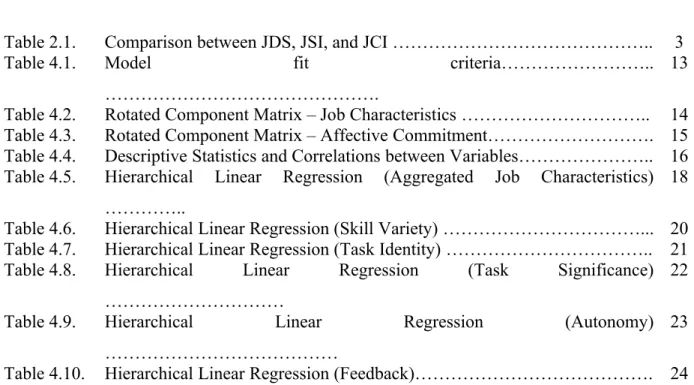
Based on the literature, there are several influential measurement approaches of job characteristics, including job diagnostic survey by Hackman & Oldham (1974), job scope instrument by Stone (1974), and job characteristics inventory by Sims et al. (1976). A brief comparison of these three measurement approaches is presented in table 2.1.
Table 2.1. Comparison between Job Diagnostic Survey (JDS), Job Scope Instrument (JSI), and Job Characteristics Inventory (JCI)
Criteria JDS
(Hackman & Oldham, 1974)
JSI (Stone, 1974)
JCI
(Sims et al., 1976) Similarity - Measure some core characteristics of a job that influence work-related
attitudes (satisfaction, commitment, internal motivation, performance) - Base on employees’ subjective perceptions towards their job
Difference Component: skill variety, task identity, task
significance, autonomy, feedback Component: variety, task identity, autonomy, feedback, interaction Component: variety, task identity, autonomy, feedback, dealing with others, friendship
opportunities Feedback is only from the
job itself
Feedback is from the job itself and from others (supervisor and colleagues)
Feedback is from the job itself and from others (supervisor and colleagues)
Criteria JDS
(Hackman & Oldham, 1974)
JSI (Stone, 1974)
JCI
(Sims et al., 1976) others) might influence
employees’ reactions to their jobs, but it is not included in core characteristics of a job
in core characteristics of a job with others) is included in core characteristics of a job
Source: Hackman & Oldham (1974); Stone (1974; 1976); Sims et al. (1976); Aldag et al. (1981); Johari et al. (2011); Ozturk et al. (2014).
In the present study, job diagnostic survey by Hackman & Oldham (1974) will be used to measure job characteristics in DGCE for, at least, three argumentations. First, job diagnostic survey by Hackman & Oldham is the only one that includes the measure of task significance that has been reported to substantially influence work outcomes (Grant, 2008). Measuring task significance in this study is also important since DGCE as a government institution has to deal with public interest. For example, DGCE is the agency in Indonesia that has the authority to regulate both export and import, which are crucial for economic activities. The institution has also an important role in national development through its function as revenue collector.
Second, there is a difference in defining feedback as one dimension of job characteristics. Unlike Stone (1974) and Sims et al. (1976) who defined feedback as both evaluation from others (e.g. supervisors or customers) and feedback from the job itself, Hackman & Oldham (1974) delineated it as the information that employees gather from the job itself about their effectiveness or performance. Regarding this difference, Johari et al. (2011) suggested that the latter mentioned is more closely related to the concept of job characteristics.
Last, in the recent decades, Hackman & Oldham’s job characteristics model (1974) remained a theoretical focal point in the field of job characteristics theory with considerable empirical scrutiny. For example, De Varo et al. (2007) examined the empirical relevance of Hackman & Oldham job characteristics model using the sample size of 2,191 workplaces with at least ten workers in each workplace. The results generally supported the use of the model in modern organizational environment (De Varo et al., 2007). A study by Vorster et al. (2005) also suggested that job diagnostic survey in Hackman & Oldham model could be applied to different population groups with highly dissimilar backgrounds.
The present study therefore focuses on Hackman & Oldham model (figure 2.1) in measuring job characteristics. As described in the figure, Hackman & Oldham proposed five “core” characteristics of a job: skill variety, task identity, task significance, autonomy, and feedback. Those five characteristics then would create three critical psychological states (meaningfulness of the work, responsibility for work outcomes, and knowledge of results), which further affect personal and work outcomes. Hackman & Oldham (1974) suggested that job characteristics are not expected to have equal impacts for all individuals. For this reason, they introduced “growth need strength” as a moderator in the relationships specified by the model. Growth need strength can be defined as the need of an individual in accomplishing things in the work context (Zargar et al., 2014). Employees who possess high growth need strength are considered to have high standards of excellence, and desire to complete challenging tasks in order to maintain or even surpass those standards. Here, skill variety, task identity, task significance, autonomy, and feedback raise job challenge and provide activity achievement incentive for those employees with high growth needs (Zargar et al., 2014).
Figure 2.1. Job Characteristics Model by Hackman & Oldham (1974)
Source: Hackman, J. Richard and Greg R. Oldham. 1974. The job diagnostic survey: An
instrument for the diagnosis of jobs and the evaluation of job redesign projects. New Haven:
2.2. Organizational Commitment
Organizational commitment is a psychological state that characterizes the employee’s relationship with the organization, and has implications for the decision to continue or discontinue membership in the organization (Allen & Meyer, 1991). Three components model of organizational commitment were introduced by Allen & Meyer (1991), consisting of affective commitment, continuous commitment, and normative commitment. Affective commitment relates to the employee’s emotional attachment to, identification with, and involvement in the organization. In the simple terms, employees are working and continue working in an organization because they want to do so. Continuance commitment is about the awareness of the costs if an employee decides to leave the organization. Not because want to do so, employees that base their relationship with the organization on continuance commitment decide to stay in the organization because the need to do so. The last component, normative commitment describes a feeling of obligation to continue employment. Employees that hold this commitment feel that they ought to stay in the organization (Allen & Meyer, 1991).
In response to the attention on cultural differences, Fischer & Mansell (2009) conducted meta-analysis, examining the effects of individualism-collectivism and power distance across 48 countries. Utilizing the three component model of Allen & Meyer (1991), their study found relatively small yet consistent culture-level effects. In countries with more individualistic settings, affective commitment is higher compared to collectivist countries. Next, continuance commitment is stronger as power distance increases, which mainly due to social pressures and costs related with leaving an organization. Last, normative commitment also increases for countries with high collectivism and high power distance (Fischer & Mansell, 2009).
Although all the three types of commitments are important to retain employees in the organization, and therefore reduce turnover, Meyer et al. (2012) suggested that affective commitment has the strongest correlation with performance and citizenship behavior compared to normative and continuance commitment (Meyer et al., 2012). For that reason, the present study would focus only on affective commitment as the outcome of job characteristics.
2.3. Relationship between Job Characteristics and Affective Commitment
In the recent decades, there have been some studies trying to analyze direct relationship between job characteristics and affective commitment (e.g.: Lambert & Paoline, 2008; Ozturk et al., 2014). Lambert & Paoline (2008) conducted a study assessing the influence of demographic, organizational and job characteristics on employees’ organizational commitment. Their study came into conclusion that organizational and job characteristics are more important than demographic characteristics in helping shape affective commitment (Lambert & Paoline, 2008).
Similar to Lambert & Paoline (2008), a study by Ozturk et al. (2014) also found direct relationship between job characteristics and workers’ affective commitment. Utilizing Stone’s job scope components consisting of variety, autonomy, task identity, feedback, and interaction, the result indicated that from those five components, autonomy, feedback, and interaction have positive relationship with workers’ affective commitment (Ozturk et al., 2014). The study reported that the remaining job characteristics, variety and task identity, do not have significant impact on affective commitment. Otzurk et al. (2014) suggested that these results might be due to the fact that most of the respondents were frontline employees whose jobs are considered to be simple and repetitive.
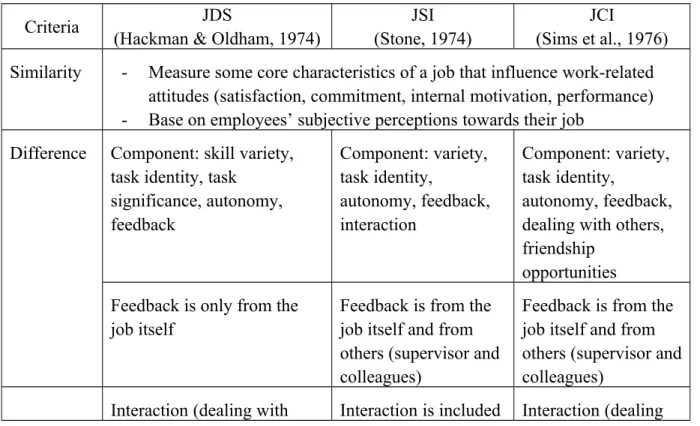
In addition to some studies examining direct relationship between job characteristics and affective commitment, there are some researches which tried to capture employees’ individual differences in the relationship between job characteristics and affective commitment. For example, Zargar et al. (2014) suggested that the relationship between job characteristics and commitment is significantly positive when growth needs are either high or low, although the relationship is much stronger for individuals with high growth need strength. To further understand the moderation effect of growth need strength, they plotted the regression line for affective commitment on job characteristics at 1 standard deviation below and above the mean of growth need strength, representing low and high level of it, respectively (Zargar et al., 2014), as figure 2.2 illustrates.
Figure 2.2. Interaction between Job Characteristics and Growth Need Strength
Source: Zargar et al. 2014. Job scope, affective commitment, and turnover: The moderating role of growth need strength. Journal of Occupational and Organizational Psychology, 87:
292.
All studies mentioned above are focusing only on Western countries. Ross (2004) contended that there is a gap in the area of cross-cultural research in organizational behavior study and that consensus of many models of the study has a Western ethnocentric bias. For that reason, and considering the present study takes place in Indonesia, a review of some previous studies regarding job characteristics and their relationship with commitment conducted in Southeast Asia would create more robust and unbiased framework for this study.
In Malaysia, using job characteristics as one common factor formed by five components (skill variety, task identity, task significance, autonomy, and feedback) as introduced by Hackman & Oldham (1974), Lee (2010) suggested that job characteristics positively influence affective commitment. In addition, Djastuti in Indonesia (2010) contended that job characteristics have a significant positive effect on organizational commitment such that this commitment can be increased by changing the five dimensions of job characteristics as suggested by Hackman & Oldham (1974). The study reported that employees whose job characteristics are high (high skill variety, task identity, task significance, autonomy, and feedback) would have high affective commitment (Djastuti, 2010).
A study in public sector was conducted by Lin et al. (2015) which examined the relationships of job characteristics, leadership styles, job satisfaction, and organizational commitment of public servants in Ministry of Transport in Vietnam. The study reported that
out of five job characteristics, only skill variety and autonomy were found to positively influence organizational commitment of civil servants in that agency (Lin et al., 2015).
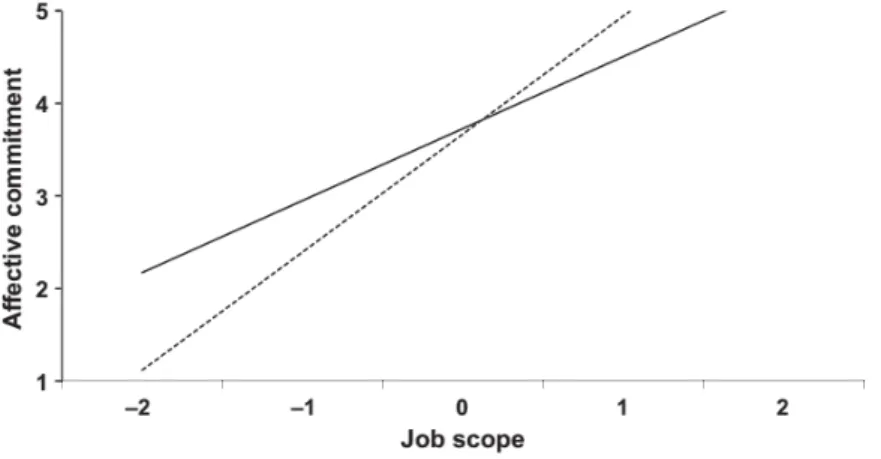
To sum up, most of the previous studies mentioned above contended that there is significant positive relationship between job characteristics and affective commitment, though for the studies that used higher order constructs of job characteristics, the results are slightly different from one to another (Ozturk et al., 2014; Lin et al., 2015). In this present study, to analyze the impacts of job characteristics on affective commitment of the employees of DGCE in Indonesia, we try to respond the call from Zargar et al. (2014) regarding the use of five components subsuming job characteristics. In addition, we also analyze job characteristics as an aggregate which is formed from those five components. Here, aggregated job characteristics collectively represent to what extent a job is enriched with skill variety, identity, significance, autonomy, and feedback (Zargar et al., 2014). Simple additive index is used to calculate the aggregate variable of job characteristics as suggested by Evans & Ondrack (1991).
At the same time, similar to Zargar et al. (2014), growth need strength is included as the moderator variable. Individuals with high growth needs tend to consider challenging jobs to have some kind of achievement incentives. Therefore, they would believe that they owe a lot to their organization for being exposed to high-scope jobs that in return should experience higher level of affective commitment (Zargar et al., 2014). Finally, all the preceding discussions lead to the following model and hypotheses:
Figure 2.3. Research Model
Aggregated Job Characteristics (JC)
Hypothesis 1 : Growth need strength moderates the relationship between job characteristics as an aggregate and affective commitment such that this relationship is positively stronger for employees with higher growth need strength.
Hypothesis 2 : Growth need strength moderates the relationship between skill variety and affective commitment such that this relationship is positively stronger for employees with higher growth need strength. Hypothesis 3 : Growth need strength moderates the relationship between task
identity and affective commitment such that this relationship is positively stronger for employees with higher growth need strength. Hypothesis 4 : Growth need strength moderates the relationship between task
significance and affective commitment such that this relationship is positively stronger for employees with higher growth need strength. Hypothesis 5 : Growth need strength moderates the relationship between autonomy
and affective commitment such that this relationship is positively stronger for employees with higher growth need strength.
Hypothesis 6 : Growth need strength moderates the relationship between feedback and affective commitment such that this relationship is positively stronger for employees with higher growth need strength.
Skill variety (SV) X
Feedback (F) Task Significance (TS)
Autonomy (A) Task Identity (TI)
Affective Commitment
(AC)
Growth Need Strength (GNS)
3. Research Method
3.1. Sampling and Procedure
In this study, the population is all employees of Directorate General of Customs and Excise. Currently, this institution has approximately 13,000 employees that are working at 147 offices. The samples were chosen using convenience sampling method, i.e.: from all offices, several offices were chosen. Then, questionnaires were distributed to the employees of the chosen offices.
The data collected in this research contain 345 responses, which were obtained through both online and offline questionnaires. The online questionnaires were developed using Google Docs Survey, so that they could be distributed to the respondents through the Internet (by email, social media, and other Internet-based communications). They were then distributed to employees working in the Headquarter (1,750 employees) which accounted for 126 responses. The offline questionnaires (350 copies) were distributed directly to employees in 3 local offices in Surabaya (150 copies), Solo (100 copies), and Yogyakarta (100 copies). These offline questionnaires provided 219 responses (Surabaya = 128 responses, Solo = 50 responses, Yogyakarta = 41 responses). All the responses were then put into spreadsheet, and answers from some questions with negative statement (questions section II number 2, 4, 6, 8, and 10, questions section IV number 3, 4, and 5) were reversed. After some checks, there are only 307 responses that will be used in further analysis in this research.
3.2. Measures
In measuring job characteristics (skill variety, task identity, task significance, autonomy, and feedback) and growth need strength, we utilize job diagnostic survey that was introduced by Hackman & Oldham (1974). The questionnaire for job characteristics consists of 15 items which are put in two sections, and each job characteristic is measured by three questions (one question in section 1 and two questions in section 2). Growth need strength is gauged using 6 statements in section 3 which are also derived from Hackman & Oldham (1974) job diagnostic survey. Last, affective commitment is assessed using the questionnaire developed by Allen & Meyer (1991), and then revised by Allen, Meyer & Smith (1993).
The questionnaire adopted in the present study uses five-point Likert scales. In the first section, respondents are asked to give a score from 1 to 5 for indicating their perception
about their jobs. In the next part, they have to indicate the accuracy of several statements describing their jobs (1 = very inaccurate, 5 = very accurate). Section three is asking about to what extend respondents would like to have some preferable conditions present in their jobs (1 = would like having, but only a moderate amount (or less), 5 = would like having extremely much). The last section measures the degree of their agreement with some statements in the questionnaire (1 = strongly disagree, 5 = strongly agree).
3.3. Statistical Analysis
After data collection, we first conduct confirmatory factor analysis (CFA) to confirm the factor structures of the scales used in this study. In case the CFA indicates questionable model fit, an exploratory factor analysis (EFA) would be run to discover factor structures of all items in the questionnaire. Next, we will test the internal consistency using Cronbach’s coefficient alpha. Following these preliminary tests, descriptive statistics comprising means, standard deviation, and correlations are computed. Then, one-way ANOVA analysis is performed to examine the differences between demographic variables.
Prior to regression analysis, both independent variables and moderating variable are centered to their mean before the interaction is computed to improve the interpretability of the result (Dalal & Zickar, 2012). Next, hierarchical regression analysis is conducted with the first step is regressing each job characteristic on affective commitment. Growth need strength is then entered to the regression analysis in the next step. Last, the interaction term between each job characteristic and growth need strength is entered in the third step. If the change in R-square in the last step is significant, it can be concluded that the interaction is a unique predictor of affective commitment (Aiken & West, 1991). To test whether the hypotheses stated in this study are supported or not, the interaction between each job characteristics and growth need strength is examined. If the interaction is positive and significant, then it can be concluded that the hypothesis is supported.
Finally, presenting conditional effect of each independent variable on the dependent variable at some values of the moderator will be done for interpretation purposes. Here, the values of the moderator to be presented are the mean plus/minus 1 SD (standard deviation). Because the moderator has been centered, the mean of the moderator used in the regression would be always zero. Mean minus 1 SD represents low level of growth need strength, while mean plus 1 SD indicates high level of growth need strength.
4. Results
4.1. Participants
The sample comprises 345 responses (289 males and 56 females). After deleting some responses with missing values and invalid answers, 307 usable responses are obtained which consist of 254 males (83%) and 53 females (17%). Based on age, the largest number of the respondents are employees aged 20-29 years old (136 employees or 44% of the sample), followed by 30-39 (30%), ≥ 50 (18%), 40-49 (7%), and < 20 (1%). Next, grouping the sample based on their position in the office, most respondents are staffs (80%), whereas managers and other group of employees are 17% and 3%, respectively. Last, according to the tenure (how long they have been working in their current position), 35% of the sample said they have been working for 1-3 years, 33% for less than 1 year, 13% for 5-10 years, 12% for those that have been working more than 10 years, and 7% for 3-5 years.
4.2. Factor Analysis and Internal Consistency
After data collection, we first run confirmatory factor analysis (CFA) using IBM SPSS AMOS to confirm the factor structures of the scales used in this study. Before conducting the test, all items have been reordered based on the variables used in the study. Skill variety is measured by: question section I number 3 (q_I.3), q_II.1, and q_II.4, task identity: q_I.2, q_II.2, and q_II.7, task significance: q_I.4, q_II.5, and q_II.10, autonomy: q_I.1, q_II.6, and q_II.9, feedback: q_I.5, q_II.3, and q_II.8, growth need strength: q_III.1, q_III.2, q_III.3, q_III.4, and q_III.5, affective commitment: q_IV.1, q_IV.2, q_IV.3, q_IV.4, q_IV.5, and q_IV.6.
To determine the goodness of fit, we calculate the Standardized Root Mean Square Residual (SRMR), Root Mean Square Error of Approximation (RMSEA), and the Comparative Fit Index (CFI)). Next, we use threshold levels that were suggested by Hu and Bentler (1998), complemented by Hair et al. (2010) as table 4.1 illustrates.
Table 4.1. Model fit criteria
Indices Criteria
SRMR < .08
RMSEA < .08
CFI > .90
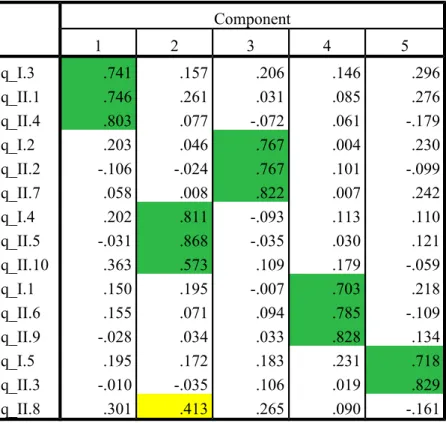
A confirmatory factor analysis on 15 items measuring five job characteristics shows questionable fit indices (SRMR = .0796; RMSEA = .075; CFI = .893). Exploratory factor analysis (EFA) is therefore conducted to uncover underlying structures of the data. The results shows KMO Measure of Sampling Adequacy score .744, indicating that exploratory factor analysis can be applied to all the items. The exploratory factor analysis yields five factors as table 4.2 illustrates. All the questions are grouped based on their predetermined factor, which are indicated by the score in particular component is higher than the score in other components, except for item q_II.8, which should be grouped together with q_I.5 and q_II.3. Therefore, we will exclude responses gathered from this item.
Table 4.2. Rotated Component Matrix – Job Characteristics Component 1 2 3 4 5 q_I.3 .741 .157 .206 .146 .296 q_II.1 .746 .261 .031 .085 .276 q_II.4 .803 .077 -.072 .061 -.179 q_I.2 .203 .046 .767 .004 .230 q_II.2 -.106 -.024 .767 .101 -.099 q_II.7 .058 .008 .822 .007 .242 q_I.4 .202 .811 -.093 .113 .110 q_II.5 -.031 .868 -.035 .030 .121 q_II.10 .363 .573 .109 .179 -.059 q_I.1 .150 .195 -.007 .703 .218 q_II.6 .155 .071 .094 .785 -.109 q_II.9 -.028 .034 .033 .828 .134 q_I.5 .195 .172 .183 .231 .718 q_II.3 -.010 -.035 .106 .019 .829 q_II.8 .301 .413 .265 .090 -.161
Extraction Method: Principal Component Analysis. Rotation Method: Varimax with Kaiser Normalization. a. Rotation converged in 5 iterations.
After excluding item number q_II.8, confirmatory factor analysis shows more acceptable fit indices (SRMR = .0635, RMSEA = .067, CFI = .926). Next, second confirmatory factor analysis is run on items assessing growth need strength. Here, RMSEA is not calculated because the model has small degrees of freedom (df = 5) which can produce artificially large values of RMSEA (Kenny et al., 2014). The output of confirmatory factor analysis shows good fit indices of the scales (SRMR = .0312, CFI =.972).
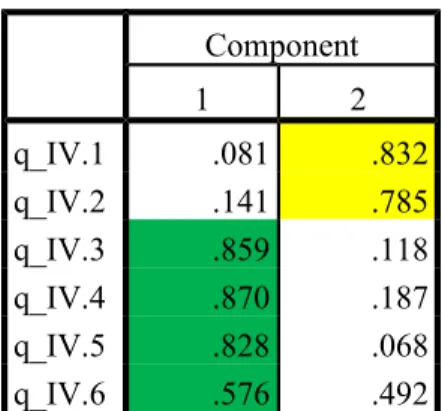
Last confirmatory factor analysis is conducted for 6 items measuring affective commitment. The analysis indicates poor model fit with SRMR = .0831, RMSEA = .141 and CFI = .908. Responding to this result, we run exploratory analysis which yields 2 factors (table 4.3) in which items q_IV.1 and q_IV.2 are grouped in different factor with the remaining items. Therefore, those two items are excluded in the further analysis. Re-test of confirmatory factor analysis for 4 items assessing affective commitment generates considerably better fit indices (SRMR = .0117, RMSEA = .021, CFI = .999).
Table 4.3. Rotated Component Matrix – Affective Commitment Component 1 2 q_IV.1 .081 .832 q_IV.2 .141 .785 q_IV.3 .859 .118 q_IV.4 .870 .187 q_IV.5 .828 .068 q_IV.6 .576 .492
Extraction Method: Principal Component Analysis. Rotation Method: Varimax with Kaiser Normalization.
a. Rotation converged in 3 iterations.
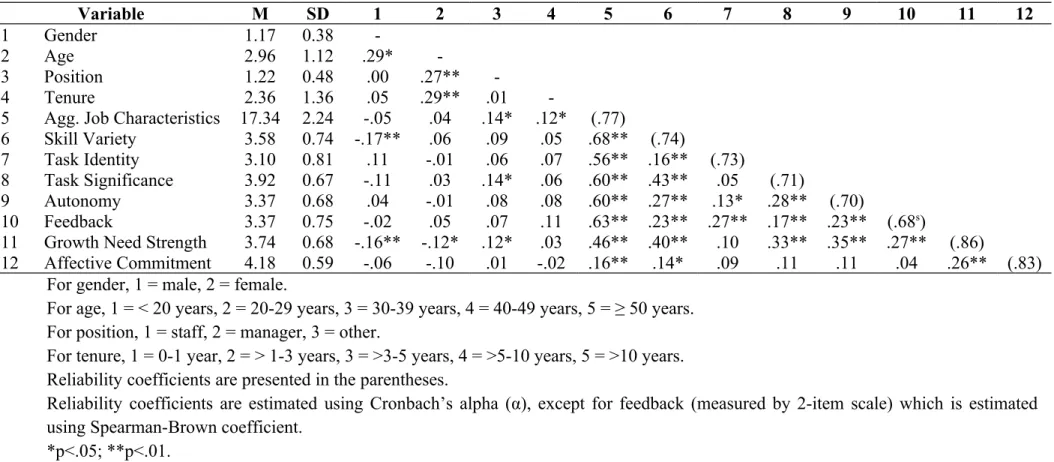
After factor analysis, we examine the internal consistency using Cronbach’s alpha. Each group of questions measuring particular variable is tested to understand how closely items are related as a group. The result is presented in table 4.4 combined with descriptive statistics and correlation between variables. The output shows that most of the groups have Cronbach’s alpha score more than 0.7, indicating that they have acceptable internal consistency (George & Mallery in A.Gliem & R.Gliem, 2003). There is one set of questions measuring feedback that its reliability is examined using Spearman-Brown coefficient due to the use of only two-item scale. The result shows Spearman-Brown coefficient for this group is 0.682.
Table 4.4. Descriptive Statistics and Correlations between Variables Variable M SD 1 2 3 4 5 6 7 8 9 10 11 12 1 Gender 1.17 0.38 -2 Age 2.96 1.12 .29* -3 Position 1.22 0.48 .00 .27** -4 Tenure 2.36 1.36 .05 .29** .01
-5 Agg. Job Characteristics 17.34 2.24 -.05 .04 .14* .12* (.77)
6 Skill Variety 3.58 0.74 -.17** .06 .09 .05 .68** (.74)
7 Task Identity 3.10 0.81 .11 -.01 .06 .07 .56** .16** (.73)
8 Task Significance 3.92 0.67 -.11 .03 .14* .06 .60** .43** .05 (.71)
9 Autonomy 3.37 0.68 .04 -.01 .08 .08 .60** .27** .13* .28** (.70)
10 Feedback 3.37 0.75 -.02 .05 .07 .11 .63** .23** .27** .17** .23** (.68s)
11 Growth Need Strength 3.74 0.68 -.16** -.12* .12* .03 .46** .40** .10 .33** .35** .27** (.86)
12 Affective Commitment 4.18 0.59 -.06 -.10 .01 -.02 .16** .14* .09 .11 .11 .04 .26** (.83)
For gender, 1 = male, 2 = female.
For age, 1 = < 20 years, 2 = 20-29 years, 3 = 30-39 years, 4 = 40-49 years, 5 = ≥ 50 years. For position, 1 = staff, 2 = manager, 3 = other.
For tenure, 1 = 0-1 year, 2 = > 1-3 years, 3 = >3-5 years, 4 = >5-10 years, 5 = >10 years. Reliability coefficients are presented in the parentheses.
Reliability coefficients are estimated using Cronbach’s alpha (α), except for feedback (measured by 2-item scale) which is estimated using Spearman-Brown coefficient.
4.3. Correlation Analysis between Variables
Following preliminary analysis, we examine the correlation among variables used in the study which is presented in table 4.4. As can be seen from table 4.4, affective commitment does not have significant correlation with all variables, except with aggregated job characteristics (r = .16, p < .01), skill variety (r = .14, p < .05), and growth need strength (r = .26, p < .01). This result gives an indication of moderation effect in the model since there is unexpectedly weak or inconsistent relationship between dependent variable and the predictors (Holmbeck, Lindley & Walker in Kim et al., 2001). There is no significant correlation between all demographic variables (gender, age, position, and tenure) and affective commitment. Hence, all the demographic variables will not be used as control variable in the analysis.
4.4. Mean Comparison between Demographic Variables
In this section, independent samples t-test and one-way ANOVA are used to examine whether or not there are significant differences between all demographic factors in perceiving the main variables used in the study. Assumptions underlying independent samples t-test and one-way ANOVA have been examined prior to the tests. We use independent samples t-test to analyze the difference between male and female, and one-way ANOVA for the other demographic factors. All the outputs of independent samples t-test and one-way ANOVA are put in the Appendix 2. First, regarding gender, significant differences are found between male and female in terms of skill variety and growth need strength (p < .01). Male employees perceive their jobs require more skills and talents than female employees do (the means of skill variety for male and female are 3.62 and 3.31, respectively). Male (mean = 3.80) also has considerably higher growth needs compared to female (mean = 3.50). Male and female have no difference in the remaining variables (job characteristics as an aggregate, task identity, task significance, autonomy, feedback, and affective commitment).
Second, comparing the sample based on the age, it is found that there is no difference for all groups regarding their belief about variables being examined in this study. Next, the sample is grouped into 3 categories based on their position in the office: staff, manager, and others. Here, others mean “functional officers” in DGCE, such as auditor, whose carrier path is different from the majority of employees. From all variables, aggregated job characteristics, task significance and growth need strength are the only variables that are perceived differently by all groups (p < .05). Functional officers (others) perceive their jobs as having high level of job characteristics (mean = 18.91) compared to other group of
employees. In term of task significance, managers perceive their jobs to be more important for others compared to other groups (mean = 4.13). Whereas for growth needs, functional employees (others) are the ones who possess highest growth needs (mean = 4.27) compared to staffs and managers.
Last, the samples are differentiated based on the tenure (how long they have been working in current position). Here, aggregated job characteristics and job autonomy are the only variables that are perceived differently between employees with different tenure (p < . 05). Employees that have been working for 5 – 10 years reported high level of job characteristics (mean = 18.12) compared to others. For autonomy, employees that have been working for 1 – 3 years reported higher degree of autonomy compared to other groups (mean = 3.54).
4.5. Hypothesis Testing
In this part, all the independent variables will be analyzed separately in a hierarchical regression analysis by entering one by one independent variable, moderator, and the interaction. The moderation effect exists if the interaction of the independent variable and the moderator is significant (Baron & Kenny in Bedeian & Mossholder, 1994). Moreover, it should be noted that the coefficient of the independent variables and moderating variable do not represent direct effect on dependent variable, since when interaction is included, the effect become conditional (Afshartous and Preston, 2011).
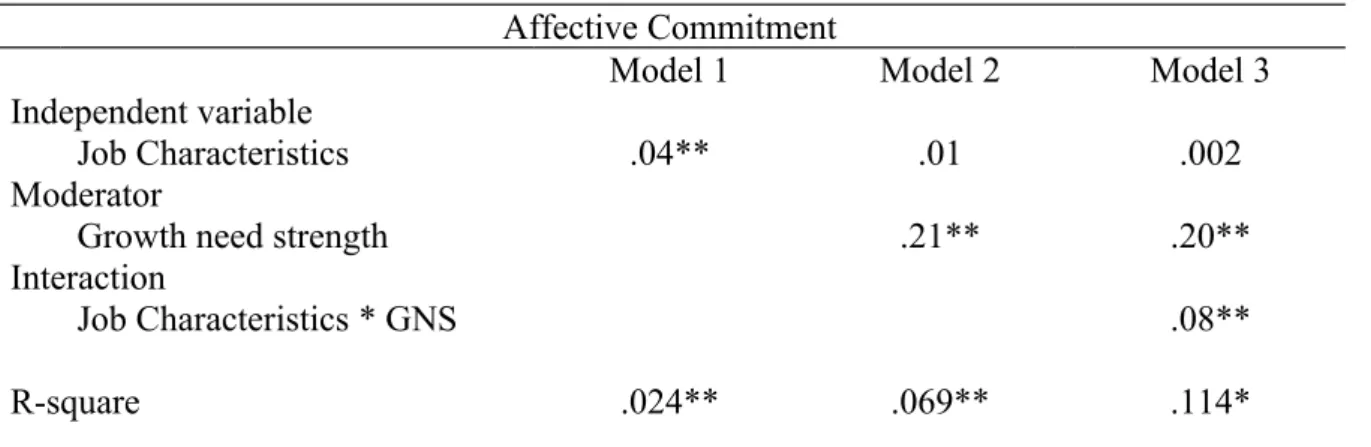
Aggregated Job Characteristics
First hierarchical linear regression is conducted to test the moderation effect of growth need strength in the relationship between job characteristics as an aggregate and affective commitment. The output of the regression is presented in table 4.5.
Table 4.5. Hierarchical Linear Regression (Aggregated Job Characteristics)
Affective Commitment
Model 1 Model 2 Model 3
Independent variable
Job Characteristics .04** .01 .002
Moderator
Growth need strength .21** .20**
Interaction
Job Characteristics * GNS .08**
Adjusted R-square .021 .063 .105
F-value 7.577 11.230 12.933
Change in R-square .045 .045
Note: N = 307
+p ≤ .1, *p ≤ .05, **p ≤ .01
Job characteristics as an aggregate have direct positive effect on affective commitment (p ≤ .05). When the interaction is added into the model, R-square changes by . 045 (p ≤ .05). The interaction between job characteristics and growth need strength is also found significant, indicating that the moderation effect is present in the model (b = .08, p < . 01). Hypothesis 1 is therefore supported: growth need strength moderates the relationship between job characteristics as an aggregate and affective commitment such that this relationship becomes positively stronger for employees with high growth need strength.
The effects of aggregated job characteristics on affective commitment for employees with low and high growth need strength are presented in figure 4.1. The figure shows that aggregated job characteristics have both negative and positive effects on affective commitment, depending on the value of growth need strength. Job characteristics have negative relationship with affective commitment if the employees have low growth needs. In contrary, the effect of job characteristics on affective commitment shifts into positive when the employees have high growth needs.
Performing hierarchical regression with skill variety as the independent variable, growth need strength as the moderator, and affective commitment as the dependent variable generates the output as can be seen in table 4.6.
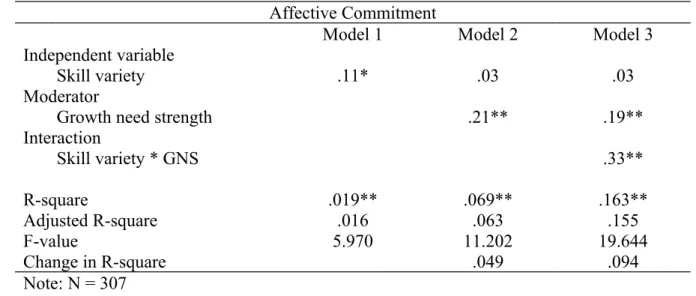
Table 4.6. Hierarchical Linear Regression (Skill Variety)
Affective Commitment
Model 1 Model 2 Model 3
Independent variable
Skill variety .11* .03 .03
Moderator
Growth need strength .21** .19**
Interaction Skill variety * GNS .33** R-square .019** .069** .163** Adjusted R-square .016 .063 .155 F-value 5.970 11.202 19.644 Change in R-square .049 .094 Note: N = 307 +p ≤ .1, *p ≤ .05, **p ≤ .01
Table 4.6 shows that change in R-square in the last step is significant (p ≤ .01), indicating that the interaction between skill variety and growth need strength is a unique predictor of affective commitment. Moreover, the interaction is significant (b = .33, p < .01), which means moderating effect exists in the model. Therefore, it can be concluded that the second hypothesis is supported: growth need strength moderates the relationship between skill variety and affective commitment, and it will cause the relationship is positively stronger for employees with higher growth need strength. Similar to aggregated job characteristics, skill variety has both positive and negative effects on affective commitment depending the growth need strengths of the employees, as figure 4.2 illustrates.
Task Identity
Hierarchical regression examining the moderation effect of growth need strength in the relationship between task identity and affective commitment generates the following result:
Table 4.7. Hierarchical Linear Regression (Task Identity)
Affective Commitment
Model 1 Model 2 Model 3
Independent variable
Task Identity .06 .05 .05
Moderator
Growth need strength .22** .22**
Interaction Task Identity * GNS .002 R-square .008 .071** .071 Adjusted R-square .005 .065 .062 F-value 2.388 11.655 7.745 Change in R-square .063 .000 Note: N = 307 +p ≤ .1, *p ≤ .05, **p ≤ .01
As can be seen in table 4.7, the interaction does not increase the variance explained by the model (change in R-square is not significant). The interaction between task identity and growth need strength is also insignificant, which indicates that growth need strength does not moderate the relationship between task identity and growth need strength. Hence, it can be
concluded that hypothesis 3 is rejected. Task identity does not have significant influence on affective commitment, either direct effect (model 1) or when it is moderated by growth need strength (model 3).
Task Significance
Next, the fourth hierarchical linear regression is conducted to test the moderation effect of growth need strength in the relationship between task significance and affective commitment of the employees. The result of the regression is presented in table 4.8.
Table 4.8. Hierarchical Linear Regression (Task Significance)
Affective Commitment
Model 1 Model 2 Model 3
Independent variable
Task Significance .09+ .02 .01
Moderator
Growth need strength .22** .21**
Interaction Task Significance * GNS .20** R-square .011 .068** .092** Adjusted R-square .008 .062 .083 F-value 3.482 11.032 10.240 Change in R-square .056 .024 Note: N = 307 +p ≤ .1, *p ≤ .05, **p ≤ .01
Table 4.8 shows that when the interaction is added, the change in R-square is significant, indicating that the interaction is a unique predictor of affective commitment. Furthermore, the interaction between task significance and growth need strength is significant (b = .20, p < .01), showing that there is moderation effect in the model. Hence, hypothesis 4 is supported: growth need strength moderates the relationship between task significance and affective commitment such that the relationship is positively stronger for employees with
high growth needs. The effects of task significance on affective commitment for employees with both low and high growth need strength are presented in figure 4.3.
Autonomy
Hierarchical linear regression to test the moderation effect of growth need strength in the relationship between autonomy and affective commitment is presented in table 4.9.
Table 4.9. Hierarchical Linear Regression (Autonomy)
Affective Commitment
Model 1 Model 2 Model 3
Independent variable
Autonomy .10+ .02 .01
Moderator
Growth need strength .22** .22**
Interaction Autonomy * GNS .11 R-square .012 .068** .077 Adjusted R-square .009 .062 .068 F-value 3.772 11.027 8.396 Change in R-square .055 .009 Note: N = 307 +p ≤ .1, *p ≤ .05, **p ≤ .01
Neither the change in R-square nor the interaction between growth need strength and autonomy in the model 3 is significant. Thus, hypothesis 5 proposing that the relationship between autonomy and affective commitment would be positively stronger when growth need strength increases is rejected. As can be seen in table 4.9, instead of moderated by growth need strength, autonomy has direct positive effect on affective commitment (b = .1, p ≤ .1).
Feedback
The last hierarchical linear regression is conducted to test the moderation of growth need strength in the relationship between feedback and affective commitment. Table 4.10 illustrates the result of the regression.
Table 4.10. Hierarchical Linear Regression (Feedback)
Affective Commitment
Model 1 Model 2 Model 3
Independent variable
Feedback .03 -.03 -.04
Moderator
Growth need strength .23** .22**
Interaction Feedback * GNS .13* R-square .001 .068** .080* Adjusted R-square -.002 .062 .071 F-value .416 11.157 8.835 Change in R-square .067 .012 Note: N = 307 +p ≤ .1, *p ≤ .05, **p ≤ .01
When the interaction added into the model, R-square changes by .012 (p ≤ .05), and the interaction is also significant (b = .13, p ≤ .05). Hence, we can conclude that the last hypothesis is supported: growth need strength moderates the relationship between feedback and affective commitment such that the relationship becomes positively stronger for
employees with high growth needs. The effects of feedback on affective commitment is illustrated in figure 4.4.
5. Discussion and Conclusion
5.1. Discussion
Based on hierarchical regression analysis, four out of six interactions between the moderator of growth need strength with each of the five job characteristics plus one aggregated job characteristics are significant (p< .05). For the relationship of aggregated job characteristics with affective commitment, employees with higher level of growth need strength express higher affective commitment as their rating of aggregated job characteristics increases than do employees with lower level of growth need strength. The higher the level of growth need strength, the stronger positive effect an increase in aggregated job characteristics has on affective commitment. This result is consistent with previous study conducted in Indonesia by Djastuti (2010), where job characteristics have positive effect on organizational commitment. However, the present study offers more comprehensive perspective since it recognizes individuals’ difference in term of their growth need strength. For employees with high growth needs, high level of job characteristics might be perceived as a courtesy from the organization that enables them to fulfil their needs for personal growth (Zargar et al., 2014). However, for employees with low growth needs, aggregated job characteristics have negative effects on affective commitment. It may be that for those employees, high job characteristics are perceived as a burden that DGCE put on them which in turn reduce their commitment towards the organization.
The results for skill variety are quite similar to those for aggregated job characteristics. For employees with high growth needs, skill variety has positive effect on their affective commitment. The higher the growth needs, the more positive the relationship between skill variety and affective commitment. In an environment where they are involved in a wide variety of activities, those employees are likely to feel the sense of accomplishment that is resulted from achieving proficiency in some new skills which eventually foster their commitment (Hunter, 2006). Considering this relationship, DGCE should properly fulfil the needs for those employees to acquire new skills in their jobs by, for example, giving enough time to master those skills.
Besides positive effect, skill variety might also produce negative impact on affective commitment if the employees have low growth needs. In this case, rather than perceive as an opportunity, employees in DGCE with low growth needs might see a job that requires wide
variety of activities and skills as an obligation and burden that the organization give to them. Moreover, they might feel that the jobs with high skill variety are beyond their capability which result in a decreased commitment.
For the relationship between task significance and affective commitment, employees with higher growth needs hold higher affective commitment as task significance increases. This result may due to the sense of accomplishment possessed by employees with high growth needs when they realize their jobs are meaningful for others (inside or outside DGCE). They may also perceive the jobs that are important for others as stimulating and challenging which give them many opportunities to learn and develop (Hunter, 2006).
However, the findings show that any increase in task significance might also diminish employees’ affective commitment if they have low growth needs. The explanation for this result might be for some employees, jobs that are significant for others are too much for them which create discomfort and anxiety. Unlike employees with high growth needs, the sense of accomplishment of employees with low growth needs might be weak when they are given such important jobs. It should be noted that based on one-way ANOVA, managers reported higher task significance compared to other groups. It can be because as happens in most organizations, managers have more authorities than staffs have so that their jobs are more likely to have significant impacts on other people. Hence, the level of growth needs of the managers is crucial since it yields greater effects on the affective commitment.
The results also show moderation effect of growth need strength in the relationship between feedback and affective commitment. Again, feedback has both positive and negative effects on employees’ affective commitment depending on the level of growth need strength. The findings might be due to the fact that feedback can be perceived as positive or negative, which depends on the individual characteristic (Culbertson et al., 2013). Employees with high growth needs might prefer jobs that provide clear information about their performance (have high feedback) since they can estimate their accomplishment of their personal goals or standards. For employees with low growth needs, feedback might be perceived negatively which result in decreasing their affective commitment as feedback increases. For them, the more imminent the result of their jobs are known, the less attracted those employees to the jobs which in turn might reduce their commitment (Culbertson et al., 2013).
Next, regression analysis shows that autonomy has direct positive effect on affective commitment without being moderated by growth need strength (p < .1). As autonomy
perceived by employees increases, affective commitment would also increase. This direct effect of autonomy on affective commitment is in accordance with some previous studies (Parker et al., 2001; Kirkwood, 2006; Galletta et al., 2011; Brunetto et al., 2011; Gohar et al., 2015). With a highly independent job, employees might perceive that the results of their works are mostly depending on their efforts so that they feel personally responsible for the success or failure of the works (Galleta et al., 2011). They might also feel that they are trusted by the organization which eventually increase their affective commitment. However, it is interesting to discuss that based on one-way ANOVA, the group of employees who reported highest degree of autonomy is employees that have been working for 1 – 3 years. It can be that the majority of the employees with longer tenures (more than 3 years) are staffs with administrative tasks and lower level of autonomy.
Last, unlike other variables in this study, task identity is the only job characteristic that does not affect affective commitment, either direct or indirect effect. This result is contradictory with some previous researches, such as studies conducted by Allen & Meyer (1990), Dunham et al. (1994), or Djastuti (2010). However, there are also few studies that conform this result, such as studies by Kwon and Banks (2004), Ozturk et al. (2014), and Lin et al. (2015), which suggested that task identity was not found to have significant relationship with organizational commitment. It could be that the employees, regardless their growth needs level, do not respond as favorably to higher level of task identity in their jobs, though based on the observation it also seems that employees in DGCE do not bother with to what extend they can identify the big picture of their jobs.
5.2. Conclusion
Four out of five job characteristics (skill variety, task significance, autonomy, and feedback) are found to have significant relationship with employees’ affective commitment, either direct effect or indirect effect through interaction with growth need strength. By understanding these relationships, DGCE can accurately develop some strategies to increase its employees’ affective commitment. For example, any decision regarding job rotation should consider skill variety, task significance, job feedback, and also the level of growth needs of the employees. It is because “the right man in the right place” here is crucial to improve the affective commitment of the employees that in turn would increase their performance.
A job that requires high or complicated skills, or that is important for other people, would be more suitable for employees with high growth needs, since it would fulfil their expectations and can be interpreted as a support and recognition from the organization that in turn would enhance their commitment towards the organization. Of course, to get optimum benefit, the organization first should be able to identify those employees with strong growth needs. Therefore, an objective and more comprehensive assessment of growth need strength might be needed in order to implement this practice.
Improving the level of autonomy of the employees in doing their jobs would also increase their affective commitment. Enhancing the autonomy could enable the employees to develop new skills and experience more responsibility for any problems at work (Tims and Bakker, 2010). Therefore, job redesign might be one strategy can be chosen in order to empower the employees and increase their independence in doing the jobs.
In longer terms, increasing employees’ growth need strength especially for those whose growth needs are still relatively low, would be also beneficial for the organization. The organization can provide developmental training or coaching that might increase their interest and curiosity in learning new things, and help them to set higher standards for their achievements. By doing so, the negative effects of any jobs with high level of skill variety, significance, or feedback would be minimized, or even can be shifted into positive that benefit the organization.
6. Limitations and Future Directions
As it happens in most studies, some limitations should be admitted in this research. The first limitation is related to the sampling method used in this study which is non-probabilistic sampling (in this study, respondents are chosen from several offices). Non-probabilistic sampling being used in this study might decrease the representativeness of the samples.
Another limitation should be considered is about the use of self-report measures with common method (i.e.: multiple-item scales) without the integration of objective measures, could raise doubts about the validity of the obtained data (Goffin & Gellatly, 2001). Finally, another limitation is the lack of longitudinal design. Commitment is a dynamic process by nature that needs longitudinal-type study to examine its evolution across time (Galleta et al., 2011).
For future research in this topic, it is suggested to analyze antecedents affecting the level of growth need strength of the employees. By recognizing factors that affect growth need strength, it would be easier for any organization to improve the level of growth need strength of its employees, which in turn might improve their affective commitment and performance as well. It is also suggested that future research should consider the use of longitudinal study to investigate long-term effects of the relationship between job characteristics, growth need strength, and affective commitment.
Bibliography
Afshartous, D., & Preston, R. A. 2011. Key results of interaction models with centering. Journal of Statistics Education, 19(3): 1-24.
Aiken, L. S. & West, S. G. 1991. Multiple regression: Testing and Interpreting Interactions. London: Sage Publications.
Aldag, R. J., Barr, S. H., & Brief A. P. 1981. Measurement of perceived task characteristics. Psychological Bulletin, 90(3): 415-431.
Allen, N. J., & Meyer, J. P. 1990. The measurement and antecedents of affective, continuance and normative commitment to the organization. Journal of Occupational Psychology, 63: 1-18.
Allen, N. J., & Meyer, J. P. 1991. A three-component conceptualization of organizational commitment. Human Resources Management Review, 1: 61-89.
Allen, N. J., & Meyer, J. P. 1997. Commitment in the workplace: Theory, research, and application. Thousand Oaks, Calif.: Sage Publications.
Allen, N. J., Meyer, J. P., & Smith, C. A. 1993. Commitment to organizations and occupations: Extension and test of a three-component conceptualization. Journal of Applied Psychology, 78(4): 538-551.
ASEAN. 2015. ASEAN Economic Community: Blueprint 2025. Jakarta: ASEAN Secretariat.
Becker, B. E., & Huselid, M. A. 2010. SHRM and job design: Narrowing the divide. Journal of Organizational Behavior, 31: 379-388.
Bedeian, A. G., & Mossholder, K. W. 1994. Simple question, not so simple answer: Interpreting interaction terms in moderated multiple regression. Journal of Management, 20(1): 159-165.
Brunetto, Y., Wharton, R. F., & Shacklock, K. 2011. Supervisor–subordinate communication relationships, role ambiguity, autonomy and affective commitment for nurses. Contemporary Nurse, 39(2): 227-239.
Campion, M. A. 1988. Interdisciplinary approaches to job design: A constructive replication with extensions. Journal of Applied Psychology, 73(3): 467-481.
Cooper, D. R., & Schindler: S. 2014. Business research methods. New York: McGraw Hill. Culbertson, S. S., Henning, J. B., & Payne, S. C. 2013. Performance appraisal satisfaction:
The role of feedback and goal orientation. Journal of Personnel Psychology, 12(4): 189-195
Dalal, D. K., & Zickar, M. J. 2012. Some common myths about centering predictor variables in moderated multiple regression and polynomial regression. Organizational Research Method, 15(3): 339-362.
Dawson, J. F. 2014. Moderation in management research: what, why, when, and how. Journal of Business Psychology, 29: 1-19.
De Varo, J., Li, R., & Brookshire, D. 2007. Analyzing the job characteristics model: new support from a cross-section of establishments. The International Journal of Human Resource Management, 18(6): 986-1003.
Djastuti, I. 2010. The influence of job characteristics on job satisfaction, organizational commitment and managerial performance. Jurnal Manajemen Bisnis, 3(2): 145-166. Dunham, R. B., Grube, J. A., & Castaneda, M. B. 1994. Organizational commitment: The
utility of an integrative definition. Journal of Applied Psychology, 79(3): 370-380. Evans, M. G. & Ondrack, D. A. 1991. The motivational potential of jobs: Is a multiplicative
mode necessary? Psychological Reports, 69: 659-672.
Fairchild, A. J & MacKinnon, D. P. 2009. A general model for testing mediation and moderation effects. Prevention Science, 10(2): 87-99.
Fischer, R., & Mansell, A. 2009. Commitment across cultures: A meta-analytical approach. Journal of International Business Studies, 40(8): 1339-1358.
Gallagher, W. E., & Einhorn, H. J. 1976. Motivation theory and job design. The Journal of Business, 49(3): 358-373.
Galletta, M., Portoghese, I., & Battistelli, A. 2011. Intrinsic motivation, job autonomy and turnover intention in the Italian healthcare: The mediating role of affective commitment. Journal of Management Research, 3(2): 1-19.
Gliem, J. A., & Gliem, R. R. 2003. Calculating, interpreting, and reporting cronbach’s alpha reliability coefficient for likert-type scales. Midwest Research to Practice Conference in Adult, Continuing, and Community Education: 82-88.
Goffin, R. D., & Gellatly, I. R. 2001. A multi-rater assessment of organizational commitment: are self-report measures biased? Journal of Organizational Behavior, 22: 437-451.
Gohar, F. R., Bashir, M., Abrar, M., & Asghar, F. 2015. Effect of psychological empowerment, distributive justice and job autonomy on organizational commitment. International Journal of Information, Business and Management, 7(1): 144-173. Grant, A. M. 2008. The significance of task significance: Job performance effects, relational
mechanisms, and boundary conditions. Journal of Applied Psychology, 93(1): 108-124.