Universidade da Beira Interior
STEAP1 expression in prostate cancer and
its regulation by androgens
Inês Margarida Amaral Santos Gomes
Covilhã 2010
Universidade da Beira Interior
STEAP1 expression in prostate cancer and its regulation by
androgens
Inês Margarida Amaral Santos Gomes
Dissertação para obtenção do grau de Mestre em Bioquímica pela Faculdade de Ciências da Universidade da Beira Interior
Nome: Inês Margarida Amaral Santos Gomes
Instituição: Universidade da Beira interior (UBI, Faculdade de Ciências)
Orientadores: Professor Doutor Cláudio Jorge Maia Baptista, UBI, Covilhã Professora Doutora Cecília Reis Alves dos Santos, UBI, Covilhã
O presente trabalho é da exclusiva responsabilidade da autora:
ACKNOWLEGMENTS
To my supervisors, Professor Cláudio Maia and Professor Cecília Santos, I would like to thank for the opportunity they gave me to develop this study and for their endless support and constant availability.
To all my colleagues at the Health Sciences Research Centre (CICS) of the University of Beira Interior with whom I shared endless hours….. Thank you!
A huge thanks to my family, specially to my mom and dad, that always supported me through out the years, and to my boyfriend, Carlos, that stood there for me all along and helped me anyway he could.
Finally, I would like to thank all my friends for always bringing a smile to my face, in the good as well as in the bad moments.
LIST OF CONTENTS
List of Figures ... i
List of Tables ... ii
List of Abreviations ... iii
Resumo ... v
Abstract ... vi
CHAPTER I- General introduction 1. Overview ... 1
2. Six transmembrane epithelial antigen of the prostate 1 ... 2
2.1. Structure, function and expression ... 2
2.2. Therapeutic Targets and Biomarker for prostate cancer ... 4
3. Prostate ... 6
3.1. Prostate anatomy and physiology ... 6
3.2. The role of Androgens and Androgen Receptor in prostate development ... 9
3.3. Carcinogenesis of the prostate ... 10
3.3.1. Preneoplastic lesions of the prostate ... 11
3.3.2. Prostate cancer development and metastasis ... 13
3.3.3. The role of androgens and androgen receptor in prostate cancer.. ... 13
4. Aim of the thesis ... 18
CHAPTER II- Materials and Methods 1. Cell lines, animals and human tissues ... 20
2. In vitro studies ... 20
3. In vivo studies ... 21
4. Total RNA extraction and cDNA synthesis ... 21
5. Total protein extraction ... 22
6. PCR ... 22
7. Real Time PCR ... 23
8. Western-Blot analysis... 24
9. Immunohistochemistry... 24
10. Statistical analysis... 25
CHAPTER III- Results and discussion 1. STEAP1 is expressed in several prostate cell lines ... 27
2. Immunohistochemistry... 28
4. STEAP1 mRNA expression is down-regulated and STEAP1 protein expression is up-regulated in castrated rats ... 32 CHAPTER IV- Conclusions
CHAPTER V- Future perspectives References
i
LIST OF FIGURES
Figure 1- Schematic diagram of the structure of the Steap family and yeast FRE1....3 Figure 2- Human prostate anatomy………..5 Figure 3- Human prostate anatomy ………...6 Figure 4- Squematic demonstration of the three progression stages from normal to
metastatic prostate tissue………10 Figure 5- Hit-and-run model for AR action……….………..…14 Figure 6- Mechanisms hypothesized to be involved in the development of castration
resistance in PC………..17 Figure 7- PCR analysis using specific primers for spanning the entire region of
STEAP1 (A) and primers to 18S (B) in non-neoplastic (PNT1A and PNT2) and neoplastic (LNCaP and PC3) human prostate cell lines……….27 Figure 8- Western blot analysis of STEAP1 protein expression using an
anti-STEAP1 polyclonal antibody (1:300) in PNT1A, PNT2, LNCaP and PC3 cell lines……….27 Figure 9- STEAP1 immunoreactivity in 2 of 60 cases of human prostate cancer samples………...27 Figure 10- Effect of DHT on STEAP1 mRNA expression in LNCaP cells by Real-time PCR……….………...29 Figure 11- Analysis of STEAP1 protein expression in a 10mg total protein extract of
LNCaP cells and the effect of DHT on STEAP1 protein expression determined by western blot………30 Figure 12- STEAP1 mRNA expression in rat prostate determined by Real-time PCR.
………....31 Figure 13- Analysis of STEAP1 protein expression using 75g total protein extract of
prostate from intact, castrated + placebo and castrated + DHT rats………..32 Figure 14- Immunohistochemical analysis of STEAP1 protein expression in tissue
ii
LIST OF TABLES
Table 1- Sequences and resulting amplicons sizes of the specific primers and cycling conditions used in RT-PCR for amplification of human 18S and full-length STEAP1 genes.……….. ……….…...22 Table 2- Sequences and resulting amplicons sizes of the specific primers used in Real-time PCR for amplification of human and rat STEAP1 and 2-M, human GAPDH and rat CycA genes………..23
iii
LIST OF ABREVIATIONS
Symbol Designation Akt protein kinase B AR androgen receptor Bcl-2 B-cell lymphoma 2
BPH benign prostatic hyperplasia AREs androgen responsive elements CBP CREB binding protein
cDNA Complementary DNA DHT 5-dihydrotestosterone DNA Desoxyribonucleic acid EGF Epidermal growth factor
EGFR Epidermal growth factor receptor FNO F420H2:NADP+ oxidoreductase HAT histone acetyl transferase HDACs histone deacetylases
HER-2 Epidermal growth factor receptor 2
HGPIN high-grade prostatic intraepithelial neoplasia Hsp Heat shock protein
IL- 6 Interleukin 6 IL-8 Interleukin-8
LNCaP androgen-sensitive human prostate adenocarcinoma cells derived from the left supraclavicular lymph node metastasis
MAPK Mitogen-activated protein kinase MMP matrix metalloproteinase
NCoR nuclear receptor corepressor OHF hydroxyflutamide
ORF open reading frame PAP prostatic acid phosphatase
PC3 prostate adenocarcinoma cell line derived from grade IV androgen independent bone metastasis
iv
PI3K Phosphatidylinositol 3-kinasesPIN prostatic intraepithelial neoplasia PKA Protein kinase A
PNT1A Human post pubertal prostate normal, immortalized with simian virus 40 PNT2 Normal prostate epithelium cell line, immortalized with simian virus 40 Pol III RNA polymerase III
PSA Prostate-specific antigen
STEAP1 Six transmembrane epithelial antigen of the prostate 1 SMRT silence mediator of retinoic acid and thyroid hormone SRC steroid receptor co-activator
SSH suppressive subtractive hybridization SWI /SNF Switch / sucrose nonfermentable complex TAA Tumor-associated antigens
Tf Transferring
uPA urokinase-type plasminogen VEGF Vascular endothelial growth factor
v
RESUMO
Six transmembrane epithelial antigen of the prostate 1 (STEAP1) foi identificado como
um gene sobre-expresso em cancro da próstata humano e em modelos de ratinhos transgénicos com adenocarcinoma da próstata. O STEAP1 está localizado nas junções
celulares das células epiteliais, e o facto de conter na sua estrutura seis hélices
transmembranares sugere que poderá exercer funções de canal membranar ou proteína transportadora em junções de oclusão, junções de hiato ou na adesão celular, promovendo a comunicação intercelular de modo a permitir o crescimento das células cancerígenas. Apesar de haver indicações que apontam para o facto do STEAP1 ser sobre-expresso em todas as fases de desenvolvimento do cancro da próstata, o seu significado clínico permanece por esclarecer. Para além disso, o STEAP1 é mais expresso em células da linha celular LNCaP do que células PC3 sugerindo que os androgénios poderão regular a sua expressão. Como tal, os principais objectivos deste trabalho experimental serão: i) avaliar se a expressão do STEAP1 está relacionada com o relatório clínico de doentes com cancro da próstata; análisar in vitro e in vivo a possível regulação do STEAP1 pela 5-dihidrotestosterona (DHT) por Real-time PCR e Western blot. A análise imunohistoquímica da expressão do STEAP1 revelou que o STEAP1 é principalmente expresso nas células epiteliais, mas também está presente nas células do estroma. O estabelecimento da possível correlação entre a imunoreactividade do STEAP1 e os diferentes estádios de desenvolvimento do cancro da próstata está em decurso. Os resultados in vitro demonstraram que tanto a expressão do STEAP1 a nível do mRNA como da proteína é reduzida pela presença de 1nM ou 10nM DHT após 24h de estimulação. No entanto, será necessário repetir pelo menos mais um ensaio experimental de modo a confirmar estes resultados. Por sua vez, os resultados in vivo demonstraram que a castração aumenta visivelmente a expressão proteica do STEAP1 quando comparada com ratos intactos, e que o tratamento com DHT anula os efeitos da castração na expressão do STEAP1, sugerindo uma diminuição da expressão da proteína em resposta ao DHT. No entanto, estes efeitos não demonstram correlação com a expressão do mRNA, sugerindo o envolvimento de alterações dos mecanismos a nível da tradução.
vi
ABSTRACT
Six transmembrane epithelial antigen of the prostate 1 (STEAP1) was identified as a gene overexpressed in human prostate cancer and spontaneous transgenic mouse model of prostate cancer. It is localized in cell junctions of epithelial cells, and its structure with six transmembrane domains, suggests that it may act as a membrane channel or transporter protein in tight junctions, gap junctions or in cell adhesion, helping in intercellular communication in a way that allows growth of cancer cells. Although STEAP1 expression seems to be up-regulated in all stages of prostate cancer, its clinical significance remains to be clarified. Moreover, STEAP1 is more expressed in LNCaP than in PC3, suggesting that androgens may regulate its expression. Therefore, the goals of this experimental work were: i) to evaluate if STEAP1 expression correlates with clinical reports from patients; ii) to analyze if STEAP1 is regulated by 5α-dihydrotestosterone (DHT) in vitro and in vivo, by Real-time PCR and Western blot. Immunohistochemical analysis revealed that STEAP1 expression is principally associated with epithelial cells, but it is also present in some stromal cells. Analysis of STEAP1 immunoreactivity in prostate cancer is underway. In vitro results demonstrated that both STEAP1 mRNA and protein expression are down-regulated in the presence of 1nM or 10nM DHT after 24h of stimulation. However, at least one more experimental assay is required to confirm these results. In vivo results demonstrated that castration visibly increases STEAP1 protein expression when compared to intact rats, and treatment with DHT abrogates the effect of castration in STEAP1 expression, suggesting that STEAP1 protein is down-regulated by DHT. However, these results do not correlate with STEAP1 mRNA expression, suggesting that mechanisms at the translation level may be involved.
Chapter I- General Introduction
1
1. OVERVIEW
Six transmembrane epithelial antigen of the prostate 1 (STEAP1) was discovered as an up-regulated prostate-specific cell-surface antigen in human prostate cancer and in spontaneous transgenic mouse model of prostate cancer, by suppressive subtractive hybridization (Hubert et al., 1999; Yang et al., 2001). Moreover, it is also expressed in other several types of cancer such as pancreas, colon, bladder, Ewing sarcoma, breast, testis, cervix and ovary (Hubert et al., 1999; Maia et al., 2008). STEAP1 is a 339 aminoacid protein characterized by a molecular topology of six transmembrane domains with a predicted molecular mass of 36KDa. STEAP1 is expressed in epithelial cells of the prostate, especially at the cell-cell junctions. Although its function remains unclear, its putative secondary structure suggests that STEAP1 acts as a membrane channel or transporter protein in tight junctions, in gap junctions, or in cell adhesion, helping in the intercellular communication in a way that allows the growth of cancer cells (Challita-eid et al., 2007; Hubert et al., 1999).
Prostate cancer (PC) is one of the most common cancers in men, and it is responsible for high rates of mortality, particularly in western countries (Ramsay & Leung, 2009). In the initial stages, the growth of prostate cancer cells is dependent from androgens. However, in most cases, prostate cancer progresses to a hormone refractory phenotype for which there is not effective therapy available at present (Kaarbø, Klokk, & Saatcioglu, 2007). Although STEAP1 expression seems to be over-expressed in all stages of PC, the clinical significance of this expression is not fully understood. Furthermore, it seems that STEAP1 expression may be regulated by androgens because it is more expressed in androgen-dependent LNCaP cells then in androgen-independent PC3 cells.
The present work aims to study the expression of STEAP1 in a large number of PC samples; in a way to evaluate if is there some correlation between intensity of STEAP1 immunoreactivity and clinical reports. Furthermore, the role of androgens on STEAP1 expression in rat prostate and LNCaP cells will be evaluated.
Chapter I- General Introduction
2
2. SIX TRANSMEMBRANE EPITHELIAL ANTIGEN OF
THE PROSTATE 1
2.1. STRUCTURE, FUNCTION AND EXPRESSION
STEAP1 was firstly identified as an up-regulated prostate-specific cell-surface antigen in human and rat prostate cancer cells using suppressive subtractive hybridization (Hubert et al. 1999; Yang et al. 2001).
STEAP1 is localized on chromosome 7p22.3, a region close to the telomeric sequences (Hubert et al., 1999). However, Southern blot analysis of genomic DNA derived from prostate cancer xenografts, cancer cell lines, and from normal human cells showed no evidence of amplification or rearrangement of STEAP1 (Hubert et al., 1999). Analysis of human STEAP1 cDNA revealed a full length cDNA of 1995bp with an ORF of 339 aminoacids. Northern blotting analysis using normal tissue RNA showed that two transcripts are expressed, the first with 1,4Kb that encodes the mature protein and the second with 4,0Kb that is unprocessed. The detection of both transcripts was attempted on several non-cancerous tissues. However, it occurred almost exclusively in prostate, suggesting that STEAP1 expression is prostate-specific and does not affect any vital organ. On the other hand, STEAP1 gene is up-regulated in multiple cancers, including prostate, pancreas, colon, bladder, Ewing sarcoma, breast, testis, cervix and ovary (Hubert et al. 1999; Maia et al. 2008).
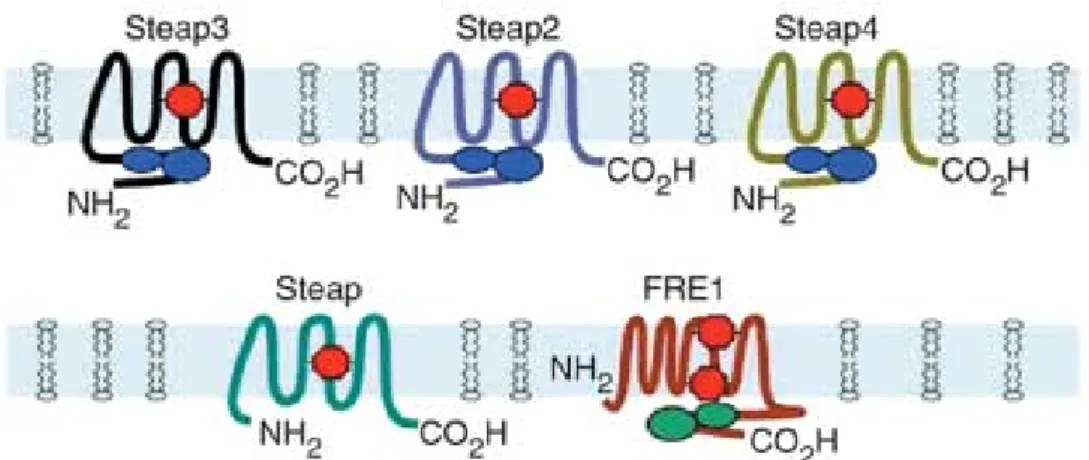
Protein secondary structure is predicted to be a type IIIa membrane protein with a molecular topology of six potential transmembrane domains, three extracellular loops, two intracellular loops, intracellular N- and C-termini and, like other family members, it has intramembrane heme binding sites. However, it lacks the FNO-like reductase domain that would permit its activity as an endosomal ferrireductase that facilitates transferring (Tf) cycle–dependent iron uptake in erythroid precursors (Ohgami et al., 2005) (Figure 1).
Chapter I- General Introduction
3
Figure 1- Schematic diagram of the structure of the Steap family and yeast FRE1. Blue
ovals in tandem represent the flavin-NAD(P)H binding domain. Heme groups are indicated in red. The green in FRE1 represents the FAD:NAD(P)H domain) (Adapted from (Ohgami et al., 2005)).
Analysis of STEAP1 protein expression by Western blot predicts an apparent molecular mass of 36KDa, and confirmes the differential expression of the protein in non-prostate cell lines compared to prostate-derived cell lines and tissues, in accordance to Northern blot data (Hubert et al., 1999).
All members of the STEAP family (STEAP2, STEAP3 and STEAP4) are metalloreductases. However, the role of STEAP1 in metal metabolism is less certain as it does not promote iron or copper reduction uptake (Ohgami et al., 2006). Although its function remains unclear, its putative secondary structure suggests that STEAP1 acts as a membrane channel or transporter protein in tight junctions, in gap junctions, or in cell adhesion, helping in the intercellular communication in a way that facilitates growth of cancer cells (Hubert et al., 1999; Challita-eid et al., 2007).
At the cellular level, immunohistochemical analysis revealed that STEAP1 is expressed in the plasma membrane of the glandular epithelium cells of the prostate, especially at cell junctions. Data obtained from clinical cases demonstrated that STEAP1 seems to be expressed at all stages of prostate cancer, because low grades, high grades, and metastatic prostate cancer specimens all exhibit strong staining, while staining of normal non-prostate tissues showed no detectable STEAP1 expression (Hubert et al., 1999).
Chapter I- General Introduction
4
Interestingly, STEAP1 expression seems to be regulated by androgens as the highest levels of both RNA and protein expression were found in androgen-dependent LNCaP cells contrarily to androgen-independent PC3 cell line which contain lower expression levels of STEAP1 (Hubert et al., 1999).2.2. THERAPEUTIC TARGETS AND BIOMARKER FOR
PROSTATE CANCER
Due to the limitations in the standard treatment of prostate cancer, much effort has been invested in the search for prostate-specific molecules that might serve as cancer biomarkers or as therapeutic targets (Alves et al., 2006; Rodeberg et al., 2005). In fact, STEAP1 was chosen for further studies because it meets the criteria for a good immunotherapeutic target: strong expression in multiple cancer types and restricted expression in normal tissues, cell-surface localization and no homology to any other known proteins (Hubert et al. 1999; Yang et al. 2001).
The identification of tumor-associated antigens (TAA) and their epitopes constitutes an interesting research subject for the development of anti-tumor vaccines with wide applications (Foss, 2002). Because of its characteristics, STEAP1 has been considered as a potential TAA for the development of T cell–based immunotherapy. Different strategies have been followed and the results demonstrated that a variety of STEAP1 epitopes were capable of eliciting anti-tumor CD8+ T cell as well as CD4 helper T cell responses, in the context of MHC class I and MHC class II molecules, respectively (Rodeberg et al. 2005; Alves et al. 2006). Moreover, the successful generation of two monoclonal antibodies that bind to cell surface STEAP1 epitopes provided the tools to study STEAP1 susceptibility to naked antibody therapy (Challita-eid et al., 2007).
Recently, Valenti et al. reported the presence of STEAP-related RNA derived from tumor cells in the serum of tumour patients. Therefore, by relative serum analysis, a non-invasive technique for detection of a broad range of cancers, STEAP1 RNA obtained from circulating RNA from peripheral blood could be a useful marker not only
Chapter I- General Introduction
5
for prostate cancer but also to other cancer types, such as breast, colon, pancreas where it is also highly expressed (Hubert et al., 1999; Maia et al., 2008; Valenti et al., 2009).Even though much is already known about STEAP1, there is still a gap to fulfill concerning its clinical meaning which is not fully understood. Li et al investigated the relationship between STEAP1 expression and the histological grading of prostatic carcinoma concluding that there was no correlation between the two (Li et al., 2004). However, further studies using a larger number of prostate cancer samples are required to evaluate the relationship with Gleason grade and other parameters of clinical relevance in order to have a more attempted and accurate diagnosis and better treatment strategies.
Chapter I- General Introduction
6
3.
PROSTATE
3.1.
PROSTATE ANATOMY AND PHYSIOLOGY
Prostate is an accessory sex gland located just below the urinary bladder, where it surrounds the initial portion of the urethra. Its physiological function is the secretion of numerous substances such as fructose, citric acid and zinc, that form the bulk of the ejaculated semen (Mann 1981). The prostate has the size and shape of a walnut, approximately 3cm high, 4cm wide and 2cm deep (Valerie C. Scanlon 2007) (Figure 2).
Figure 2- Human prostate anatomy. A- Frontal section with bulbous portion of spongy urethra
schematically extended; B- Sagital section (Adapted from (Netter, 1997)).
According to McNeal’s description of prostate anatomy, this gland is divided into five parts, namely, the anterior fibromuscular stroma, the peripheral zone, the central zone, the smaller transition and preprostatic zones (McNeal 1968; McNeal 1980; McNeal 1980; McNeal 1988; McNeal 1988; Partin 1998). The largest of all these regions is the peripheral zone comprising approximately 75% of the glandular tissue
Chapter I- General Introduction
7
which is commonly associated to the development of adenocarcinoma (McNeal 1988). On the other hand, representing approximately 25% of the gland, the central zone is the smallest and is rarely associated with development of adenocarcinoma. Although the transition zone is less than 5% of the gland mass, it represents an important clinical significance because is the main region where the benign prostatic hyperplasia (BPH) occurs. BPH is a non-malignant overgrowth of the gland that is fairly common among aging men (McNeal 1988). The preprostatic tissue is composed by both glandular and nonglandular structures that prevent retrograde ejaculation. Finally, the anterior fibromuscular stroma is responsible for enclosing the prostate gland (Neill’s 2006) (Figure 3).Figure 3- Human prostate anatomy. a. Central zone; b. Fibromuscular zone; c.
Transitional zone; d. Peripheral zone; e. Periurethral gland zone (Adapted from (De Marzo et al., 2007)).
At the cellular level, prostate tissue consists of numerous alveoli lined by pseudostratified epithelium infolding to the lumen and surrounded by stroma. The two major groups of cells that compose the prostatic tissue are the epithelial cells and stromal cells. The epithelium is divided into two different types of cells, namely the columnar luminal cells and the basal cells. The columnar luminal cells comprise the
Chapter I- General Introduction
8
exocrine compartment of the prostate epithelium and produce prostatic secretions and proteins like prostate-specific antigen (PSA) and prostatic acid phosphatase (PAP) (McNeal 1968; McNeal 1981; McNeal 1988). Furthermore, they express high levels of androgen receptor (AR) and require androgens for survival and secretory activity (Wright et al., 1996). In opposite to columnar luminal cells, the basal cell are non-secretory, and are described as undifferentiated cells with capacity to give rise to all types of epithelial cells (van Leenders & Schalken, 2001; Bonkhoff & Remberger, 1996; De Marzo et al., 1998). Basal cells lie beneath the columnar luminal cells layer to form another continuous layer of cells, the basal membrane. They have a distinct morphology, ranging from small flattened cells with condensed chromatin and small amounts of cytoplasm to more cuboidal cells, with increased amounts of cytoplasm and more open-appearing chromatin (Brandes et al., 1964; Mao et al., 1966; Fawcett & Keynes., 1986; McNeal et al., 1988; El-Alfy et al., 2000). Basal cells are also identified by their lack of expression of the major prostatic secretory proteins such PSA and PAP (Epstein 1993). Another difference in relation to epithelial secretory cells is that basal cells are androgen independent for its maintenance and survival. However, their growth and differentiation only occurs in the presence of androgens (De Marzo et al., 1998). Because they are both androgen independent and androgen responsive, AR expression is low when compared to that on columnar luminal cells (Bonkhoff & Remberger, 1993; Leav et al., 1996). As basal cells are located between the secretory epithelial cells and the stroma, it is believed that they may constitute a physical “blood-prostate barrier” preventing the direct contact between substances derived from the blood or stroma with the luminal cells, that could change its endocrine physiology and thereby its regulatory functions (El-Alfy et al., 2000; Habermann et al., 2002).In addition to the luminal and basal cells, the human prostate epithelium contains neuroendocrine cells. Although very little is known about these type of cells, the secretion of neuropeptides such chromogranin A and synaptophysin may predict its involvement in the proliferation of adjacent cells (Bonkhoff & Remberger, 1996; Habermann et al., 2002). These cells express a large variety of peptide hormones, biogenic amines and carrier proteins. The absence of the expression of PSA and AR allows the distinction from the luminal cells also present on the luminal epithelial layer.
Chapter I- General Introduction
9
Another major group of cells that constitute prostate gland are stroma cells. This type of cells consists of fibroblast cells and smooth muscle, providing both structural and biochemical support to the epithelium. AR expression on stromal cells is variable as smooth muscle cells express high levels of AR, whereas fibroblasts do not. It is believed that in the mature prostate, androgens act through paracrine signaling pathways on smooth muscle (which expresses AR) to maintain the fully differentiated growth-quiescent epithelium, and this difference on AR expression contributes to the different epithelial activity despite the overall regulation by circulating androgen levels (Neill, 2006).3.2.
THE ROLE OF ANDROGENS AND ANDROGEN
RECEPTOR IN PROSTATE DEVELOPMENT
The prenatal development of the prostate is androgen-dependent, particularly from DHT. Although the fetal testis produces testosterone, the intracellular reduction of testosterone into DHT by 5-reductase in the prostatic epithelium is necessary for complete prostate morphogenesis (Siiteri & Wilson 1974; Shapiro & Steiner 2000). In individuals lacking functional 5-reductase, the prostate is small or undetectable, but the initiation of prostate development can occur in response to extremely low levels of DHT or in response to testosterone alone, suggesting that a threshold level of DHT is necessary to complete prostate morphogenesis (Imperato-McGinley et al., 1985).
After the development of the prostate, androgens continue to promote survival of the secretory epithelia, the primary cell types thought to be transformed in prostate adenocarcinoma (De Marzo et al., 1998). Cellular homeostasis is modulated in part by paracrine growth factor regulation between epithelial and stromal cells. The reduction of serum and prostatic DHT levels induced by castration promotes the loss of 70% of the prostate secretory epithelial cells which undergo apoptosis, but the basal epithelia and stromal cells remains unaffected (English et al., 1989). Therefore, the prostatic stroma still retains the capacity to respond to androgen even though androgen is not required for its survival. In addition to apoptosis of secretory epithelial cells, castration also
Chapter I- General Introduction
10
results in apoptosis and degeneration of prostatic capillaries and constriction of larger blood vessels, which precedes the appearance of epithelial apoptosis and contributes to a decrease in vascular function (Buttyan et al., 2000). Superphysiological levels of serum androgen in humans result in an increase of cell proliferation in the prostate transitional zone (Jin et al., 1996). Although individual cases of prostate cancer have been reported in anabolic steroid users, epidemiological studies have failed to establish a link between elevated serum testosterone, DHT, or adrenal androgens and prostate cancer risk, suggesting that elevated testicular and adrenal androgens alone do not significantly promote prostate carcinogenesis.3.3.
CARCINOGENESIS OF THE PROSTATE
Prostate cancer is the most commonly diagnosed cancer and the second most common cause of cancer related death in men in the Western world. An estimated 782 600 new cases and 254 000 deaths caused by the disease occurred in 2007 (Ramsay & Leung 2009). In 2009, 192.280 new cases and 27.360 deaths were predicted for 2009 in USA only (Jemal et al. 2009). In Portugal, around 4000 new cases of prostate cancer were diagnosed in 2002, and 2000 deaths were expected (Pinheiro 2003; Jemal et al. 2006). According to the National Statistical Institute of Portugal, in 2008 prostate cancer was the second most incident type of cancer, representing 12.3% of the total malignant tumors recorded. The risk factors associated with the appearance of prostate cancer include age and ethnicity, family history and genetic susceptibility, diet and hormonal levels (Crawford 2003).
The critical pathophysiological factor that contributes to the development of prostate cancer is the inhibition of apoptosis rather than enhanced cellular proliferation (Gurumurthy et al., 2001). This progression is characterized by a down-regulation of androgen responsive genes that inhibit proliferation, induce differentiation or mediate apoptosis, indicating that AR signaling activates growth promoting as well as growth-inhibiting and differentiating genes and that these
Chapter I- General Introduction
11
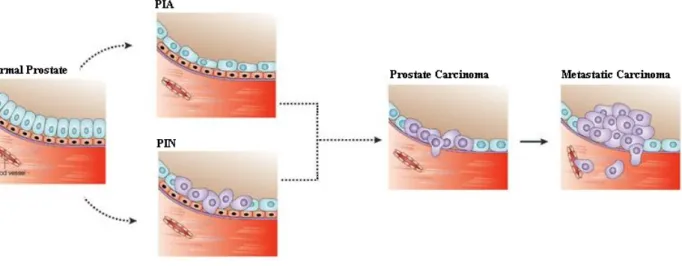
pathways are selectively down-regulated during prostate cancer progression (Joly-pharaboz et al. 2000; Hendriksen et al. 2006; Nelius et al. 2007).There are three different stages involved in development of prostate cancer. Initially, PC progresses from precursor lesions, termed as prostatic intraepithelial neoplasia (PIN) and proliferative inflammatory atrophy (PIA), to histological carcinoma that is confined to prostate, and finally to the progression to metastatic and hormone-refractory carcinoma, that is often lethal (Bosland, 2006) (Figure 4).
Figure 4- Squematic demonstration of the three progression stages from normal to
metastatic prostate tissue (Adapted from (Nelson & Montgomery 2003)).
3.3.1. PRENEOPLASTIC LESIONS OF THE PROSTATE
The causes that lead to the initiation of prostate cancer remain poorly understood. Changes of gene expression in epithelial and stromal tumor cells during the different developmental stages of prostate cancer notably contribute to enhancement of tumor cell growth, survival, migration and invasiveness. In particular, the activation of multiple signaling cascades, including AR, estrogen receptor (ER), epidermal growth factor receptor (EGFR), HER-2, hedgehog and Wnt/b-catenin signaling pathways may confer to these cells the aggressive phenotypes that are observed in high prostatic
Chapter I- General Introduction
12
intraepithelial neoplasia grades of malignancy and adenocarcinomas (Mimeault & Batra 2006).The sustained activation of signaling cascades resulting from the action of androgens, estrogens and distinct growth factors in prostate progenitor epithelial cells may lead to the generation of a heterogeneous population of cancer progenitor cells showing uncontrolled growth and altered differentiation. These cancer progenitor cells, in turn, may induce the formation of PIN-like lesions and, ultimately, prostate cancer development (Mimeault & Batra 2006).
Indeed, the precursor lesion high-grade PIN (HGPIN) is considered most likely to represent a forerunner to prostate cancer on the basis of pathological, epidemiological and cytogenetic evidence. HGPIN is characterized by architecturally benign prostatic acini and ducts, lined by cytological atypical cells. The cytological changes are characterized by prominent nucleoli in a substantial proportion (≥5%) of cells, nuclear enlargement, nuclear crowding, an increased density of the cytoplasm, and variation in nucleolar size. The volume of HGPIN has a positive correlation with tumor stage and Gleason grade as well as the risk of cancer (Bishara et al., 2004; Joshua et al., 2008; Kronz et al., 2001; Qian et al., 1997).
An alternative, possibly earlier precursor is PIA that is defined as discrete foci of proliferative glandular epithelium with the morphological appearance of simple atrophy or postatrophic hyperplasia occurring in association with inflammation and oxidant stress in aging men. The key features of this lesion are the presence of two distinct cell layers, mono-nuclear and/or polymorphonuclear inflammatory cells in both the epithelial and stromal compartments, and stromal atrophy with variable amounts of fibrosis. The evidence linking PIA to prostate cancer is suggestive, although not as convincing as HGPIN (Cheville & Bostwick, 1995; Joshua et al., 2008; Ruska et al., 1998).
Chapter I- General Introduction
13
3.3.2. PROSTATE CANCER DEVELOPMENT AND METASTASIS
Almost all prostate cancers initially develop from androgen-responsive secretory epithelial cells and generally grow slowly within the gland becoming eventually androgen-insensitive. When the tumor cells penetrate the outside of the prostate gland they may spread to tissues near the prostate, first to the pelvic lymph nodes and eventually to distant lymph nodes, bones and organs such as the brain, liver and lungs. There are some evidences that points to the involvement of several oncogenic signaling cascades regulating the progression from localized and androgen-dependent prostate cancer forms into aggressive and androgen-independent states. The genetic changes in stromal–epithelial cells are believed to enhance the differentiation of prostatic smooth muscle and the proliferation of vascular endothelial and epithelial cells during the transition of low- to high-grade PINs and also during the progression from localized prostate cancer forms into metastatic and hormone-refractory carcinoma states (Mimeault & Batra 2006).
Despite the genetic changes, the clinical outcome of a prostate cancer patient is determined by the primary tumor’s capacity to grow, invade locally, evoke angiogenesis, and, eventually, metastasize. Most commonly, human prostate carcinomas metastasize to bone (Condon, 2005).
3.3.3. THE ROLE OF ANDROGENS AND ANDROGEN
RECEPTOR IN PROSTATE CANCER
About 60 years ago, the androgen dependency for development and growth of prostate cancer cells was demonstrated (Huggins & Hodges 2002). Thereafter, much of the focus in prostate cancer research to date has naturally been on androgens. Approximately 80–90% of prostate cancers are androgen-dependent at initial diagnosis, and endocrine therapy of prostate cancer is directed towards how to decrease androgen levels on circulation and how to inhibit AR (Denis & Griffiths 2000; Kaarbø et al.
Chapter I- General Introduction
14
2007). However, androgen ablation therapy ultimately fails, and prostate cancer progresses to a hormone refractory state.For the initiation of prostate cancer, the balance between androgen induced cell proliferation and apoptosis is thought to regulate the growth of normal and cancer cells of prostate, and alterations in this balance can lead to increased cell proliferation (Soronen et al., 2004). The ability of AR to change gene expression that promotes cell cycle progression is clearly dependent on cell context. For example, during development and homeostasis it is clear that the stromal AR plays a major role in stimulating epithelial cell proliferation; by contrast, it is hypothesized that a switching mechanism arises during tumorigenesis to render the proliferative function of AR cell autonomous in prostate cancer cells. The specific combinations of cofactors recruited to AREs (androgen responsive elements) also provide a mechanism for tissue specific and ligand specific gene expression. Through these actions, it is apparent that AR promotes prostate cancer survival and proliferation on prostate cancer cells (Feldman & Feldman 2001; Balk 2002).
AR is a ligand-dependent transcription factor of the nuclear receptor superfamily. According to the hit and run model of AR action, prior to ligand binding, AR is held inactive through association with heat shock proteins (Hsp) and is precluded from DNA binding. DHT binding releases the inhibitory heat shock proteins, and the receptor rapidly translocates to the nucleus, where it binds DNA as a homodimer on AREs within the regulatory regions of target genes (Marivoet et al. 1992; Trapman & Brinkmann 1996; Gelmann 2002). Furthermore, factors of the transcriptional machinery that includes chromatin remodeling complexes (SWI/SNF), AR coactivators (e.g. SRC) which either possess themselves histone acetyl transferase (HAT) activity (e.g CBP) or recruit proteins with HAT activity to the AR-regulated promoters and RNA polymerase II (PolII) are recruited in order to facilitate transcriptional initiation, and AR-dependent gene expression (Gnanapragasam et al. 2000; Heinlein & Chang 2002; Chang 2004; Lonard & O'Malley 2006; Kaarbø et al. 2007). Acetylation of histone tails leads to the remodeling of chromatin for the assembly of a fruitful transcriptional initiation complex. Another histone modification, methylation, which until recently was thought not to be involved in gene regulation, has been found to make critical contributions to AR action. AR is then dynamically displaced from the chromatin (symbolized by the
Chapter I- General Introduction
15
arrows on figure 5) and shuttles between the chromatin-bound and free nucleoplasmic state with a t1/2 of approximately 5 seconds. When AR is bound to the antagonisthydroxyflutamide (OHF), it is released from Hsps and translocates to the nucleus, similar to that for the agonist-bound AR. However, due to conformational changes when bound to OHF, it binds co-repressors, such as NCoR and SMRT, and recruits molecules that give rise to a more compact chromatin state, such as histone deacetylases (HDACs). This does not lead to the assembly of the transcriptional initiation complex and transcription is therefore repressed. Under these conditions, the AR–OHF complex shuttles between the chromatin-bound and free nucleoplasmic state with a t1/2 of
approximately 0.5 seconds, approximately 10 times faster than the AR–DHT complex. Thus, there are rapid, stochastic interactions of AR with chromatin in the nucleus, the nature and outcome of which is different based on the ligand that are bound to AR (Kaarbø, Klokk, & Saatcioglu, 2007) (Figure 5).
Figure 5- Hit-and-run model for AR action (adapted from (Kaarbø, Klokk, & Saatcioglu, 2007)).
Chapter I- General Introduction
16
Hormone-refractory prostate cancer cells proliferation, migration and survival happen through stimulation of multiple signaling pathways, including those that culminate in androgen-receptor signaling and other alternative pathways (Lattouf et al., 2006). Therefore, another possibility for AR to influence the proliferative program is through non-genomic signaling. It is known that androgen stimulation in AR-positive cells can trigger rapid activation of the MAPK pathway, and thereby potentially induces a mitogenic response. Thus, while the mechanisms underpinning the ability of AR to induce a mitogenic program may be diverse and dependent on cell context, it is clear that ligand-dependent activation of AR is a limiting factor for engagement of the cell cycle machinery in prostate cancer cells (Feldman & Feldman 2001; Balk 2002).Recent studies also indicate that in hormone-refractory prostate cancer phase, AR continues to play a central role and therefore is a direct target for therapy. Continued signaling through AR has been postulated to occur via AR amplification, or via AR mutation that increases sensitivity to DHT and non-androgenic steroid molecules or anti-androgens (Chen et al. 2004; Taplin 2007). Other possible AR-dependent mechanisms include activation of the AR or downstream effectors via ligand-independent modifications, such as AR phosphorylation (Kraus et al., 2006), cross-talk with activated tyrosine kinase receptors, such as EGFR or a change in the balance of coactivators and corepressors. Most proposed mechanisms implicate increased sensitivity of AR to low-level androgens, consistent with the finding that, for wild-type AR, the ligand binding domain is necessary for the development of resistance to castration (Chen et al., 2004). Other hypothesis suggests that resistance develops via bypass of intact AR pathways, and protection of cells from castration-induced apoptosis through androgen-independent up-regulation of anti-apoptotic molecules, such as Bcl-2 (Setlur & Rubin, 2005). Finally, some authors have suggested that AR-negative stem cells that are resistant to castration might continuously repopulate the prostate with both androgen-dependant and androgen-independent cells (Pienta & Bradley, 2006) (Figure 6).
Chapter I- General Introduction
17
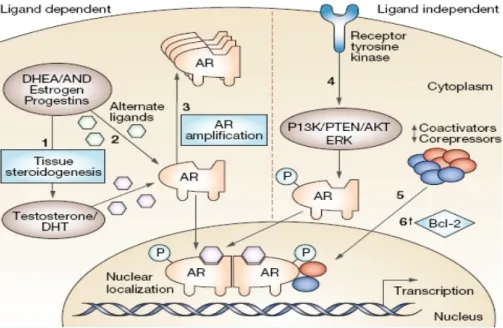
Figure 6- Mechanisms hypothesized to be involved in the development of castration resistance
in PC, divided into ligand-dependent and ligand-independent mechanisms. (1) Tissue and tumoral steroidogenesis contribute to synthesis of testosterone and DHT, and might lead to persistence of tissue-level androgen despite castration. (2) Mutations in AR allow activation by alternate ligands or increased affinity for androgens. (3) Amplification increases AR abundance. (4) Ligand-independent activation of AR through ligand-independent modifications or cross-talk with other pathways, including phosphorylation of AR leading to hypersensitization and increased nuclear translocation. (5) Change in the balance of coactivators and corepressors augment AR activity. (6) Bypass pathways functioning independently of AR activity through upregulation of antiapoptotic molecules, such as Bcl-2 (Adapted from (Harris, Mostaghel, Nelson, & Montgomery, 2009)).
18
4.
AIM OF THE THESIS
One goal of this experimental work was to analyse whether STEAP1 immunoreactivity correlates with clinical reports from patients. To attain this goal, STEAP1 expression was determined in 60 cases of prostate cancer, by immunohistochemistry
Another goal was to evaluate if STEAP1 gene and protein are regulated by androgens in in vitro and in vivo. In in vitro studies, LNCaP cells were stimulated with several doses of DHT for different time periods. The response of STEAP1 to DHT was analyzed by Real Time PCR and Western blot. In in vivo studies, several rats (n=32) were castrated and after 5 days were stimulated with either DHT or placebo. Intact animals were also included in this experiment. The response of STEAP1 to DHT was analyzed by Real Time PCR, Western blot, and immunohistochemistry.
Chapter II- Material and Methods
20
1. CELL LINES, ANIMALS AND HUMAN TISSUES
Prostate cancer cell lines PNT1A, PNT2, LNCaP and PC3 were purchased from the European Collection of Cell Cultures (ECACC, Salisbury, UK).
A total of 48 adult male rats (Rattus Norvegicus), ±3 months old were housed under a 12h light, 12h dark cycle, with food and water available ad libitum during the course of the experiment. Animals were handled in according to NIH guidelines and the European Union rules for the care and handling of laboratory animals (Directive 86\609\EEC).
Human prostate sections (n=60) obtained for immunohistochemistry analysis were retrieved from Hospital Santo António (Porto).
2. IN VITRO STUDIES
PNT1A, PNT2, LNCaP and PC3 cell lines were culture at 37ºC in a 5% CO2 atmosphere with RPMI 1640 phenol-red (Invitrogen) suplemented with 10% FBS and 1% penicillin/streptomycin (Invitrogen). LNCaP cell line was then chosen to study the effects of DHT in STEAP1 expression. For that, approximately 7x10⁵ cells were seeded in 25 cm2 flasks. When growth confluence of 60% was achieved, the medium was replaced by RPMI 1640 phenol-red free supplemented with 5% charcoal-treated FBS (Invitrogen), and cells grown in this medium for 24h. After that, cells were exposed to different doses of DHT (Sigma), namely 0, 1, 10 and 100nM. Cells were incubated with DHT for 12, 24 and 48h using each DHT concentration.
Chapter II- Material and Methods
21
3. IN VIVO STUDIES
Rats were divided into 3 distinct groups, each one containing 16 animals. Animals from two groups were castrated under anesthesia (Clorketam 1000, Vétoquinol, Lure, France). Five days after surgery, they were administrated daily (for 5 days) with intraperitoneal injections of either DHT (500 µg/Kg.day) or vehicle alone (physiologic serum/ethanol 30%). Another group, constituted by intact rats was treated daily with vehicle alone. After treatment, animals were sacrificed under anesthesia and prostate was removed, frozen in liquid nitrogen and stored at -80ºC or fixed in PFA 4% for imunohistochemistry. In each group of 16 animals, prostates were distributed as follows: 8 complete prostates for protein extraction; 8 prostates that were divided in half, and each half was assigned for RNA extraction and fixation in PFA 4%.
4.
TOTAL RNA EXTRACTION AND cDNA SYNTHESIS
Total RNA from prostate cell lines and rat prostate tissue was extracted using TRI reagent (Sigma) according to the manufacturer’s instructions. Tissues were firstly homogenized using an Ultra turrax T25 basic (IKA ® WERKE). In order to access the quantity of total RNA, its optical density at 260 m and 280 m was determined (Pharmacia Biotech, Ultrospec 3000), and the integrity of RNA was verified through agarose gel electrophoresis. cDNA synthesis was carried out using a First Strand cDNA Synthesis Kit (Fermentas). Reverse transcripton reaction was carried out at 42ºC for 60 min in a 20 µl reaction containing 1g of total RNA, random hexamer primers (100 µM), DEPC-treated water up to 12 L, 5X Reaction Buffer, RiboLock™ RNase Inhibitor (20 u/µl), 10 mM dNTP Mix and M-MuLV Reverse Transcriptase (20 u/µl), was added to each tube and incubated at 25ºC for 10 min. The reaction was stopped at 70ºC for 5min.
Chapter II- Material and Methods
22
5. TOTAL PROTEIN EXTRACTION
Prostate cell lines and homogenized tissues were lysed in an appropriate volume of Radioimmunoprecipitation assay buffer (RIPA) (150mM NaCl, 1% Nonidet-P40 substitute, 0,5% Na-deoxycholate, 0,1% SDS, 50mM Tris, 1mM EDTA, 1% Protease cocktail and 10% PMSF) and total proteins (supernatant) were recovered after a 12000g centrifugation for 20 min at 4ºC. Quantification of total protein extracts was assessed using the Bradford method (Biorad Protein Assay).
6.
PCR
PCR reactions were carried out using 1l of cDNA synthesized from PNT1A, PNT2, LNCaP and PC3 cells and rat prostate in a 25L reaction containing DreamTaq Buffer (KCl, (NH4)2SO4 and MgCl2 20mM), 10mM dNTPs (Amersham), 50 nM of each pair of primers, and 0,125U DreamTaq™ Polymerase (Fermentas). Firstly, the integrity of cDNA samples was assessed using a 18S housekeeping gene, and then STEAP1 full-length gene PCR was carried out. Cycling conditions, primers sequences and corresponding amplicon sizes are indicated in table 1.
Table 1- Sequences and resulting amplicons sizes of the specific primers and cycling conditions
used in RT- PCR for amplification of human 18S and full length STEAP1.
Oligo name Sequence (5’-3’)
Amplicon size (bp) Cycling conditions 152 bp 95ºC-5min 95ºC-30s 58ºC-30s 27x 72ºC-20s 72 ºC – 5min
h18S_Fw AAG ACG AAC CAG AGC GAA AG
h18S_Rv GGC GGG TCA TGG GAA TAA
1030 95ºC-5min 95ºC-30s 58ºC-1min 35x 72ºC-1min 72 ºC – 5min
hSTEAP_168 CGG GGT ACC GTG GGT GGC TGA AGC CAT ACT A hSTEAP_1198 CCG GAA TTC CAA CTG GGA ACA TAT CTC AG
Chapter II- Material and Methods
23
7. REAL TIME PCR
Real Time PCR was performed to compare the mRNA levels of STEAP1 in LNCaP cells and prostate tissue from rats subjected to DHT treatments. Specific primers to STEAP1 located in different exons were used (Table 2). To normalize the expression of STEAP1, human GAPDH (hGAPDH), human beta-2-microglobulin (hβ2M), rat beta-2-microglobulin (r2M) and rat cyclophilin A (rCycA) primers were used as internal controls (Table 2). The efficiency of real-time PCR was determined for all designated primers performing serial dilutions (1; 1:10; 1:100; 1:1000) of the cDNA from LNCaP cells and rat prostate tissue. Real Time PCR reactions were carried out using 1 µl of cDNA synthesized in a 20 µl reaction containing 10 µl of MaximaTM SYBR Green/Fluorescein qPCR Master Mix (Fermentas) and primers for each gene. After an initial denaturation at 95 ºC, cycling conditions were as follows: 35 cycles at 95 ºC for 10 s, 60ºC for 30 s, and 72 ºC for 10 s for human samples and 40 cycles at 95 ºC for 10 s, 64ºC for 30 s, and 72 ºC for 10s for rat samples.
To evaluate the specificity of the amplified PCR fragments, melting curves were carried out: reactions were heated from 55ºC to 95ºC with 10 s holds at each temperature (0,05°C/s). Fold differences were calculated following the mathematical model proposed by Pfaffl using the formula: 2-(∆∆Ct) (Pfaffl, 2001).
Table 2- Sequences and resulting amplicons sizes of the specific primers and cycling conditions
used in Real-time PCR for amplification of human and rat STEAP1 and 2-M, human GAPDH and rat CycA.
Oligo name Sequence (5’-3’) Amplicon size (bp) Anneling Temperature
hSTEAP_619 GGC GAT CCT ACA GAT ACA AGT TGC
128
60ºC
hSTEAP_747 CCA ATC CCA CAA TTC CCA GAG AC
hGAPDH_74 CGC CCG CAG CCG ACA CAT C
75
hGAPDH_149 CGC CCA ATA CAA TCC G
hβ2M_347 ATG AGT ATG CCT GCC GTG TG
92
hβ2M_439 CAA ACC TCC ATG ATG CTG CTT AC rSTEAP_849 GCT GCT CAA CTG GGC TTA CAA AC
157
64ºC
rSTEAP_1006 AGT CGC TCA CAG ATG GGA TAG ATG r2M_24 CCG TGA TCT TTC TGG TGC TTG TC
149
r2M_173 CTA TCT GAG GTG GGT GGA ACT GAG
rCyc A_393 CAA GAC TGA GTG GCT GGA TGG
163
Chapter II- Material and Methods
24
8. WESTERN-BLOT ANALYSIS
Total proteins were resolved in a 12% SDS-PAGE gel and electrotransferred to a PVDF membrane (Amersham) at 750mA for 30min. Membranes were blocked for 1h in a 3% casein (Sigma) solution and then probed overnight with a rabbit polyclonal antibody against human STEAP1 (diluted at 1:300, Invitrogen). The membranes were then washed with TBS-T and incubated with goat polyclonal antibody against rabbit IgG (diluted 1:20000; GE Healthcare). Finally, membranes were once more washed with TBS-T and then exposed to ECF substrate (GE healthcare) for 2min, and visualized on the Molecular Imager FX (Biorad, Hercules, USA).
The same membranes probed with -STEAP1 membranes were normalized with mouse-tubuline antibody (diluted 1:5000; Sigma) and then with goat anti-mouse IgG phosphatase alkaline secondary antibody (diluted 1:20000; Abcam).
9. IMMUNOHISTOCHEMISTRY
STEAP1 was detected by IHC in paraffin-embedded PC tissues, and rat prostate tissues obtained from the experiment described above. These sections were deparaffinized with xylene and rehydrated using graded ethanol series. Tissue sections were then incubated for 5min in a 3% hydrogen peroxide solution followed by 30min incubation with 5% normal goat serum (Santa Cruz Biotechnology, Santa Cruz, USA). Sections of human prostate or rat prostate were incubated at room temperature with rabbit primary antibody against STEAP1 (Invitrogen) diluted to 1:100 or 1:50 in PBS containing 1% BSA for 1h or 1h30, respectively. After, the sections were washed with PBS-T for 5 min, and incubated at room temperature for 1h with a biotinylated goat anti-rabbit IgG (Sigma), diluted 1:20. Sections were once more washed in PBS-T for 5min and incubated with Avidin-conjugated rabbit peroxidase (Sigma) for 30min, and then washed with PBS-T for 10min. Colour development was carried out using DAB (Sigma) and 0.0006% hydrogen peroxide. At the end, sections were counterstained in Mayer's hematoxylin, dehydrated, cleared and mounted with Entellan® neu mounting media (Merck, Germany). For negative controls, incubation was performed with PBS 1%BSA (without primary antibody).
Chapter II- Material and Methods
25
10. STATISTICAL ANALYSIS
Data from all experiments are shown as mean + SEM. The statistical significance of the differences in STEAP mRNA and protein, both in in vitro and in vitro experiments was assessed by the student’s t-test. For in vitro studies, data was obtained from two independent experiments, and each experiment was done in triplicate. For in
vivo studies, data was obtained from a single experiment, (n=8 for protein and also for
mRNA analysis, in each group). Significant differences were considered when p<0,01 (**) and p<0,05 (*) compared to control values.
Chapter III- Results and Discussion
27
1. STEAP1 IS EXPRESSED IN SEVERAL PROSTATE CELL
LINES
In order to analyze the STEAP1 expression in several human prostate cell lines, PCR and Western blot were carried out using cDNA and total proteins from non-neoplastic and non-neoplastic prostate cell lines.
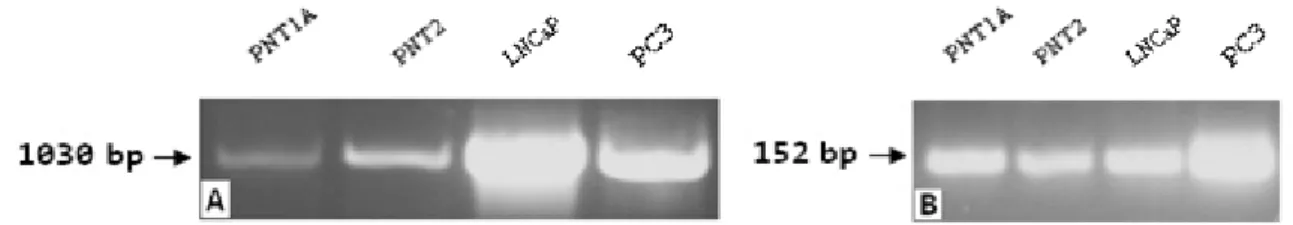
Figure 7- PCR analysis using specific primers for spanning the entire region of STEAP1
(A) and primers to 18S (B) in non-neoplastic (PNT1A and PNT2) and neoplastic (LNCaP and PC3) human prostate cell lines.
PCR results using specific primers to STEAP1 show that this gene is expressed in all prostate cell lines, but with distinct magnitudes. STEAP1 expression is higher in LNCaP cells, followed by PC3 and PNT2 and finally PNT1A cells (Figure 7). These differences could be explained by the fact that LNCaP and PC3 are both cancer cell lines and therefore are expected to have higher levels of STEAP1 than those on PNT1A and PNT2 cells once they represent normal prostate cell lines.
Figure 8- Western blot analysis of STEAP1 protein expression using an
anti-STEAP1 polyclonal antibody (1:300) in PNT1A, PNT2, LNCaP and PC3 cell lines. Molecular weights markers are indicated in kDa on the left hand side.
Chapter III- Results and Discussion
28
Western blot using a human anti-STEAP1 polyclonal antibody enabled the detection of one immunoreactive protein of 36 KDa in LNCaP cells, suggesting that this protein corresponds to STEAP1, as described by others (Hubert et al. 1999). No immunorective proteins were detected in PNT1A, PNT2 or PC3. Taken together that all prostate cell lines express mRNA STEAP1, it seems that STEAP1 mRNA is only translated in LNCaP cells. The overexpression of STEAP1 mRNA and protein expression in LNCaP when compared to PC3, was previously described by Hubert et al. (1999). The main difference between LNCaP cells and PC3 is that LNCaP cells are AR- positive, while PC3 are AR-negative. Therefore, these results also suggest that STEAP1 expression may be regulated by androgens (Figure 8).2. IMMUNOHISTOCHEMISTRY
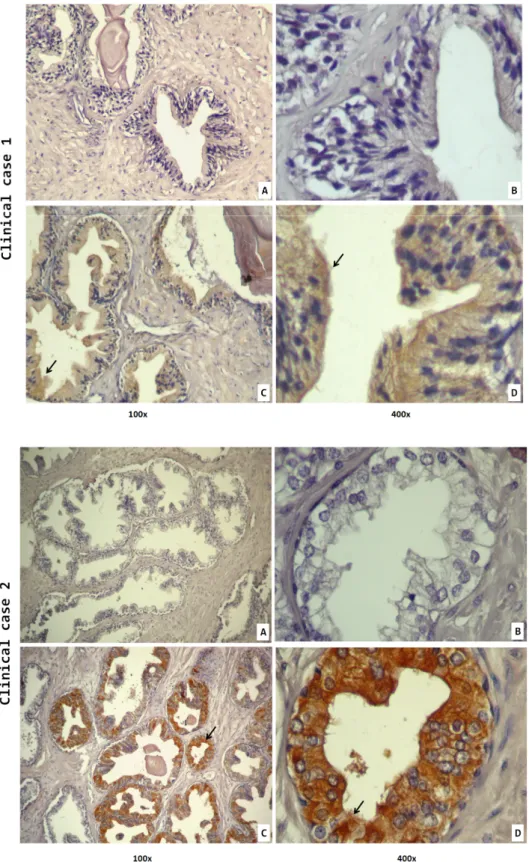
According to previous studies, STEAP1 is expressed in epithelial cells of the prostate, especially in cell junctions (Hubert et al. 1999; Challita-eid et al. 2007). These observations were confirmed by immunohistochemical analysis realized in 60 cases of human prostate cancer samples. Staining of these tissues was specific to STEAP1, which is localized in the plasma membrane of epithelial cells indicating its cell surface presence. A closer look revealed a more intense signal in cell, as expected (Challita-eid et al. 2007; Hubert et al. 1999). In sections incubated with PBS 1% BSA (negative controls), presence of STEAP1 was not detected, but comparing negative controls and those incubated with -STEAP1 it is clear that there is some background staining, possibly due to an inadequate dilution of the primary antibody. Beyond the fact that STEAP1 expression is associated with epithelial cells and its cell junctions, there is some staining in stromal cells as well, though it is far less strong (Figure 9).
To determine if there is some correlation between STEAP1 expression and the clinical reports from patients, analysis of STEAP1 immunoreactivity and statistical treatment of all cases are underway.
Chapter III- Results and Discussion
29
Figure 9- STEAP1 immunoreactivity in 2 of 60 cases of human prostate cancer samples. A, B-
Negative control (without primary antibody) ; C, D- Tissue sections were incubated with anti-STEAP1 polyclonal antibody (1:100). Images were ampliated 100x (A, C) and 400x (B, D).
Chapter III- Results and Discussion
30
3. STEAP1 EXPRESSION IS DOWN-REGULATED IN LNCAP
CELLS
For in vitro experiments, among the four prostate cell lines mentioned above, LNCaP cells were chosen to study the effects of androgens in STEAP1 expression due to the high expression of STEAP1 mRNA and protein, and because they mimick an androgen-dependent stage of prostate cancer.
Real-time PCR analysis demonstrated that DHT induces a down-regulation of STEAP1 mRNA expression. These observations are clear at 12h and 24h of stimulation, with 1nM and 10nM DHT. However, no significant differences are obtained in STEAP1 expression between 1 and 10 nM of DHT. Contrarily to what was observed at 12h and 24h, STEAP1 mRNA expression seems to be up-regulated when exposed to 10nM DHT for 48h, even when incubations were carried out with 1 nM of DHT, suggesting that long periods of time exposure to DHT may increase STEAP1 expression (Figure 10).
Figure 10- Effect of DHT on STEAP1 mRNA expression in LNCaP cells by Real-time
PCR. STEAP1 expression was normalized with GAPDH and 2-Microglobuline housekeeping genes. Data mean were from two independent experiments, and each experiment was done in triplicate. (Student’s t-test, **p<0,01; *p<0.05 compared to control values)
Chapter III- Results and Discussion
31
In order to determine if STEAP1 protein expression is also regulated by DHT, western blot analysis was carried out using a human anti-STEAP1 polyclonal antibody. The results show the presence of a single immunoreactive protein of approximately 36kDa, as described by Hubert (Hubert et al., 1999) (Figure 11).Data analysis after normalization with -tubuline, demonstrated that STEAP1 protein expression may be related to those obtained for STEAP1 mRNA. STEAP1 protein expression is also down-regulated in the presence of DHT 1 nM and 10nM at 24 and 48h of stimulation. The effects of DHT in STEAP1 protein expression are observed at 24 and 48h, but not at 12h of stimulation as observed for STEAP1 mRNA expression. The time gap of 12h between the DHT effect on mRNA and protein expression may result from required-time for mRNA migration into cytoplasm, and for the mechanisms involved in regulation of mRNA translation. No significant differences are observed when LNCaP cells are stimulated with 100nM of DHT, suggesting that STEAP1 is not regulated by supraphysiologic levels of DHT (Figure 11).
Figure 11- Analysis of STEAP1 protein expression using 10g total protein extract of
LNCaP cells after 12h , 24h and 48h of stimuli with 0, 1, 10 and 100nM DHT. (A)- Representative picture from western blot analysis; (B) STEAP1 protein expression after normalization with α-tubuline. Data mean were from two independent experiments, and each experiment was done in triplicate. (Student’s t-test, **p<0,01; *p<0.05 compared to control values)
Chapter III- Results and Discussion
32
4. STEAP1 mRNA EXPRESSION IS DOWN-REGULATED AND
STEAP1 PROTEIN EXPRESSION IS UP-REGULATED IN
CASTRATED RATS
An in vivo study of the effects of DHT on STEAP1 expression was carried out in
adult male rats (3 months old). According to Real-time PCR analysis, mRNA expression of STEAP1 was visibly reduced upon castration. In the rat model, androgen ablation by castration results in a rapid prostatic involution via apoptosis of glandular epithelial cells. Apoptosis is detectable within 1 day, peaks between 3 to 4 days, and then drops to a low level at 7 days after castration. The regressed prostate can be stimulated by androgen replacement to undergo a rapid re-growth until it reaches the normal size, 3 to 5 days after androgen administration (Wang, Tufts, Haleem, & Cai, 1997). Since there are no significant differences between STEAP1 expression on castrated + placebo and castrated + DHT treated groups, validation of the treatment is required (Figure 12).
Figure 12- Effect of castration and DHT treatment in STEAP1 mRNA expression
determined by Real-time PCR. STEAP1 expression was normalized 2-Microglobuline and Cyc A housekeeping genes. (*p<0,05; **p<0.01compared to control).
Western blot analysis shows an increase of STEAP1 expression in castrated rats, and this effect is abrogated when DHT is administrated, suggesting a role of androgens in down-regulation of STEAP1 protein. These results do not correlate with mRNA
Chapter III- Results and Discussion
33
expression, but are in agreement with in vitro experiments, suggesting that mechanisms at the translation level may be involved (Figure 13). Immunohistochemical analysis confirms the results obtained by Western blot, i.e., castrated rats shows an over-expression of STEAP1 protein when compared to intact (control) rats or castrated treated with DHT, suggesting once again, that DHT down-regulates STEAP1 protein expression (Figure 14).Figure 13- Analysis of STEAP1 protein expression using 75g total protein extract of
prostate from intact, castrated + placebo and castrated + DHT rats. (A) Representative picture from western blot analysis; (B) Data mean of STEAP1 protein expression in each experimental group. (Student’s t-test, *p<0.05 compared to intact rats).
Chapter III- Results and Discussion
34
Figure 14- Immunohistochemical analysis of STEAP1 protein expression in tissue sections
of intact rat prostate, castrated and DHT-treated. Negative control (without primary antibody) was done in tissue sections of intact rats, castrated rats (data not shown), and DHT-treated rats (data not shown. Images were amplified 100x (A) and 400x (B). Arrows indicate stained structures.
Chapter IV- Conclusions
36
STEAP1 in an overexpressed gene in human prostate cancer and spontaneous transgenic mouse model of prostate cancer and due to the existent limitations in the standard prostate early diagnosis and treatment, new cancer biomarkers and therapeutic targets are under evaluation. In order to contribute to this search, this study was conduced with the purpose of establishing a correlation between STEAP1 expression and clinical reports from patients with different stages of prostate cancer by immunohistochemistry, and to evaluate if STEAP1 mRNA and protein are responsive to DHT, both in in vitro and in in vivo models, using Real-time PCR, Western blot and immunohistochemical techniques.Immunohistochemical analysis revealed that STEAP1 is in fact expressed in the plasma membrane of epithelial cells, especially at cell junctions. The attempt to establish a correlation between STEAP1 and clinical reports is underway.
For in vitro experiment there were four possible cell lines which could be used to study the effect of DHT in STEAP1 expression. Among the four, LNCaP cells were chosen to study this effect because they contain high levels of both STEAP1, and because they are an in vitro model of androgen sensitive prostate cancer cells.
STEAP1 helps in the intercellular communication in a way that facilitates growth of cancer cells and seems to be expressed at all stages of prostate cancer (Hubert et al. 1999; Challita-eid et al. 2007). Previous studies revealed that DHT induces LNCaP cell proliferation and alters the expression patterns of several important biomarkers of prostate cancer progression, such AR, ER, PSA and others (Arnold et al., 2006). In this experiment, in vitro studies revealed that DHT has inhibitory effects over STEAP1 expression, causing the down-regulation of both mRNA and protein. However, at least one more experimental assay is required to confirm these results. In vivo studies revealed that there was no correlation between mRNA and protein expression, since castration visibly reduces mRNA expression when compared to the intact group, in opposition to the up-regulation of STEAP1 protein expression observed. This suggests that a possible underlying mechanism involving the regulation of translation may exist.
In summary, STEAP1 expression is markedly associated with epithelial cells surface and primary data indicates that DHT promotes a down-regulation on its expression.
Chapter V- Future Perspectives
38
In order to achieve some of the goals of this thesis, there are still a few gaps to fulfill. Among those, the first goal to achieve is the confirmation of the down-regulation of STEAP1 by DHT which requires a third in vitro assay. Furthermore, mechanisms by which DHT regulates STEAP1 expression also needs to be elucidated, as it can only by speculated that it acts through its receptor. For that, cell culture using translation as well as AR inhibitors should be conducted.It should also be of interest to carry out a time-course experience comparing STEAP1 expression levels in in vivo models with and without induced prostate carcinoma and the effects of castration and replacement therapy in each group.