Fish and Fisheries. 2018;19:225–243. wileyonlinelibrary.com/journal/faf
|
225 Received: 22 May 2017|
Accepted: 20 September 2017DOI: 10.1111/faf.12251
O R I G I N A L A R T I C L E
Recreational sea fishing in Europe in a global context—
Participation rates, fishing effort, expenditure, and implications
for monitoring and assessment
Kieran Hyder
1| Marc Simon Weltersbach
2| Mike Armstrong
1| Keno Ferter
3|
Bryony Townhill
1| Anssi Ahvonen
4| Robert Arlinghaus
5,6| Andrei Baikov
7|
Manuel Bellanger
8| Janis Birzaks
9| Trude Borch
10| Giulia Cambie
1,11|
Martin de Graaf
12| Hugo M C Diogo
13| Łukasz Dziemian
14| Ana Gordoa
15|
Ryszard Grzebielec
14| Bruce Hartill
16| Anders Kagervall
17| Kostas Kapiris
18|
Martin Karlsson
19| Alf Ring Kleiven
20| Adam M Lejk
14| Harold Levrel
21|
Sabrina Lovell
22| Jeremy Lyle
23| Pentti Moilanen
4| Graham Monkman
11|
Beatriz Morales-Nin
24| Estanis Mugerza
25| Roi Martinez
1| Paul O’Reilly
26|
Hans Jakob Olesen
27| Anastasios Papadopoulos
28| Pablo Pita
29| Zachary Radford
1|
Krzysztof Radtke
14| William Roche
26| Delphine Rocklin
30| Jon Ruiz
25|
Callum Scougal
1| Roberto Silvestri
31| Christian Skov
32| Scott Steinback
33|
Andreas Sundelöf
34| Arvydas Svagzdys
35| David Turnbull
36| Tessa van der Hammen
12|
David van Voorhees
22| Frankwin van Winsen
37| Thomas Verleye
38| Pedro Veiga
39|
Jon-Helge Vølstad
3| Lucia Zarauz
25| Tomas Zolubas
35| Harry V Strehlow
21Centre for Environment, Fisheries & Aquaculture Science, Lowestoft, Suffolk, UK 2Thünen Institute of Baltic Sea Fisheries, Rostock, Germany 3Institute of Marine Research, Bergen, Norway 4Natural Resources Institute Finland (Luke), Helsinki, Finland 5Department of Biology and Ecology of Fishes, Leibniz-Institute of Freshwater Ecology and Inland Fisheries, Berlin, Germany 6Division of Integrative Fisheries Management, Faculty of Life Sciences, Albrecht-Daniel-Thaer-Institute of Agriculture and Horticulture, Humboldt-Universität zu Berlin, Berlin, Germany 7Fisheries Resources Department, Ministry of Environment, Tallinn, Estonia 8Ifremer, UMR AMURE, Unité d’Economie Maritime, Plouzané, France 9Institute of Food Safety, Animal Health and Environment, Riga, Latvia 10Akvaplan-niva AS, Fram Centre, Tromsø, Norway 11School of Ocean Sciences, Bangor University, Menai Bridge, Anglesey, UK 12Wageningen Marine Research, IJmuiden, The Netherlands 13Marine and Environmental Sciences Centre, Universidade dos Açores, Departamento de Oceanografia e Pescas, Horta, Açores, Portugal 14National Marine Fisheries Research Institute (NMFRI), Gdynia, Poland 15Department of Marine Ecology, Centre d’Estudis Avançats de Blanes (CEAB-CSIC), Blanes, Spain 16NIWA, Auckland, New Zealand This is an open access article under the terms of the Creative Commons Attribution License, which permits use, distribution and reproduction in any medium, provided the original work is properly cited.
17Institute of Freshwater Research, Swedish University for Agricultural Sciences, Drottningholm, Sweden 18Hellenic Centre for Marine Research, Institute of Marine Biological Resources and Inland Waters, Anavissos, Greece 19Department of Aquatic Resources, Institute of Coastal Research, Öregrund, Sweden 20Institute of Marine Research, Flødevigen Marine Research Station, His, Norway 21UMR CIRED, Nogent-sur-Marne Cedex, Paris, France 22NOAA Fisheries, Silver Spring, MD, USA 23Institute for Marine and Antarctic Studies, University of Tasmania, Hobart, Australia 24Mediterranean Institute of Advanced Studies (CSIC/UIB), Esporles, Mallorca, Iles Balears, Spain 25AZTI-Tecnalia, Sukarrieta, Bizkaia, Spain 26Inland Fisheries Ireland, Dublin, Ireland 27Technical University of Denmark, National Institute of Aquatic Resources (DTU Aqua), Lyngby, Denmark 28Fisheries Research Institute, Nea Peramos, Greece 29Department of Applied Economics, Faculty of Economics and Business Administration, University of Santiago de Compostela, Santiago de Compostela, Spain 30Department of Geography, Memorial University of Newfoundland, St. John’s, NL, Canada 31C.I.B.M. Centro Interuniversitario di Biologia Marina ed Ecologia Applicata, Livorno, Italy 32DTU AQUA, Section of Inland Fisheries and Ecology, Technical University of Denmark, Silkeborg, Denmark 33NOAA Fisheries, Woods Hole, MA, USA 34Institute of Marine Research, Swedish University of Agricultural Sciences, Lysekil, Sweden 35Ministry of Agriculture, Fisheries Service, Klaipeda, Lithuania 36Marine Scotland, Scottish Government, Edinburgh, UK 37Institute for Agricultural and Fisheries Research (ILVO), Oostende, Belgium 38Vlaams Instituut voor de Zee (VLIZ), Flanders Marine Institute, Oostende, Belgium 39Centre of Marine Sciences (CCMAR), FCT-7, University of Algarve, Faro, Portugal Correspondence Kieran Hyder, Centre for Environment, Fisheries & Aquaculture Science (Cefas), Lowestoft Laboratory, Lowestoft, UK. Email: kieran.hyder@cefas.co.uk Funding information Institut Français de Recherche pour l’Exploitation de la Mer; French Ministry of Fisheries Management; Greek National Data Collection Programme; European Commission, Data Collection Framework; Department for Environment, Food and Rural Affairs, Grant/Award Number: MF1221, MF1230 and MI001; Norges Forskningsråd, Grant/Award Number: A framework for science-based management of marine recreational fisheries in Norway (267808); State Department of Agriculture, Food Security and Fisheries Mecklenburg-Western Pomerania; Interreg IVa 2 Seas, Grant/Award Number: GIFS project; Dutch Ministry of Economic Affairs, Grant/Award Number: WOT (Wettelijke Onderzoekstaken) programme; European Fishery Fund - Axis 4, approved by FLAG; Department of Environment, Planning, Agriculture and Fisheries from the Basque Government; Government of Galicia, Grant/Award Number: RECREGES project (ED481B2014/034-0)
Abstract
Marine recreational fishing (MRF) is a high- participation activity with large economic value and social benefits globally, and it impacts on some fish stocks. Although reporting MRF catches is a European Union legislative requirement, estimates are only available for some countries. Here, data on numbers of fishers, participation rates, days fished, expenditures, and catches of two widely targeted species were synthesized to provide European estimates of MRF and placed in the global context. Uncertainty assessment was not possible due to incomplete knowledge of error distributions; instead, a semi- quantitative bias assessment was made. There were an estimated 8.7 million European recreational sea fishers corresponding to a participation rate of 1.6%. An estimated 77.6 million days were fished, and expenditure was €5.9 billion annually. There were higher participation, numbers of fishers, days fished and expenditure in the Atlantic than the Mediterranean, but the Mediterranean estimates were generally less robust. Comparisons with other regions showed that European MRF participation rates and expenditure were in the mid- range, with higher participation in Oceania and the United States, higher expenditure in the United States, and lower participation and expenditure in South America and Africa. For both northern European sea bass (Dicentrarchus labrax, Moronidae) and western Baltic cod (Gadus morhua, Gadidae) stocks, MRF represented 27% of the total removals. This study highlights the importance of MRF and the need for bespoke, regular and statistically sound data collection to underpin European fisheries management. Solutions are proposed for future MRF data collection in Europe and other regions to support sustainable fisheries management.1 | INTRODUCTION
Recreational fishing has been shown to be an important component of fishing mortality across the globe (Coleman, Figueira, Ueland, & Crowder, 2004; Cooke & Cowx, 2004, 2006; Ihde, Wilberg, Loewensteiner, Secor, & Miller, 2011; Lewin, Arlinghaus, & Mehner, 2006; McPhee, Leadbitter, & Skilleter, 2002; Post et al., 2002), gener-ating significant economic (e.g. Arlinghaus & Cooke, 2009; Cisneros- Montemayor & Sumaila, 2010; Cowx, 2002; Toivonen et al., 2004) and social benefits (e.g. Arlinghaus, Mehner, & Cowx, 2002; Griffiths, Bryant, Raymond, & Newcombe, 2017; Lynch et al., 2016; Parkkila et al., 2010). In some parts of the world, data on marine recreational fishing (MRF) removals are included in stock assessments, and sepa- rate quota allocations are made for commercial and recreational fish-eries for certain stocks (Ryan, Trinnie, Jones, Hart, & Wise, 2016). The economic value of the recreational fishery is in some cases recognized and taken into account in allocation decisions between sectors (e.g. Lee, Steinback, & Wallmo, 2017; Steinback, 1999; Steinback, Gentner, & Castle, 2004), and specific government policies supporting and pro-moting MRF have been developed (e.g. USA—NOAA, 2015). In Europe, a lack of reliable estimates of recreational catches has resulted in MRF being excluded from stock assessments and allocations for many years (Pawson, Tingley, & Padda, 2007). This can be problematic for some widely targeted species such as Atlantic cod (Gadus morhua, Gadidae), as it may undermine our ability to manage fish stocks to maximum sus-tainable yield (Hyder, Armstrong, Ferter, & Strehlow, 2014) as required by the Common Fisheries Policy (EU, 2013) and Marine Strategy Framework Directive (EU, 2008b). Widely held views that removals and socioeconomic impact of MRF are low have been challenged in Europe. Recent studies in Europe have demonstrated the biologi-cal impact (e.g. Armstrong et al., 2013; Ferter et al., 2013; van der Hammen, de Graaf, & Lyle, 2016; Herfaut, Levrel, Thébaud, & Véron, 2013; Morales- Nin et al., 2005; Sparrevohn & Storr- Paulsen, 2012; Strehlow, Schultz, Zimmermann, & Hammer, 2012; Veiga, Ribeiro, Gonçalves, & Erzini, 2010; Vølstad et al., 2011), economic impact (e.g. Armstrong et al., 2013; Borch, Moilanen, & Olsen, 2011; Herfaut et al., 2013; Monkman et al., 2015) and social benefits (e.g. Armstrong et al., 2013).
Recognizing the need for data to support implementation of the Common Fisheries Policy (EU, 2013), the European Commission in-troduced a Data Collection Framework (DCF) in 2001 placing a legal requirement for Member States to collect specified types of data, including estimates of recreational catches and releases for selected species (EU, 2001). The requirements were altered slightly in the sub-sequent EU DCF regulations (EU, 2008a, 2010, 2016a) that specify a multiannual programme for the collection, management and use
of data in the fisheries sector. The DCF requires estimates of annual recreational catches and releases of Atlantic cod, European sea bass (Dicentrarchus labrax, Moronidae), European eel (Anguilla anguilla, Anguillidae), Atlantic bluefin tuna (Thunnus thynnus, Scombridae), Atlantic salmon (Salmo salar, Salmonidae) and all elasmobranchs, with species requirements varying across regions (EU, 2010; Figure 1). These requirements have been replaced by the EU Multiannual Programme (EU- MAP) for the period 2017–2019 for listed species and/or species identified at marine regional scales needed for fisheries management purposes, for example sea trout (Salmo trutta, Salmonidae) and pollack (Pollachius pollachius, Gadidae) (EU, 2016a; Figure 1). Despite the EU data collection requirements, it has taken time for European coun-tries to develop and implement suitable survey methods for MRF and build scientific expertise. However, data sets of catches are becoming available, and MRF removals have recently been included in stock as-sessments (e.g. western Baltic cod—Eero, Strehlow, Adams, & Vinther (2014), European sea bass—ICES (2012a, 2015a)).
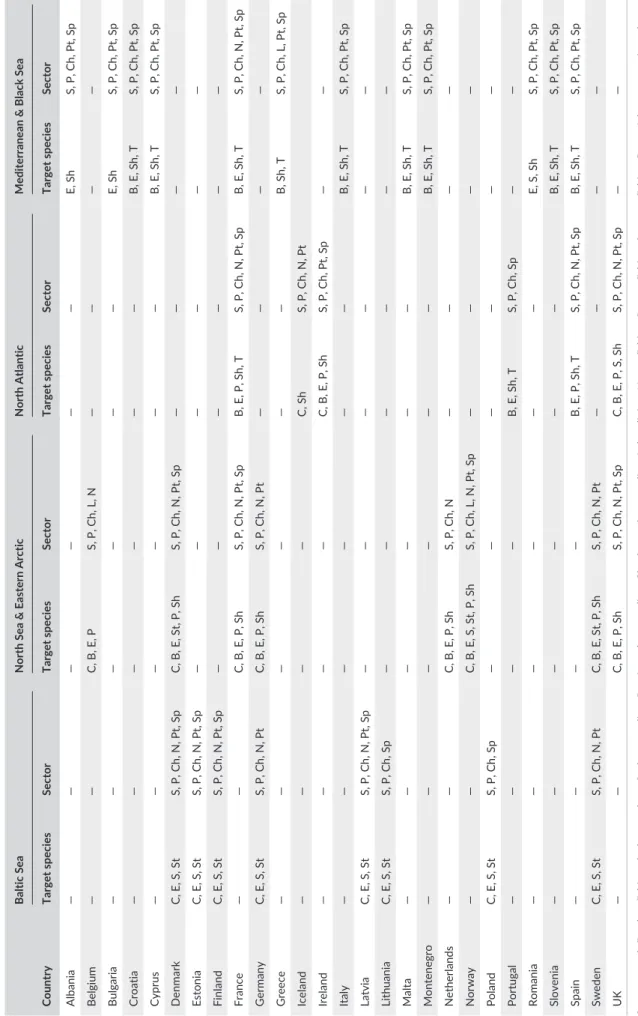
MRF in Europe involves many different methods including both active (e.g. rod and line, spear and hand- gathering) and passive (e.g. nets, traps, pots, and set- lines) approaches (Table 1). A broad range of species are targeted, including finfish (e.g. gadoids, European sea bass, mackerels (Scombridae), flatfish, seabreams (Sparidae)), shell-fish (e.g. scallops (Pectinidae), mussels) and crustaceans (e.g. crabs, European lobster (Homarus gammarus, Nephropidae)), with the mix of species varying between countries (for full details, see Supporting Information). For those species defined under the DCF (EU, 2008a, 2010) or EU- MAP (EU, 2016a) (hereafter termed DCF), Atlantic cod, European eel, Atlantic salmon and sea trout are the main targets in the Baltic Sea; Atlantic cod, European eel, European sea bass, Atlantic salmon, pollack, and elasmobranchs in the North Sea, Eastern Arctic, and North Atlantic; and European sea bass, European eel, elasmo-branchs and Atlantic bluefin tuna in the Mediterranean and Black Seas (Table 1). Many more species are targeted by MRF than are included on the list of species reported under the DCF, so there are numerous other marine species where recreational catches may be a significant or even dominant component of total fishing mortality (e.g. European lobster—Kleiven, Olsen, & Vølstad (2012)).
Even though recreational fishing is thought to have significant impacts on many fish stocks (Arlinghaus & Cooke, 2005), impacts on the marine environment are difficult to assess as global assess-ments of recreational fishing generally do not distinguish between freshwater and marine fisheries (e.g. Arlinghaus, Tillner, & Bork, 2015; Cooke & Cowx, 2004). There are a number of regional esti-mates of MRF globally; however, for Europe, available data are either limited or outdated. There have been several national estimates of MRF participation, effort and expenditure for European countries K E Y W O R D S
European marine recreational fisheries, fisheries assessment and management, fishing effort and expenditure, participation, surveys and monitoring of marine recreational fisheries
(e.g. UK—Armstrong et al., 2013; the Netherlands—van der Hammen et al., 2016; Germany—Strehlow et al., 2012; France—Rocklin, Levrel, Drogou, Herfaut, & Veron, 2014) covering various methods (e.g. an-gling—Veiga et al. (2010), nets and pots—Sparrevohn & Storr- Paulsen (2012), and spearfishing—Zarauz et al. (2015)). However, no attempt has been made to synthesize these data to generate a robust assess-ment of MRF in Europe or address the challenges associated with the underlying data and associated biases. The objectives of this study were to assess the importance of MRF in Europe, highlight key knowledge gaps, make proposals of how to fill these gaps and evaluate the implications of these gaps for fisheries monitoring and assessment. To achieve these objectives, estimates are derived of the total number of fishers, participation rates, days fished and expenditure of MRF in Europe. The contribution of MRF to total fishing mortality is exemplified using western Baltic cod (Figure 1) and European sea bass (ICES areas IVb,c and VIIa,d- h; Figure 1) as case- studies. Results are discussed in the context of global MRF, the im-plications for fisheries management, and proposals are made of how to address the challenges of monitoring and assessment of MRF in Europe and other regions.
2 | METHODS
2.1 | Collection and selection of MRF data
The collection and selection of MRF data are summarized in this sec-tion, but due to the complexity, the full description and justification are provided for each country in the Supporting Information. Data are available from MRF surveys for some countries in Europe, many of which are published in the grey literature and in local languages. Each year the ICES Working Group on Recreational Fisheries Surveys (ICES WGRFS) brings together experts from across Europe and com- piles the latest MRF estimates for species where statutory data col-lection is required (ICES, 2012b, 2013, 2014, 2015b, 2017). Here, available literature was compiled for 27 countries within Europe that had a coastline on the Atlantic Ocean, North Sea, Baltic Sea, Mediterranean Sea, and Black Sea. The only exception was Bosnia and Herzegovina, which has a very limited coastline (see Table 1 for full list of countries). For each country, the population size for 2014 was downloaded (Eurostat, 2016a) and 2014 per capita GDP was sourced (IMF, 2016). The extent of fishing opportunities was
F I G U R E 1 Map of ICES areas and subdivisions of the European marine waters, alongside the region- specific species for which marine
TABLE 1 Marine recreational fish ing sectors an d target species by regions for Europe Country Baltic Sea
North Sea & Eastern Arctic
North Atlantic
Mediterranean & Black Sea
Target species Sector Target species Sector Target species Sector Target species Sector Albania — — — — — — E, Sh S, P, Ch, Pt, Sp Belgium — — C, B, E, P S, P, Ch, L, N — — — — Bulgaria — — — — — — E, Sh S, P, Ch, Pt, Sp Croatia — — — — — — B, E, Sh, T S, P, Ch, Pt, Sp Cyprus — — — — — — B, E, Sh, T S, P, Ch, Pt, Sp Denmark C, E, S, St S, P, Ch, N, Pt, Sp C, B, E, St, P, Sh S, P, Ch, N, Pt, Sp — — — — Estonia C, E, S, St S, P, Ch, N, Pt, Sp — — — — — — Finland C, E, S, St S, P, Ch, N, Pt, Sp — — — — — — France — — C, B, E, P, Sh S, P, Ch, N, Pt, Sp B, E, P, Sh, T S, P, Ch, N, Pt, Sp B, E, Sh, T S, P, Ch, N, Pt, Sp Germany C, E, S, St S, P, Ch, N, Pt C, B, E, P, Sh S, P, Ch, N, Pt — — — — Greece — — — — — — B, Sh, T S, P, Ch, L, Pt, Sp Iceland — — — — C, Sh S, P, Ch, N, Pt Ireland — — — — C, B, E, P, Sh S, P, Ch, Pt, Sp — — Italy — — — — — — B, E, Sh, T S, P, Ch, Pt, Sp Latvia C, E, S, St S, P, Ch, N, Pt, Sp — — — — — — Lithuania C, E, S, St S, P, Ch, Sp — — — — — — Malta — — — — — — B, E, Sh, T S, P, Ch, Pt, Sp Montenegro — — — — — — B, E, Sh, T S, P, Ch, Pt, Sp Netherlands — — C, B, E, P, Sh S, P, Ch, N — — — — Norway — — C, B, E, S, St, P, Sh S, P, Ch, L, N, Pt, Sp — — — — Poland C, E, S, St S, P, Ch, Sp — — — — — — Portugal — — — — B, E, Sh, T S, P, Ch, Sp — — Romania — — — — — — E, S, Sh S, P, Ch, Pt, Sp Slovenia — — — — — — B, E, Sh, T S, P, Ch, Pt, Sp Spain — — — — B, E, P, Sh, T S, P, Ch, N, Pt, Sp B, E, Sh, T S, P, Ch, Pt, Sp Sweden C, E, S, St S, P, Ch, N, Pt C, B, E, St, P, Sh S, P, Ch, N, Pt — — — — UK — — C, B, E, P, Sh S, P, Ch, N, Pt, Sp C, B, E, P, S, Sh S, P, Ch, N, Pt, Sp — — Sectors are defined as fishing platform s where S, shore angling; P, private boat angling; Ch, charter boat angling; L, longlining; N, net fishing; Pt, pot fishing; Sp, spearfishing. Potential target species relates to species where data must be collecte d in Europe following the Data Collection Framework (EU, 2008a, 2010, 2016a), where B, European sea bass; C, Atlantic cod; E, European eel; P, pollack; S, Atlantic salmon; Sh, elasmobranchs; St, sea trout; T, tun a. Regions are defined followin g the Data Collection Framework (EU, 2008a, 2010, 2016a).
characterized for each country, fishing modes and gears, and target species were identified where there are requirements for catches to be reported under the DCF (EU, 2008a, 2010, 2016a).
A list of studies was compiled for each country that included es-timates of number of fishers, participation rates, effort (total days, days per fisher) and expenditure (total expenditure, expenditure per fisher) (see Table 2 and Supporting Information for a full description of derivation of data from studies). For some countries (e.g. Spain and Portugal) or groups of countries (e.g. UK), data were pooled from con-stituent states or regions to provide national estimates (see Table 2 and Supporting Information). Calculations from national data were made where estimates were not provided in survey reports (e.g. only participation rate, but no estimate of numbers). Estimates of participa-tion for France were partitioned between Atlantic and Mediterranean regions using the relative split of sea fishing effort between regions (i.e. 60:40 split) (see Table 2 and Supporting Information).
2.2 | Estimating numbers of fishers, participation
rates, fishing effort and expenditure
Estimates of numbers of recreational sea fishers, participation rates, fishing effort (total days, days per fisher) and expenditure (total, per fisher) were generated for countries bordering the Atlantic (including the Baltic Sea) and the Mediterranean, and all of Europe combined (see Table 2 for a detailed list of countries).
The numbers and participation rates of MRF were used for coun-tries with existing data. The relationship between participation rate and GDP was examined using correlation analysis comparing arc-sine transformed participation rate and per capita GDP (following Arlinghaus et al., 2015). For countries with no data, participation rates were extrapolated to the “recipient country” from the most relevant country identified by national experts, hereafter termed “donor country” (see Table 2 and Supporting Information), and used with population size to estimate numbers of fishers. This assumed that the same proportion of the population was engaged in recre- ational sea fishing in both recipient and donor countries. The num-bers of fishers were then summed for the Atlantic, Mediterranean and the whole of Europe, and used to derive participation rates based on the total population size. To ensure reproducibility of the calculations, the equations are provided below. If Fr is the number of fishers in region r, fi is the number of fishers in country i, m countries are in region r, pj is the participation rate in donor country j used for extrapolation, Pr is the participation rate in region r and xi is the population of country i, then the following equations were used to estimate numbers of fishers: A similar procedure was used to derive estimates of effort, with ex-trapolations based on the average annual fishing days per recreational sea fisher. This assumed that, on average, recreational sea fishers in the recipient country fished the same number of days per year as in the donor country. The average days fished per year was multiplied by the numbers of recreational sea fishers in the country to derive the total effort. The total effort was then summed for Atlantic, Mediterranean and the whole of Europe and the days per fisher derived from the total population size. For expenditure, a similar method was used with the exception that expenditures were first converted to 2015 prices using Harmonised Consumer Price Index (Eurostat, 2016b), and a correction was made for the difference in per capita GDP (IMF, 2016). This assumed that the same proportion of overall wealth is spent on MRF in the donor. If Er is the total expenditure of marine recreational fishers in re-gion r, ei is the per fisher amount spent in country i, ej is the per fisher amount spent in donor country j used for extrapolation, and gi and gj are the per capita GDP in country i and country j respectively, then fisher expenditure was estimated as follows:
An assessment of data quality based on expert judgement was used to select specific studies for the analysis, and a semi- quantitative measure was developed to show the potential bias associated with each survey estimate. This semi- quantitative assessment of bias is similar to approaches used to provide indications of uncertainty in other fields (e.g. food safety—EFSA Scientific Committee (2015)). Each individual country value was assessed for the magnitude and the direction of bias (bi) which was rated on a 7- point scale, ranging between highly overestimated (+3), negligible bias (0), and highly un-derestimated (−3), taking into account known sources of survey bias that might affect the accuracy of the estimates including coverage, non- response, recall and avidity biases (see Pollock, Jones, & Brown (1994); ICES (2010) for general reviews). It was necessary to weight the contribution of the bias in each country (wi), so that, for example, a large error in a small estimate did not have as much influence on the overall bias as a small bias in a large value for a country. Hence to calculate the relative bias in region r (Br), the following equation was used: where wi was the individual country value for number, effort and ex-penditure, and bi was assumed to be the same for the donor and recipient countries (see Supporting Information in Table S1). The relative bias in the overall estimates was a ratio, so it was categorized by sign to indicate direction of bias (positive—overestimates, negative—underestimate) and on a categorical logarithmic scale (negligible < 0.2; 0.2 ≤ minimal < 0.4; (1) Fr= m ∑ i=1 fi (2) where fi= {f
i, country data exist
pjxi, extrapolation needed (3) and Pr= Fr∕ m ∑ i=1 xi (4) Er= m ∑ i=1 eifi (5) where ei= { e
i, country data exist
ejgi∕gj, extrapolation needed (6) Br= m ∑ i=1 biwi∕ m ∑ i=1 wi
0.4 ≤ small < 0.8; 0.8 ≤ moderate < 1.6; and 1.6 ≤ large). The relative bias ranged between −3 and +3, representing the situation where the estimates for all individual countries were highly underestimated (−3) or highly overestimated (+3) in relation to the likely actual value.
2.3 | Comparison with other regions globally
Estimates of numbers, effort and expenditure were compiled from other regions across the world from the published literature in-cluding global analyses (Cisneros- Montemayor & Sumaila, 2010), regional assessments (Pawson et al., 2007; Pawson, Glenn, &
Padda, 2008) and national surveys for the United States (NMFS, 2015), Canada (Brownscombe et al., 2014; Fisheries & Oceans Canada, 2012), Australia (Henry & Lyle, 2003) and New Zealand (Wynne-Jones, Gray, Hill, & Heinemann, 2014). Numbers of rec-reational sea fishers in Canada were derived from the total effort and days fished per fisher, and related to the 2010 population (http://www.statcan.gc.ca/) to give participation rate, and ex-penditure was estimated based on partitioning by effort between freshwater and marine fishing (Fisheries & Oceans Canada, 2012). Estimates of direct expenditure were corrected for inflation to 2015 prices using the World Bank annual regional inflation in
T A B L E 2 Data compiled for each country on recreational sea fishing numbers, participation, activity (average effort per fisher (days) and
total days fished per year), average spend per fisher and total expenditure (euro; not corrected for inflation), and country information including basin (AT – Atlantic, MED – Mediterranean and Black Sea) the Gross Domestic Product (GDP – thousands of USD per capita) and population size compiled from Eurostat (Eurostat 2016a, b)
Country
Country attributes MRF Information
Basin Population (thousand) Per capital GDP Participation rate (%) No fishers (thousand) Effort per fisher (days) Total days fished (thousand) Fisher annual spend (euro) Expenditure (million euro)
Albania MED 2,896 11,377 Greece Greece Italy Italy Italy Italy
Belgium AT 11,204 42,973 0.22* 24 1.05* 26 1,372 33*
Bulgaria MED 7,246 17,860 Greece Greece Italy Italy Italy Italy
Croatia MED 4,247 20,889 Greece Greece Italy Italy Italy Italy
Cyprus MED 858 30,769 Greece Greece Italy Italy Italy Italy
Denmark AT 5,627 44,343 6.90* 386 6.15* 2,370 543 210*
Estonia AT 1,316 26,999 1.48* 20 Latvia Latvia 275 5*
Finland AT 5,451 40,347 5.50* 300 10.70 3,200 Sweden Sweden
France AT & MED 63,929 40,375 2.06* 1,319 6.79* 8,960 Germany Germany
Germany AT 80,767 45,888 0.22 174 7.84 1,365 676 118*
Greece MED 10,904 25,859 2.70 300 France France Italy Italy
Iceland AT 326 43,637 31.50 103 Norway Norway Denmark Denmark
Ireland AT 4,606 49,195 2.13* 77 8.28 634 1,641 126
Italy MED 60,783 35,486 1.32* 800 6.00 4,800* 300 240*
Latvia AT 2,001 23,707 2.04* 41 37.30 34 Estonia Estonia
Lithuania AT 2,943 27,051 Latvia Latvia Latvia Latvia Estonia Estonia
Malta MED 425 33,216 Greece Greece Italy Italy Italy Italy
Montenegro MED 622 14,996 Greece Greece Italy Italy Italy Italy
Netherlands AT 16,829 47,355 3.20 504* 3.60 1,823 275 139*
Norway AT 5,108 66,937 33.00 1,285*‡ 11.50*‡ 14,779*‡ Denmark Denmark
Romania MED 19,947 19,711 Greece Greece Italy Italy Italy Italy
Poland AT 38,018 25,105 Germany Germany 1.74* 143 Estonia Estonia
Portugal■ AT 10,427 26,975 1.67 175 36.83 6,431 796*● 139*●
Slovenia MED 2,061 29,658 Italy Italy Italy Italy Italy Italy
Spain (AT)■ AT 24,483 33,711 0.67* 165 29.64 4,889 672 111*
Spain (MED)■ MED 22,029 33,711 0.61* 133 33.00 4,399 Spain (AT) Spain (AT)
Sweden AT 9,645 45,986 5.74* 566* 7.90 4,471 395*♦ 223*♦
UK■ AT 64,308 39,511 1.79 1,150 6.15* 7,074 1,664† 1,914†
*Indicates calculation of figure using survey data. Where data were not available or of insufficient quality to be used, the extrapolation country is indicated. Constant exchange rates assumed of 1.25 euro to GBP (†) and 0.11 euro to Swedish Krona (♦). ■indicates compilation of total from different regions; ●correction to 2015 prices; and ‡based on the Norwegian population between 16 and 79 years in 2014.
consumer prices (http://databank.worldbank.org/) and converted into euros.
The regions in the global analysis of expenditure (Cisneros- Montemayor & Sumaila, 2010) were not identical to those used by the World Bank, so the region for 28 countries of the European Union was used for Europe, all development states in Latin America and the Caribbean used for the Caribbean, Central America and South America, and Australia used for Oceania. Comparisons were then made between the estimates developed in this synthesis and other regions globally for participation rate, effort and expenditure, and used to assess the importance of the sector in Europe. Cisneros- Montemayor and Sumaila (2010) split Europe into four areas, but did not provide details of the countries in each area, so comparisons were made with north and south regions of Europe.
2.4 | Removals by MRF and comparisons with
commercial fisheries
Despite the European requirement for recreational catches and re- leases to be reported for several species (EU, 2008a), only stock as-sessments for western Baltic cod (ICES subdivisions 22–24—Eero et al., 2014; ICES, 2016b), Atlantic salmon in the Baltic Sea (ICES subdivisions 22–32—ICES, 2015c), and European sea bass (ICES areas IVb- c and VIIa,d- h—ICES, 2015a) (Figure 1) included MRF catches. Comparisons of the recreational and commercial removals were made between reconstructed recreational removals and commercial catches.
The derivation of recreational removals for western Baltic cod (Strehlow et al., 2012) and subsequent inclusion in the stock as-sessment are well described (Eero et al., 2014). At present, only recreational removals from Germany have been included in the stock assessment (Strehlow et al., 2012), but data were available for Denmark (Sparrevohn & Storr- Paulsen, 2012) and Sweden (ICES, 2015b). Here, total recreational removals (catches and dead releases) were estimated using catches and releases multiplied by post- release mortality for all countries with MRF for western Baltic cod. Available data were grouped into sea- based (boat angling, charter boat angling, trolling) and land- based (shore angling, wad-ing) fishing modes. Post- release mortality of cod was assumed to be 100% for shore- based releases (precautionary approach), and a mortality rate of 11.2% was applied to boat- based releases (ICES, 2016b; Weltersbach & Strehlow, 2013). For European sea bass, estimates have been compiled and used in ICES stock assessments for ICES areas IVb- c and VIIa,d- h (Figure 1), and a full description of methodology has been published in ICES re- ports (ICES, 2012a, 2015a). Estimates of European sea bass remov-als by recreational fishers have been made for England (Armstrong et al., 2013), France (Herfaut et al., 2013; Levrel, Bellanger, Le Goff, & Drogou, 2013; Rocklin et al., 2014), Belgium (ICES, 2012a) and the Netherlands (van der Hammen & de Graaf, 2015). The methods for collection of data varied (see Supporting Information for descrip-tion of surveys), and there was no single year for which recreational estimates were available for all countries. Hence, estimates for sev-eral years were combined to give an average value that was allocated to 2012 for the purposes of the ICES stock assessment and are pre-sented here.
3 | RESULTS
3.1 | Numbers of fishers, participation rates, fishing
effort and expenditure
The total number of European recreational sea fishers was estimated to be approximately 8.7 million, with 5.9 million and 2.8 million in Atlantic and Mediterranean regions, respectively (Figure 2, Table 3). Around 13% of the total estimate was based on extrapolation be-tween countries, with a greater proportion of the Mediterranean region estimates subjected to extrapolation (Table 4). The highest numbers of recreational sea fishers were from Norway and the UK in the Atlantic region, whereas the greatest numbers of fishers in the Mediterranean were from Italy (Figure 2, Table 3). The overall participation rate for the whole of Europe was 1.6%. In the Atlantic region, participation rates ranged between 33% (Norway) and 0.22% (Germany). In the Mediterranean, Greece (2.7%) had the highest and Spain (0.61%) had the lowest participation rate, but there was con-siderable uncertainty about participation rates in many of the other countries (Figure 2, Table 3). The semi- quantitative assessment of bias indicated that the estimate of the numbers of people fishing recreationally in the Atlantic region was reasonable with only a small underestimate likely, but there was potential for a large underesti- mate for the Mediterranean and a moderate underestimate of num-bers for the whole of Europe (Table 4). Individual country surveys were generally categorized as negatively biased due to coverage issues. There was a significant positive correlation between per cap-ita GDP and participation rate (r = 0.56, n = 19, p < 0.05), but this was driven by a single value for Norway. Removal of Norway from the analysis led to a non- significant positive relationship (r = 0.24, n = 18, p > 0.05), so more data would be needed to characterize this relationship. The total MRF effort in Europe was estimated at 77.6 million sea fishing days, with the majority (73%) carried out in the Atlantic (56.8 million fishing days) compared to the Mediterranean (20.9 million fish-ing days) (Figure 3, Tables 3 and 4). Over 5 million days in total were fished each year in Norway, UK, Portugal, France and Spain (Figure 3, Table 3). This equated to on average 9.0 sea fishing days per recre-ational fisher in Europe, with more than 10 days fished per year in Estonia, Finland, Iceland, Latvia, Lithuania, Norway, Portugal, and Spain (Figure 3, Table 3). About 16% of the fishing effort estimate was based on extrapolation between countries, with a much higher pro-portion extrapolated in the Mediterranean (Table 4). Overall, the semi- quantitative assessment of bias indicated that effort estimates were reasonable for the Atlantic region and the whole of Europe (minimal and small underestimation, respectively), but there was a moderate underestimate of participation for the Mediterranean generally due to under- coverage of fishing methods (Table 4).
The expenditure by recreational sea fishers was estimated to be €5.89 billion in Europe, with around €4.97 and €0.92 billion spent in the Atlantic and Mediterranean regions, respectively (Tables 3 and 4). The UK and Norway accounted for 53% of this expenditure, with the UK having the highest annual average ex-penditure per recreational sea fisher at €1,732 (Figure 4, Table 3). On average, European recreational sea fishers spend €680 an-nually. In total, 42% of the expenditure estimate for Europe was based on extrapolations between countries (Table 4). Overall, the semi- quantitative assessment of bias indicated that expen-diture estimates were reasonable for the Atlantic region and the whole of Europe, but were moderately underestimated for the Mediterranean (Table 4). There was no significant correlation be-tween per capita GDP and expenditure (r = 0.25, n = 11, p > 0.05), but this was based on a small sample size, and the overall trend was positive.
3.2 | Comparison with other regions globally
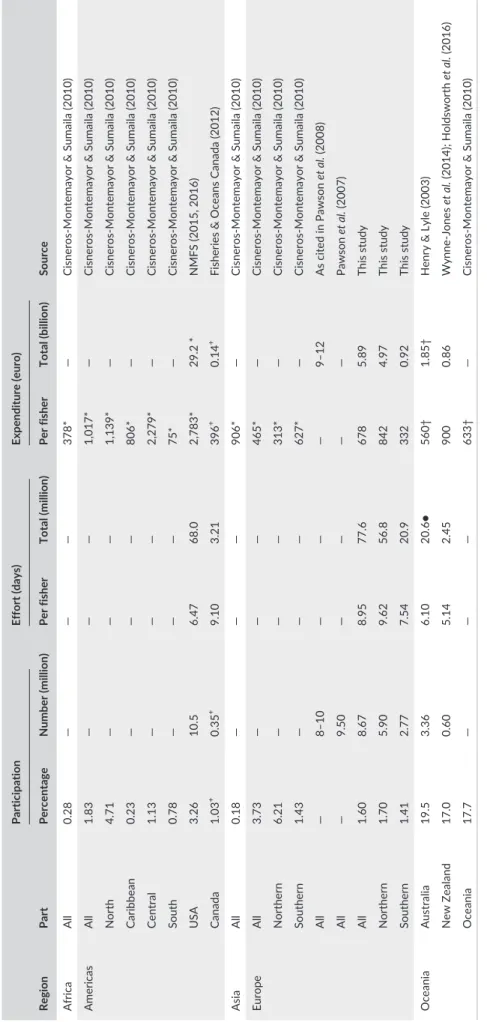
European regional comparisons were possible with angling (European Anglers Alliance as cited in Pawson et al. (2008)) and sea fishing (Pawson et al., 2007) with similar estimates of numbers, but higher expenditure than estimated in this study (Table 5). Direct comparison at a European level with a global analysis of participation and expenditure in MRF (Cisneros- Montemayor & Sumaila, 2010) suggested a higher participa-tion rate of 3.7% which was driven by much higher participation rates in northern Europe (6.21%), but a lower per fisher spend of €465 than this study. There was also a different pattern in expenditure, with a higher spend in southern than northern Europe (Table 5). Comparison with other regions of the world showed that participation rates were highest in Australia (19.5%), followed by the United States (3.26%), Africa (0.28%) and Asia (0.18%) (Table 5). Days fished per recreational sea fisher were generally similar across all regions, but estimates were only present for the United States (6.5), Canada (9.1), Australia (6.1) and New Zealand (5.1) (Table 5). Previous estimates of average an-nual expenditure by recreational sea fishers for Oceania and Europe were similar to this study, and were generally much higher than Africa and Asia, with the United States and Central America having a much greater expenditure than other regions (Table 5).
3.3 | Removals by MRF and comparisons with
commercial fisheries
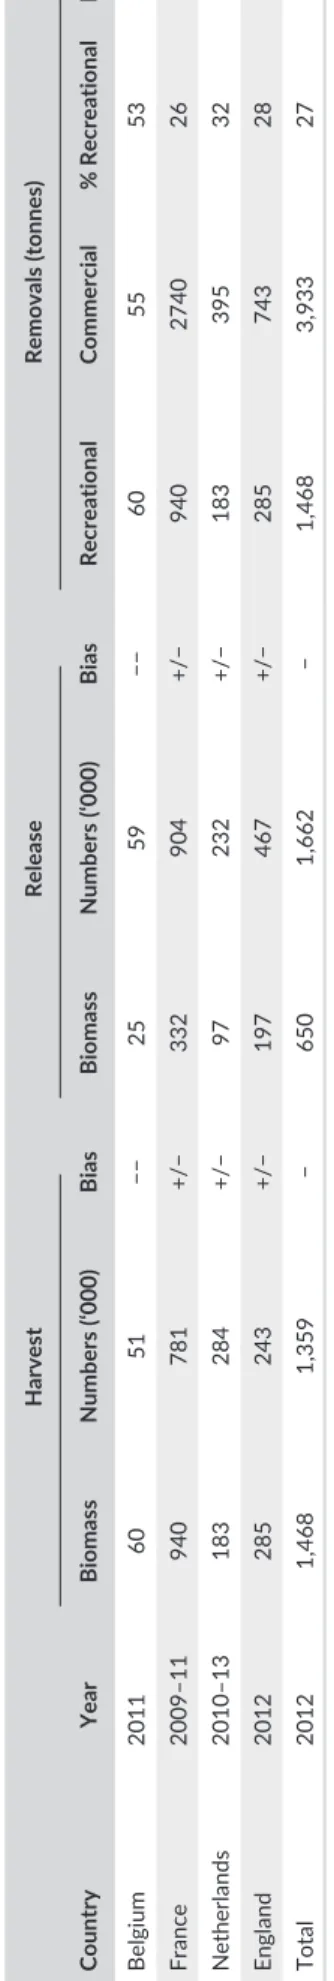
MRF removals accounted for a significant component of the total remov- als (recreational and commercial) for both western Baltic cod (ICES sub-divisions 22–24; Figure 1) and northern European sea bass stock (ICES areas IVb- c and VIIa, d–h; Figure 1). The total commercial and recrea-tional landings of western Baltic cod by Germany, Denmark, and Sweden were 17,306 t, of which, 27% was estimated to be from MRF (Table 6). For western Baltic cod, Germany had the highest proportion of total cod removals by recreational fishers (52%), and Sweden the lowest (9%). Release proportions (based on released fish in numbers) ranged between 32% and 48% of the total recreational catch depending on country (over-all release proportion 35%). For European sea bass, recreational fishing was estimated to be responsible for 27% of the total removals of 5,401 t in 2012 for countries where survey estimates were available (Table 7). F I G U R E 2 Estimated number of recreational sea fishers and the proportion of population that had been sea fishing in the last 12 months. Cross- hatching indicates the country used to extrapolate where no data existed. France and Spain were divided between the Atlantic and the Mediterranean region which is indicated by the dividing line (see Methods and Supporting Information for details)The proportion varied between countries, with the highest proportion of recreational removals in Belgium (53%), reflecting the low commercial catch for that country (Table 7). High release proportions (based on re-leased fish in numbers) were observed ranging from 44% to 66% (overall release proportion 55%). Overall, the assessments of bias suggested that the recreational cod and sea bass harvest, release and removal estimates were small underestimates.
4 | DISCUSSION
4.1 | Robustness of estimates of numbers,
participation rate, effort and expenditure
This study provides for the first time a robust synthesis of survey data across Europe selected by in- country experts, to characterize the
T A B L E 3 Numbers of recreational sea fishers, days fished, and expenditure (presented in constant 2015 prices) by countries in Europe.
Where data were not available, data have been imputed from the % fishers (numbers) or total days fished (effort) and corrected for population size
Region Country
Participation Effort (days) Expenditure (€)
% fishers
No fishers
(thousand) Bias Per fisher
Total fished
(thousand) Bias Per fisher
Total spend (million) Bias Atlantic Belgium 0.22■ 24 −−− 1.05■ 26 −−− 1,372 33■ − Denmark 6.90■ 386 +/− 6.15■ 2,370 +/− 595 230■ + Estonia 1.48■ 20 − 37.30♦ 727♦ +++ 276 5 + Finland 5.50■ 300 +/− 10.70 3,200 +/− 350♦ 105♦ −− France 2.06■ 791 +/− 6.79■ 5,376 +/− 595♦ 471♦ +/− Germany 0.22■ 174 +/− 7.84 1,365 +/− 677 118■ +/− Iceland 31.50 103 +/− 11.50♦ 1,180♦ − 586♦ 60♦ + Ireland 2.13■ 77 +/− 8.28 634 +/− 1,654 127 +/− Latvia 2.04■ 41 −−− 37.30 34 +++ 243♦ 10♦ + Lithuania 2.04♦ 60♦ −−− 37.30♦ 2,244♦ +++ 277♦ 17♦ + Netherlands 3.20 504■ +/− 3.60 1,823 +/− 284 143■ −− Norway 33.00■ 1,285■● −− 11.50■● 14,779■● − 899♦ 1,155♦● + Poland 0.24♦ 82♦ +/− 1.74■ 143 −− 257♦ 21♦ + Portugal 1.67 175 − 36.83 6,431 + 796■ 139■ − Spain 0.67■ 165 − 29.64 4,889 − 729 120■ − Sweden 5.74■ 566■ −− 7.90 4,471 −− 399■ 225■ −− UK 1.79 1,150 +/− 6.15■ 7,074 +/− 1,732 1,991 +/− Total 1.70 5,902 NA 9.62 56,765 NA 842 4,971 NA Mediterranean Albania 2.70♦ 78♦ −−− 6.00♦ 469♦ −− 104♦ 8♦ −− Bulgaria 2.70♦ 196♦ −−− 6.00♦ 1,174♦ −− 163♦ 32♦ −− Croatia 2.70♦ 115♦ −−− 6.00♦ 688♦ −− 191♦ 22♦ −− Cyprus 2.70♦ 23♦ −−− 6.00♦ 139♦ −− 281♦ 7♦ −− France 2.06■ 528 +/− 6.79■ 3,584 +/− 595♦ 314♦ +/− Greece 2.70 300 −−− 6.79♦ 2,038♦ +/− 236♦ 71♦ −− Italy 1.32■ 800 −− 6.00 4,800■ −− 324 259 −− Malta 2.70♦ 12♦ −−− 6.00♦ 69♦ −− 303♦ 3♦ −− Montenegro 2.70♦ 17♦ −−− 6.00♦ 101♦ −− 137♦ 2♦ −− Romania 2.70♦ 539♦ −−− 6.00♦ 3,231♦ −− 180♦ 97♦ −− Slovenia 1.32♦ 27♦ −− 6.00♦ 163♦ −− 271♦ 7♦ −− Spain 0.61■ 133 −− 33.00 4,399 −− 729♦ 97♦ − Total 1.41 2,767 NA 7.54 20,855 NA 332 920 NA All Total 1.60 8,669 NA 8.95 77,619 NA 680 5,891 NA Indicative levels of bias are shown using a semi- quantitative scale ranging from +++ (high overestimate) to −−− (high underestimate). ♦represents an ex-trapolation; ■indicates that figures are calculated using survey data; ●based on the Norwegian population between 16 and 79 years in 2014; NA indicates not applicable as this was assessed using semi- quantitative approach; estimates for the Atlantic and Mediterranean were derived using the split of sea fishing effort for France (full details in Supporting Information).
numbers, participation rates, fishing effort and expenditure by MRF. The data used to represent the most comprehensive compilation of surveys undertaken, to date, were supported by in- depth knowledge of the strengths and shortcomings of individual studies, and included extrapolation to countries without data (see Table 2 and Supporting Information). Extrapolation assumptions were agreed by a group of over 50 experts in MRF as being appropriate and valid. For these reasons, alongside recent improvements in the extent and quality of surveys, and the explicit assessment of potential biases, this study represents more defensible estimates for Europe than previous as-sessments (e.g. Cisneros- Montemayor & Sumaila, 2010; Pawson et al., 2007, 2008).
The uncertainty in the estimates of participation, effort and ex-penditure arises from two sources: measurement error (precision) and biases (issues with design and implementation of each survey and methods used for extrapolation). Uncertainty could be esti-mated by combining the standard errors of the individual surveys or through the use of bootstrapping. However, the standard error was not reported for many individual country surveys, meaning that imputation of many errors alongside numerous assumptions would be needed to derive estimates of uncertainty. In addition, precision is likely to be much less important than bias, as it is the outcome of the levels of sampling and can be improved simply by increas-ing sampling effort in each country. Implementing either analytical or bootstrap approaches would require a best estimate of bias, the range of uncertainty in each country with survey estimates and an error distribution for each extrapolation. Hence, despite the ease of implementing either analytical approaches combing errors or boot-strapping, it would give a false indication of the level of precision and our knowledge of the form and magnitude of the uncertainty. National experts were able to provide a robust assessment of the direction and magnitude of bias, where there were clear causes (e.g. incomplete coverage, recall bias). As a result, the most appropriate approach with the data available was to separate precision and bias,
and focus on bias using a semi- quantitative method as it has the largest impact on the uncertainty. Hence, potential biases and the impact of bias on the robustness of the estimates are discussed in more detail in the rest of this section.
Different surveys incorporating specific issues regarding survey design, coverage, non- response and recall biases, and variability in data specifications have been included in this synthesis. For example, some surveys have issues with coverage of gears, fishing modes, or demographic groups, or recall periods, and most have not accounted for non- response (see Supporting Information for details). The target population for national surveys also varied due to issues with sam-pling children (e.g. under 16 years), but this bias was likely to be trivial compared to other sources (e.g. under- coverage). Expenditure data represented a specific challenge as there was a lack of consistency in the range of goods and service elements included in the various surveys. Where possible, however, only expenditure was used to re-duce this issue, and in most cases, expenditure referred to trip data (e.g. transportation, accommodation, food, boat and gear rentals) and durable goods (e.g. boat, fishing tackle, fishing licences, clothing), with proportionate expenditure excluded (e.g. vehicles, second homes). The assessments of bias at a country level have been estimated by the Member State experts who run the surveys using approaches de-veloped by ICES for assessing the quality of MRF surveys (ICES, 2013, 2014, 2015b, 2017). As a result, we are confident that this approach has provided realistic assessments of magnitude and direction of bias in individual country surveys. The assessment of bias in combination with the proportion of the overall estimate based on extrapolation gave a good representation of the robustness of the estimates at a regional level. However, as effort and expenditure tended to be derived from extrapolations of recreational sea fisher numbers, there was additional uncertainty in these estimates. Imputations accounted for just 13% of the total es-timate of recreational sea fisher numbers in Europe, suggesting that this represented a relatively minor bias overall, but has the potential
Category Atlantic Mediterranean Total
Numbers of fishers 5,902,000 2,767,000 8,668,000
Proportion extrapolated 0.02 0.36 0.13
Relative Bias −0.75 −2.08 −1.18
Magnitude Small Large Moderate
Direction Under Under Under
Fishing effort (days) 56,765,000 20,855,000 77,619,000
Proportion extrapolated 0.07 0.39 0.16
Relative Bias −0.26 −1.46 −0.58
Magnitude Minimal Moderate Small
Direction Under Under Under
Spend on fishing (euro) 4,970,852,000 919,728,000 5,890,579,000
Proportion extrapolated 0.37 0.72 0.42
Relative Bias 0.05 −1.21 −0.15
Magnitude Negligible Moderate Negligible
Direction Over Under Under
T A B L E 4 Estimates of magnitude and direction of known sources of bias in estimates for each region. The relative bias ranged between −3 and +3, representing the situation where the estimates for all the individual countries were highly underestimated (−3) or highly overestimated (+3) in relation to the likely actual value, and were categorized as negligible <0.2; 0.2 ≤ minimal < 0.4; 0.4 ≤ small < 0.8; 0.8 ≤ moderate < 1.6; and 1.6 ≤ large
to have a larger effect in the Mediterranean region where a greater proportion (36%) of the estimate was based on imputation. The com-bination of the weighted bias assessment and imputed proportions indicated the estimates for the Atlantic were more robust than for the Mediterranean, with the results for the Atlantic and the whole of Europe considered reasonably robust and Mediterranean estimates less certain. However, the weighted bias for expenditure was mainly driven by Norway, which compensated for less robust estimates from the Mediterranean (Tables 3 and 4). The use of per capita GDP to
correct for differences in expenditure was a potential additional certainty, as the relationship between expenditure and GDP is un-clear. Previous studies indicated no clear trends with per capita GDP (Cisneros- Montemayor & Sumaila, 2010) or a decline with increasing population density and GDP (Arlinghaus et al., 2015). Here, positive but non- significant correlations between per capita GDP and expen-diture were found. However, per capita GDP was only used to correct between pairs of similar countries, so was likely to be a reasonable approach for this purpose. F I G U R E 3 Estimated annual effort of recreational sea fishers (average days fished per fisher and total effort) in Europe where cross- hatching indicates the country used to extrapolate where no data existed. France and Spain were divided between the Atlantic and the Mediterranean region which is indicated by the dividing line (see Methods and Supporting Information for details) F I G U R E 4 Estimated annual expenditure of recreational sea fishers (average expenditure per fisher and total expenditures) in Europe where cross- hatching indicates the country used to extrapolate where no data existed. France and Spain were divided between the Atlantic and the Mediterranean region which is indicated by the dividing line (see Methods and Supporting Information for details)
TABLE 5 Total numbers of recrea tional sea fish ers, participation, days fished (total and on average per fisher), and expenditure (total and on ave rage per fish er) by region Region Part Participation Effort (days) Expenditure (euro) Source Percentage Number (million) Per fisher Total (million) Per fisher Total (billion) Africa All 0.28 — — — 378* — Cisneros- Montemayor & Sumaila (2010 ) Americas All 1.83 — — — 1,017* — Cisneros- Montemayor & Sumaila (2010 ) North 4.71 — — — 1,139* — Cisneros- Montemayor & Sumaila (2010 ) Caribbean 0.23 — — — 806* — Cisneros- Montemayor & Sumaila (2010 ) Central 1.13 — — — 2,279* — Cisneros- Montemayor & Sumaila (2010 ) South 0.78 — — — 75* — Cisneros- Montemayor & Sumaila (2010 ) USA 3.26 10.5 6.47 68.0 2,783* 29.2 * NMFS (2015, 2016) Canada 1.03 + 0.35 + 9.10 3.21 396 + 0.14 + Fisheries & Oceans Canada (2012) Asia All 0.18 — — — 906* — Cisneros- Montemayor & Sumaila (2010 ) Europe All 3.73 — — — 465* — Cisneros- Montemayor & Sumaila (2010 ) Northern 6.21 — — — 313* — Cisneros- Montemayor & Sumaila (2010 ) Southern 1.43 — — — 627* — Cisneros- Montemayor & Sumaila (2010 ) All — 8–10 — — — 9–12 As cited in Pawson et al. (2008) All — 9.50 — — — — Pawson et al. (2007) All 1.60 8.67 8.95 77.6 678 5.89 This study Northern 1.70 5.90 9.62 56.8 842 4.97 This study Southern 1.41 2.77 7.54 20.9 332 0.92 This study Oceania Australia 19.5 3.36 6.10 20.6● 560† 1.85† Henry & Lyle (2003) New Zealand 17.0 0.60 5.14 2.45 900 0.86 Wynne- Jones et al. (2014); Holdswor th et al. (2016) Oceania 17.7 — — — 633† — Cisneros- Montemayor & Sumaila (2010 ) *Indicates conversion from US dollars to euro using a conversion rate of 0.89 euro; †is CPI adjusted to 2015, and converted from AU dollars to euros using a conversion rate of 0.69 euro; ●80% of total effort occurred in marine waters; and +estima ted from Fisheries & Oceans Canada (2012). All estimates were converted to 2015 equivalents using the compounded regional and country annual inflation rates from the World Bank.
TABLE 6 Most recent estimates o f biomass (to nnes) and/or numbers of western Baltic cod (ICES subdivision 22–24) harvested and released by recreational fishers, total removals (tonnes) by recreational and landings by commercial fisheries. The percentage of recreational removals is based on total removals Country Year Harvest Release Removals (tonnes) Biomass Numbers (‘000) Bias Biomass Numbers (‘000s) Bias Recreational Commercial % Recreational Bias Germany 2015 3,032 2,430 +/− 410 1,139 +/− 3,161 2,915 52 +/− Denmark 2015 1,272 978 + 220 657 + 1,297 7,361 15 + Sweden 2015 215 165 −− 51 153 −−− 221 2,351 9 −− Total * 2015 4,519 3,573 − 681 1,949 − 4,679 12,627 * 27 − Levels of bias are indicated using a semi- quantitative scale ranging from +++ (large overestimate) to −−− (large underestimate). Commercial landings are from 2015. *The comm ercial values (landings) refer to western Baltic cod only using a mixing ratio of eastern and western Baltic cod commercial catch in ICES subdivision 24 of 2.36 (ICES 2016a). Recreational cod catches in the western Baltic management area (subdivisions 22–24) are considered to consist exclusively of western Baltic cod. TABLE 7 Annual biomass (tonnes ) and number s of European sea bass (ICES areas IVb- c and VIIa,d- h) harvested and released by recreational fis hers, total rem ovals (tonnes) by recreational and landings by commercial fisheries as used by ICES for stock assessment. The percentage of recreational removals is based on total removals Country Year Harvest Release Removals (tonnes) Biomass Numbers (‘000) Bias Biomass Numbers (‘000) Bias Recreational Commercial % Recreational Bias Belgium 2011 60 51 −− 25 59 −− 60 55 53 −− France 2009–11 940 781 +/− 332 904 +/− 940 2740 26 +/− Netherlands 2010–13 183 284 +/− 97 232 +/− 183 395 32 +/− England 2012 285 243 +/− 197 467 +/− 285 743 28 +/− Total 2012 1,468 1,359 − 650 1,662 − 1,468 3,933 27 − Levels of bias are indicated using a semi- quantita tive scale ranging from +++ (large overestimate) to −−− (large underestimate). Commercial landings are as reported by vessels registered in the country shown, irrespective of country of landing.
4.2 | Participation, effort and expenditure in a
global context
The current estimate of participation in MRF in Europe (1.6%) was about half that reported previously (3.73%) (Cisneros- Montemayor & Sumaila, 2010). This difference may be explained by the present syn-thesis focussing on MRF surveys that were not available at the time of the previous estimates rather than a decline in participation (com-pare Supporting Information with Cisneros- Montemayor & Sumaila (2010)). Globally, the highest participation at a regional level in MRF occurred in Oceania (Henry & Lyle, 2003; Wynne- Jones et al., 2014), with participation rates in Australia (19.5%) and New Zealand (17.0%) about an order of magnitude greater than in Europe as a whole. Norway and Iceland had higher individual country participation rates (>30%), highlighting the variability across Europe. While the overall participation in MRF for the Americas (1.83%) (Cisneros- Montemayor & Sumaila, 2010) was comparable to Europe, the participation rate in the United States (3.26%—NMFS, 2015, 2016) was double that of Europe. The lowest participation rates globally have been estimated for Africa and Asia (Cisneros- Montemayor & Sumaila, 2010). Many factors have been shown to influence participation in MRF (e.g. pop-ulation size, population density—Edwards, 1989; Heberlein, Ericsson, & Wollscheid, 2002; Arlinghaus et al., 2015), but it is likely that com-plex interactions between factors drive differences in participation rate and vary between countries, making differences difficult to in-terpret. However, lower participation rates in Europe than Oceania and the United States could be related to past urbanization trends, as access to coast was not a significant predictor of total recreational marine and freshwater fishing rates in previous studies (Arlinghaus et al., 2015), or could also be due to increasing costs or decreasing catch rates. Despite variability in global participation rates, there was general similarity in the average days fished, ranging between 5 and 10 days per fisher each year. This suggests that the time that fishers dedicate to MRF may be driven by common elements despite the variation in environment and target species between countries and within regions.There were differences between the expenditure for the Atlantic and the Mediterranean regions with higher expenditure in the Atlantic region being contrary to the pattern reported by Cisneros- Montemayor & Sumaila (2010). Summation of the real ad-justed gross disposable income of households per capita for Atlantic and Mediterranean European countries in 2014 (Eurostat, 2016c) showed that disposable income was higher in the Atlantic, indicating that individuals were likely to have more disposable income and thus likely to spend more on recreational pursuits than in European coun-tries bordering the Mediterranean. Average expenditure per angler in the United States (NMFS, 2015, 2016) and Canada (Fisheries & Oceans Canada, 2012) was much higher than observed for Europe, mainly due to a larger proportion of durable goods expenditure (e.g. boats) and differences in the expenditure categories used (e.g. ex-penditure related to second homes and inclusion of value- added impacts—Fisheries & Oceans Canada, 2012; Brownscombe et al., 2014; NMFS, 2015). Average expenditure in Australia and New
Zealand (Henry & Lyle, 2003; Holdsworth, Rea, & Southwick, 2016) was comparable to Europe, although more recent Australian surveys suggest that average expenditure may be higher than previously es-timated (Lyle, Stark, & Tracey, 2014; West, Lyle, Matthews, Stark, & Steffe, 2012). Due to sampling challenges, recreational fisheries are undervalued and so recognizing the value is a large step in consid-ering the benefits of MRF in comparison with commercial fisheries (Lynch et al., 2016).
4.3 | Implications for monitoring and
assessment of MRF
4.3.1 | Monitoring
Regular data collection is required to improve both the understanding and the management of MRF (ICES, 2013). In some countries, analy-sis of annual recreational fisheries monitoring has thrown light on the factors influencing the social, economic and biological dynamics (e.g. Arlinghaus et al., 2015; Brownscombe et al., 2014), and have been used to support MRF development. However, these are not avail-able for MRF in many countries affecting the ability to develop and increase the impact on the economy (e.g. Europe—ICES, 2013). A lack of the expertise required to carry out these complex surveys and the generally held belief that MRF has minimal impact on fish stocks has slowed the start of data collection in many regions including Europe (Pawson et al., 2007). In Europe, differences in national fisheries research priorities impeded MRF data collection in some countries, resulting in large differences in MRF data quality, and highlight the importance of common data collection regulations such as the DCF. In fact, the requirement to carry out MRF pilot studies within 2 years of the implementation of the new EU- MAP (EU, 2016a), the need for evidence to underpin derogation from delivery of national MRF data, and the provision for fisheries managers to define additional species, where required, may lead to broader monitoring in future to fill data gaps in Europe.The frequencies of monitoring surveys vary globally, with sur-veys carried out every 5 years in Canada (Brownscombe et al., 2014; Fisheries & Oceans Canada, 2012), 2 years in the Netherlands (van der Hammen et al., 2016) and annually in the United States (NMFS, 2015). However, time series of MRF catches show large variation in catch- per- unit- effort and catches between years (Strehlow et al., 2012). These variations underline the importance to collect annual estimates of catches for inclusion in stock assessments, otherwise assumptions are required to generate times series from data from either a single year (e.g. sea bass—ICES, 2012a, 2015a) or to deal with intermittent data (ICES, 2013). MRF effort is not directly related to stock size (e.g. Strehlow et al., 2012), anglers behave in different ways (e.g. Post et al., 2002), and improvements in gear or technology can improve catch rates (e.g. Brownscombe et al., 2014) even when stocks are declining. Thus, management measures used to control recreational fisheries, for example bag limits or closed seasons may not have the desired and predicted outcome. Consequently, MRF monitoring needs to be established before problems are identified to build the evidence base
needed to address these problems and support informed decision- making. Generally, annual multispecies surveys of MRF should be car-ried out unless evidence shows that the impact is minimal and, even where this evidence exists, regular pilot studies should be performed every 5 years to assess whether the situation has changed (STECF, 2016).
The introduction of national recreational fishers registries or li-cences would facilitate MRF data collection by providing represen-tative sampling frames at low costs (Ashford, Jones, & Fegley, 2009; ICES, 2013), but may face opposition from recreational fishers and require enforcement to be a useful tool. Recreational fishers log-book smartphone applications (“apps”) could provide an alternative means of collecting data to support existing monitoring programmes and deliver broader spatial data sets in real time, but only once a good understanding of the biases in app data is available, and ap-propriate standards are developed (Venturelli, Hyder, & Skov, 2017). Recreational fishing tourism is rarely covered by national recreational fisheries surveys mainly due to non- coverage issues, particular when using off- site methods for data collection. Therefore, national pilot studies are needed to evaluate this important part of MRF. The use of on- site creel surveys and better collaboration between countries at a regional scale would help to close this important gap.
Due to the varying nature of MRF characteristics across countries (e.g. species, platforms, gears, cultural background), experience in Europe has shown that it is not sensible to develop a single design for all countries, for example in the United States (NMFS, 2016; NOAA, 2015) or Canada (Fisheries & Oceans Canada, 2012). This is because the large variation in MRF characteristics would lead to inefficiency in data collection. Instead, in Europe, the focus has been on the develop- ment of statistically sound surveys of known quality that can be com-bined to produce overall estimates (ICES, 2012b, 2013, 2014). This means that different countries develop monitoring programmes that provide robust data at a national level in the most efficient manner, rather than following a prescriptive survey design (e.g. on- site roving creel, diary panel). This is likely to provide a more robust and pragmatic approach in regions with shared stocks where cultural differences may impact on the reaction and response to different survey methods. At a global level, it is important to have studies of MRF as the impact can be very large, especially in countries where the main motivation is to catch fish for consumption (e.g. in many African countries). Ideally, statically sound, robust, annual MRF data with minimal bias and good coverage would be available for all countries. However practically, the need for data in many countries and the appropriate sampling depends on the assessment methodology, the quality of commercial data and the capability of local experts. For example, it does not make sense to collect “gold standard” MRF data where simple risk- based or trend- based stock assessment approaches are used. Hence, it is not sen-sible to prescribe a single programme for all countries. Instead, the MRF monitoring should be implemented on a case- by- case basis, un-derpinned by statically sound sampling and an understanding of the biases (ICES, 2013). The experience at a European level of the collec-tion of MRF data by multiple countries may help other countries and regions to develop sound MRF monitoring programmes.
4.3.2 | Assessment
MRF catches are routinely included in stock assessments and manage-ment in some countries (e.g. USA—Lee et al. (2017), Australia—Ryan et al. (2016)). However, this is not the case in many countries, and global fish catches have been estimated to be 14% higher if recrea-tional fishing was included alongside commercial catches (Cooke & Cowx, 2004). Hence, inclusion of MRF in total fishing mortality is important due to the widespread and popular nature meaning that catches can be large for certain species or stocks (Coleman et al., 2004; Cooke & Cowx, 2004, 2006; Ihde et al., 2011; Lewin et al., 2006; McPhee et al., 2002; Post et al., 2002).Even where MRF data exist, there are significant challenges in in-cluding MRF catches in stocks assessments due to the irregular col-lection and changing survey methodologies. Europe provides a good example of this, with MRF only included in assessments of Baltic salmon (ICES, 2015c), western Baltic cod (Eero et al., 2014; ICES, 2016b) and European sea bass (ICES, 2015a). Significant assumptions have been made to include the estimated MRF removals of European sea bass of 1,500 t for 2012 from the northern stock, with MRF mortality as-sumed to be constant to generate a time series for the assessment (ICES, 2015a). This excluded the potential post- release mortality (Ferter et al., 2013) and countries that lacked data (e.g. Wales, Scotland, Northern Ireland, Channel Islands) (ICES, 2015a). Even in the case of western Baltic cod, assumptions were necessary despite the length of the time series (Strehlow et al., 2012) and good understanding of post- release mortality (Capizzano et al., 2016; Ferter et al., 2015a,b; Weltersbach & Strehlow, 2013). In other regions, these challenges are even greater with lack of data leading to reconstructions made based on data from other fisheries (e.g. Pauly & Zeller, 2016) or unconventional sources (e.g. Belhabib et al., 2016), and little information on release rates or post- release mortality (e.g. Ferter et al., 2013). However, comparison of novel data sources with existing surveys in Europe to understand the implications of their use (Venturelli et al., 2017), alongside the further development of the value of individual data points in data- rich situations (ICES, 2016c), will help inform development of MRF monitoring across the world. MRF management measures have been implemented in Europe that will affect catches in the future (e.g. bag limits and seasonal closures for European sea bass (EU, 2015) and bag limits for western Baltic cod (EU, 2016b)). However, assumptions made (e.g. post- release mortality, times series) or exclusion of MRF catches from stock assessment may lead to bias in stock estimates, and a failure of stocks to respond as expected to management measures (Eero et al., 2014; Hyder et al., 2014; Ryan et al., 2016). Hence, robust methods that account for MRF removals in stock assessments and allocation decisions need to be developed even for data- poor assessments, alongside a better understanding of release rates and post- release mortality (Hyder et al., 2014).