MICAEL MARTINS VIEGAS
Smart Bus Stop: People counting
in a multi-view camera environment
Master Thesis in Electrical and Electronics Engineering
Specialisation in Information Technologies and Telecommunications
Developed under the orientation of:
Prof. Doutor João M. F. Rodrigues
UNIVERSIDADE DO ALGARVE
Instituto Superior de Engenharia
iii
Smart Bus Stop: People counting
in a multi-view camera environment
Declaration of Originality
I hereby declare to be the author of this original and unique work. Authors and references in use are properly cited in the text and are all listed in the included reference section.
Declaro ser o autor deste trabalho, que é original e inédito. Autores e trabalhos consultados estão devidamente citados no texto e constam da listagem de referências incluída.
_________________________________________
iv
©2019, MICAEL MARTINS VIEGAS
The University of the Algarve owns the right, in accordance with the terms of the Copyright and Related Rights Code, to archive and publicize this work, regardless of the media format used, as well as to promote it through scientific repositories and to admit its copy and distribution for educational, research and non-commercial purposes, as long as credit is given to the author and publisher.
A Universidade do Algarve reserva para si o direito, em conformidade com o disposto no Código do Direito de Autor e dos Direitos Conexos, de arquivar, reproduzir e publicar a obra, independentemente do meio utilizado, bem como de a divulgar através de repositórios científicos e de admitir a sua cópia e distribuição para fins meramente educacionais ou de investigação e não comerciais, conquanto seja dado o devido crédito ao autor e editor respetivos.
v
vii
Acknowledgements
First, I would like to thank my friends and family, for being there for me, especially to my grandmother Lilia Maria Antónia (RIP, Love you) and my mother (Love you to).
Last but not least, I would like to tank my advisor Professor Doutor João M. F. Rodrigues for all the help, knowledge, orientation and availability he provided, for me to be able to finish this thesis.
ix
Resumo
As paragens de autocarros nos dias de hoje tem de estar cada vez mais ao serviço dos utentes, esta dissertação explora as ideias fundamentais sobre o que deve ser uma paragem de autocarro inteligente, reunindo num texto os conceitos mais utilizados e as mais recentes tecnologias sobre este tópico. Os fundamentos do que é uma paragem de autocarro inteligente são explorados, bem como a arquitetura de todo o sistema, não só a paragem propriamente dita. Ao analisar a bibliografia já existentes compreende-se que a paragem de autocarro não é uma entidade totalmente independente, pois esta está dependente de informação vinda de variadíssimas fontes.
Assim sendo, a paragem de autocarro inteligente será um subsistema de um sistema muito mais complexo, composto pela própria paragem, pelo autocarro e por uma central. Em que a comunicação flui entre estes de forma a manter toda a informação do sistema atualizada em tempo real.
O autocarro recolherá informação, como quantos passageiros tem abordo e a sua localização geográfica por exemplo. A central receberá toda a informação de todos os autocarros existentes assim como de todas as paragens de autocarro existentes. Por sua vez a paragem de autocarro, recolherá dados também, tais como quantas pessoas estão na paragem, temperatura, humidade, emissões de dióxido de carbono, ruido, entre outros.
A paragem de autocarro deverá contar com um conjunto de interfaces de comunicação, tais como Bluetooth e/ou NFC, hi-fi e RFID ou Beacons, para que possam ser feitas comunicações com os utilizadores, com os autocarros e com a central. Deverá ter também ecrãs interativos que poderão ser acedidos usando gestos e/ou toque e/ou voz para que se possam efetuar as ações pretendidas. A informação não será apenas transmitida nos ecrãs interativos, será transmitida também através de som. A informação
x
contida na paragem pode ser de todo o tipo, desde as rotas, horários, posição atual do próximo autocarro, assim como o número do mesmo, publicidade animada, etc.
A paragem conta também com outras funcionalidades como conectores onde se possam carregar dispositivos móveis, aquecimento, iluminação controlada face à afluência de utilizadores e horário, um sistema de armazenamento de energia pois deverá contar com fontes de energia renováveis para que possa ser o mais autossustentável possível, e obviamente câmeras de vigilância para segurança dos utilizadores.
Sendo o principal objetivo deste trabalho, o desenvolvimento de um algoritmo capaz de contar quantas pessoas se encontram na paragem de autocarro, através do processamento das imagens vindas de várias câmaras, o foco principal é explorar as tecnologias de visão computacional e como estas podem ser utilizadas dentro do conceito da paragem de autocarro inteligente.
Uma vez que o mundo da visão computacional evoluiu muito nos últimos anos e as suas aplicações são quase ilimitadas, dai a sua implementação nas mais diversas áreas, como reconstrução de cenários, deteção de eventos, monitorização de vídeo, reconhecimento de objetos, estimativa de movimento, restauração de imagem, etc. Ao combinar os diferentes algoritmos das diferentes aplicações, podem ser criadas ferramentas mais poderosas. Assim sendo o algoritmo desenvolvido utiliza redes neuronais convulsionais para detetar todas as pessoas de uma imagem, devolvendo uma região de interesse. Essa região de interesse é processada em busca de caras e caso estas existam essa informação é guardada no perfil da pessoa. Isto é possível através da utilização de reconhecimento facial, que utiliza um algoritmo de Deep Learning (DL). Essa região de interesse também é convertida para uma escala de cinzentos e posteriormente para uma matriz, essa matriz será também guardada no perfil do utilizador. Está informação é necessária para que se possa treinar um modelo que utiliza algoritmos de aprendizagem de máquina (Support Vector Machine - SVM).
Os algoritmos de DL e SVM são necessários para que se possa fazer a identificação dos utilizadores a cada imagem e para que se possa cruzar os vários perfis vindos das várias origens, para que possa eliminar os perfis repetidos. Com isto a mesma pessoa é contada as vezes que apareça nas imagens, em função do número de câmeras existentes na paragem. Assim sendo é preciso eliminar essas repetições de forma a ter um número de pessoas correto.
Num ambiente controlado o algoritmo proposto tem uma taxa de sucesso elevada, praticamente sem falhas, mas quando testado no ambiente para o qual foi desenhado já
xi
não é bem assim, ou porque numa paragem de autocarro as pessoas estão em contante movimento ou porque ficam na frente umas das outras e não é possível visualizá-las a todas. Mesmo com muitas câmeras colocadas no local, acabam sempre por haver pontos mortos, devido à estrutura da paragem ou até mesmo devido ao meio, por exemplo árvores ou um carro mal-estacionado, etc.
Palavras chave: Paragem de autocarro inteligente; visão computacional; contar pessoas;
ambiente múltiplas câmaras; reconhecimento de objetos, monitorização de objetos, reconhecimento de padrões, reconhecimento facial
xiii
Abstract
Bus stops nowadays have to be increasingly at the user’s service, this thesis explores the fundamentals ideas of what a Smart Bus Stop should be and bring all together into one concept using today’s technologies. Although the fundamentals of a Smart Bus Stop (SBS) are explored, the primary focus here is to explore computer vision technology and how they can be used inside the Smart Bus Stop concept.
The world of computer vision has evolved a lot in recent years and its applications are almost limitless, so they have been incorporated into many different areas like scene reconstruction, event detection, video tracking, object recognition, motion estimation, image restoration, etc. When combining the different algorithms of the different applications more powerful tools can be created. This work uses a Convolutional Neural Network (CNN) based algorithm to detect people in a multi video feeds. It also counts the number of persons in the SBS, using facial recognition, using with Deep Learning algorithm, and Support Vector Machine algorithm. It is important to stress, these last two are used to keep track of the user and also to remove the repeated profiles gathered in the different video sources, since the SBS is in a multi-camera environment.
Combining these technologies was possible to count how many people were in the SBS. In laboratory the propose algorithm presents an extremely high success rate, when applied to real bus stops que success rate decreases due to blind spots for instance.
Keywords: smart bus stop; computer vision; counting people; multi-view-camera
xiv
Contents
List of Figures ... xvii
List of Tables ... xix
List of Acronyms ... xxi
1 Introduction ... xxiii
1.1 Introduction ... xxiv
1.2 Scope of the Thesis ... xxv
1.3 Objectives ... xxvi
1.4 Contents ... xxvi
2 State of the Art and Technological Background ... 1
3 SBS System Architecture ... 9
3.1 Introduction ... 10
3.2 Discussion/First Conclusion ... 11
3.3 IOE SBS Model ... 12
3.3.1 Bus and HUB Subsystems ... 14
3.3.2 Bus Stop Subsystem ... 16
4 Counting Persons ... 21
4.1 General Overview ... 22
4.2 Feed Acquisition Process ... 24
4.3 Data Gathering Process ... 26
4.4 Cross-data Process... 29
xv
4.6 Submodules ... 32
4.6.1 Execution Using a Single Source ... 33
4.6.2 Execution Using two Duplicate Sources ... 33
4.6.3 Execution Using two Different Sources ... 35
4.7 Performance Analyses ... 36
4.7.1 Training Time ... 36
4.7.2 Predicting Time ... 37
4.7.3 Confidence ... 37
4.8 Application in Real Bus Stops ... 38
5 Conclusions ... 41
5.1 Conclusions ... 42
5.2 Future Work ... 43
xvii
List of Figures
Figure 3.1 - Full system overview ... 13
Figure 3.2 – Bus Stop Overview ... 16
Figure 3.3 - Interface ... 16
Figure 3.4 - Peripherals ... 17
Figure 3.5- Tracking/Counting Users ... 18
Figure 3.6 - Atmospheric Sensors ... 19
Figure 3.7 - Renewable Energy ... 19
Figure 4.1 – MobileNet-SSD operation. ... 22
Figure 4.2 – Person and facial detection operation ... 23
Figure 4.3 - General overview from the working processes ... 23
Figure 4.4 - Feed acquisition process. ... 24
Figure 4.5 - General overview of the data gathering process ... 25
Figure 4.6 - Contained information in the profiles. ... 27
Figure 4.7 – Creating and updating profiles. ... 28
Figure 4.8 - General overview from data interpreter process ... 30
Figure 4.9 - Profiles from different sources ... 30
Figure 4.10 - First iteration result ... 31
Figure 4.11 - Remaining profiles after all iterations are done. ... 31
Figure 4.12 - Real time video processing from one source ... 33
Figure 4.13 - Real time video processing from two duplicate sources (before SVM model is trained). ... 34
Figure 4.14 - Real time video processing from two duplicate sources (after SVM model is trained). ... 34
xviii
Figure 4.15 - Real time video processing from two sources (before SVM model is trained) ... 35 Figure 4.16 - Real time video processing from two sources (after SVM model is trained). ... 35 Figure 4.17 - Real time video processing from a real bus stop (before SVM model is trained) ... 38 Figure 4.18 - Real time video processing from a real bus stop (after SVM model is trained) ... 39
xix
List of Tables
Table 4.1 - MobileNet-SSD and Facial Recognition performance ... 32
Table 4.2 - SVM training time ... 36
Table 4.3 - SVM prediction time ... 37
xxi
List of Acronyms
SBS Smart Bus Stop
DL Deep Learning
IoE Internet of Everything LCD Liquid Crystal Display GPS Global Positioning System RFID Radio-Frequency Identification LED Light Emitting Diode
HOG Histograms Oriented Gradient SURF Speeded Up Robust Feature SIFT Scale-Invariant Feature Transform KNN K-Nearest Neighbors
MLA Machine Learning Algorithms SVM Support Vector Machine CNN Convolutional Neural Network
ITC Information and Communication Technology RoI Regions of Interest
xxiii
1 Introduction
A
BSTRACTIntelligent systems are spreading more and more across all sorts of areas with the purpose of optimization. This optimization can be of economic, social or environmental origin. The objective of this thesis is to try to take the next step forward in the area of “smart bus stops”. This chapter introduces the theme and objectives addressed in this thesis.
xxiv
1.1 I
NTRODUCTIONThe first definition that we always look nowadays is the Wikipedia definition, there Smart City is defined as “urban development vision to integrate information and communication technology (ICT) and Internet of Things (IoT) technology in a secure fashion to manage a city’s assets. These assets include local departments; information systems, schools, libraries, transportation systems, hospitals, power plants, water supply networks, waste management, law enforcement, and other community service…”. Similar definition can be found in the literature or in different publications, as the Portuguese Journal Smart Cities (SmartCities, 2017).
Cities are now embracing the IoT through various applications like sensors placed in garbage containers. Here we are focusing in transportation systems, namely smart bus stops/shelters that can be integrated in a smart city. For instance, Barcelona features smart bus stops (SBS) with solar powered displays that show waiting times and available seats as well as tourist information; intelligent illumination with sensors that detect movement, climate, pollution and noise; and intelligent parking, informing drivers of available seats in real time. Also, thanks to the various gadgets and facilities currently available, persons with disabilities can move around very independently. To further enhance their independence, a smart bus stop should help visually impaired, seniors and individuals with physical disabilities flag down busses without any trouble.
There exists several projects in SBS, for instance, the Mobi+ project (Zhou, Hou, Zuo, & Li, 2012) which consists of three subsystems: a wireless communication subsystem, which provides the data exchange and network connection services between buses and stations in the complex urban environments; the bus subsystem, which provides the disabled, wheelchair and blind (DWB) class detection and bus arrival notification services; and the station subsystem, which implements the urban environmental surveillance and bus auxiliary access services. Kalbani et al. (2015) proposed system consists of two detection subsystems; one on the buses and the other on the bus stations, database system and a website. In the bus detection subsystem, the nearby stations will be easily detected and then announced through a voice message inside the bus. Moreover, any existing blind person in the surrounding area of the station will be detected by the bus subsystem to alert the bus driver about the number of blind persons. In the bus station subsystem, the coming buses will be detected and then announced in the station in order to alert the blind people. Madala et al. (2017) uses also RFID technology that aims to
xxv
ease the traveling and movement of blind people. The proposed system has two main parts. First part is blind people recognition. Another part is communication between a bus and bus station. Other examples exist, like Wen et al. (2004), Fitzpatrick et al. (1997), Hara et al. (2015), SmartShelter, (2017), see also Sec. 2.
A different subject is how better visualize the information of the bus lines, this subject was addressed in for instance in HoosWhere (2017), Krause et al. (2012) or Zhang et al. (2017). Skog et al. (2003) explores how information visualization can be employed to make such dynamic data more useful and appealing. However, visualizations intended for non-desktop spaces will have to both provide valuable information and present an attractive addition to the environment - they must strike a balance between aesthetical appeal and usefulness. The authors designed a real-time visualization of bus departure times and deployed it in a public space, with about 300 potential users. Nevertheless, the current tendency points out to user interface should adapt to each different user and could/should be built from “cards” philosophy (Rodrigues et al., 2017).
In the present work we intend to study and define an integrate ICT architecture for a smart bus stops that can be incorporated in a smart city, providing information to the passengers, public transport operators and community organizations, greatly contributing to improvement the passenger experience, providing concentrated community services information. In addition, we intend to create a prove-of-concept for some of technologic modules that integrate the bus stop, that in this case is to count how many people are in the SBS using a static multi camera environment.
1.2 S
COPE OF THET
HESISThis thesis is integrated in the project ACCES4ALL: Acessibilidade para Todos no Turismo, 02/SAICT/2016 - Sistema de Apoio à Investigação Científica e Tecnológica (SAICT), Portugal2020, CRESC2020, FEDER. The project started in Oct. 2017 and will finished in March. 2019.
xxvi
1.3 O
BJECTIVESAfter reviewing the above information, it became clear that an SBS is a complex ecosystem, therefore this thesis will have as main goals:
1. Analyze the smart bus stop literature, propose the features of a ICT architecture of an SBS;
2. Propose an integrated SBS that:
a. presents solutions to communicate between the user mobile phone and the bus stop, in a way to know the user accessibility necessities: visual, physical, auditory, as well as the bus he wants to use;
b. uses voice and/or by visual information to communicate between the bus stop and users;
c. detects if there are users in the bus stop. If there are no users waiting for the bus, the bus can skip the bus stop, if intended.
d. monitors public safety (security camera for public safety);
e. allows interaction, between the user and the visual information displayed in the bus stop. This can be achieved using gestures (and 3D sensors) or by the user movements (near/far; exist user/no user; arm movements) and cameras;
f. counts how many people are waiting in the bus stop using the cameras in (d).
3. Propose and implement a prototype for counting how many people are waiting in the bus stop using the cameras mentioned above.
1.4 C
ONTENTSIn the present Chapter was introduced the subject of the thesis and the respective goals, Chapter 2 presents the SBS state of the art and the technological background. Chapter 3 presents a proposed model for an IoE Smart Bus Stop. Chapter 4 presents the concept behind an algorithm that can count how many people are in an SBS and all the tests and results made to the algorithm itself. Finally, chapter 5 presents the conclusion and future work.
1
2 State of the Art and
Technological Background
A
BSTRACTLike any other technological ecosystem, smart bus stops have been changing and improving over time. It’s important to understand the state of the art behind it, so that the future concept, the next step in this ecosystem, can be develop with the best practices.
2
Agostini et al. (2016) presented Smart Station, a bus stop adapted to the visual impairment people, where the notification at bus stops is based on pervasive computing, using microprocessors and speakers. Qin, Xing, Chen, Wang, & Qin (2008) presented the design of an intelligent bus monitoring and station-reporting system. It consists of two parts: hardware and software. Hardware part puts forward in detail the design of the main circuit unit and introduces the application of GPRS module MC55, it uses S3C44B0 to control ISD25120 voice chip and LCD module after receiving data sent by GPS module. Meanwhile the location information will be sent to the control center by using GPRS module. Software part includes the flow chart of station reporting and network access. It also introduces the software design of the monitoring center. AudioTransantiago (Sánchez & Oyarzún, 2011) is a handheld application that allows users to plan trips, including bus trips and provide contextual information during the journey through the use of synthesized voices.
There are systems that helps bus detection for blind people using RFID (Al Kalbani, Suwailam, Al Yafai, Al Abri, & Awadalla, 2015). The proposed system consists of two detection subsystems; one on the buses and the other on the bus stations, database system and a website. In the bus detection subsystem, the nearby stations will be easily detected and then announced through a voice message inside the bus. Moreover, any existing blind person in the surrounding area of the station will be detected by the bus subsystem to alert the bus driver about the number of blind persons. In the bus station subsystem, the coming buses will be detected and then announced in the station to alert the blind people. Madala, Polavarapu, & Bharathi (2017) also uses RFID technology that aims to ease the traveling and movement of blind people. The proposed system has two main parts. First part is blind people recognition. Another part is communication between a bus and bus station. As already mentioned in the introduction, other examples exist, like Wen et al. (2004), Fitzpatrick et al. (1997), Hara et al. (2015), SmartShelter, (2017). The Smart Shelter (Yu, 2017) is an innovative connected bus shelter delivered through the industry collaboration of Downer, Alcatel-Lucent, Solta, Deisgnbrand, Samsung, and Schneider-Electric. The consortium came together through the ng Connect program and have successfully designed and built a full-sized connected bus shelter in the Chorus Innovation Lab in Auckland, New Zealand. The shelter integrates Nokia IoT (maps, etc.) with surveillance cameras, Wi-Fi, traffic pedestrians monitoring, sensors for noise and pollution, energy monitoring control and interactive screens.
3
Accessible Bus Stop Pilot Project (TransLink, 2017) intends to make bus stops universally accessible, including people with different abilities and special needs: The bus stop has (a) wayfinding signage, provides customers with information in both visual and tactile media, including bus arrivals and departures, as well as neighborhood points of interest within walking distance. (b) Tactile information panels have raised and Braille lettering for the visually impaired so they can confirm they're at the right bus stop, and to call TransLink to determine scheduled bus arrival times. (c) Tactile surface indicators on the sidewalk enable people with visual impairments to locate bus stops. Finally, (e) benches, provide convenient and comfortable seating for passengers who can't stand while waiting. Seth (2017) presents a bus stop that can flag the approximation of a bus using RFID communication between the bus and the stop, as well as inform for the bus stop user, using big bright led displays with the bus number. In addition, the bus stop was also “flag button” at the user (wheelchairs) to select the bus the user what to take. Finally, sound information is available to the users.
The MIT Mobile Experience Lab presents the Interactive Bus Stop (M.E.L., 2017), it can respond to the features of its location in multiple ways in multiple time frames. The Interactive Bus Stop senses its environment, provides real-time transportation information, as well as a social networking platform for the local community through a touch-sensitive screen. A low-resolution LED-ticker provides real-time traffic information, and a forum-like application for user-generated content. In this way, the Interactive Bus Stop is designed to foster communication in its neighborhood.
In Manzil (2017) are presented several (“futuristic”) designs of sustainable bus stops, in Young (2017a) presents San Francisco's bus stop that allows to play video games using the bus stop infrastructure. Also, Young (2017b) presents some examples of interactive bus stops, i.e., bus stops that have interactive billboards. There are several examples of bus stops that integrates and display the information of arrival, departure and forecast waiting times of the bus (within informative kiosks integrated in the bus stop, this includes also information about schedules, itineraries and tariffs), see e.g., AIT (AIT, 2017). New technologies using IoT (Internet-of-Things) are now being used, one example, Fernandes (2017) is the association between the urban transports of Braga, Portugal (TUB) and IBM Portugal. The association focus (between other features) the (a) geolocation that integrates the bus with IBM Intelligent Operations Center (IOC) and IBM IoT, (b) vehicle telemetry, (c) wireless access point, (d) mobile App and (e) Environmental Sensors. In the last point, IBM will use IoT sensors to measure
4
environmental data on and off the bus (CO2, noise, temperature, and humidity) to inform the population and provide city leaders with real-time data to improve decision making in the public area.
GeoMobile (GeoMobile, 2017) presents a smart station interaction via Bluetooth with the incoming bus and announces its line number and its destination. At the press of a button, the departure monitor informs about the upcoming departures by means of voice output. The bus stop is designed as a help for blind or visually impaired people and sends a continuous pilot tone. But also, those, who cannot read or who have difficulties with the timetable, get quick help. For the hearing impaired, the speech output feeds an induction loop. ViiBus, Visually Impaired Intelligent BUs Stop (ViiBus, 2017), presents a solution for when the user/blind arrives to the bus stop, he/she selects the bus line using a braille information board, the bus stop by uses voice information give the feedback when the bus arrives. When arriving the bus, also sound clues are given to the user to facilitate the bus access.
A smart bus stop from Ericsson (Ericsson, 2017) is presented in Digit. The bus stop is working in several cities, as for instance Barcelona. It has air quality monitoring, Wi-Fi, camera monitoring for passenger’s safety, it counts how many people is waiting for the bus. The bus stop also communicates to the central stating, to know when the user bus arrives, giving the feedback in the mobile phone. Yu (2017) shows new bus shelters from Montreal, Canada. These stops allow gesture commands, it displays information such as time of day, next bus arrival, and a map. The interaction with the screen is a giant cursor is moved by making gestures with your arm (the user must be at the proper distance and mustn’t be surrounded by your friends). It also allows interactive ads.
Wallban (2017) presents in Barcelona (Spain) the digital bus stop, it displays digital advertising and real time bus schedules it also offers tourist information, USB charging sockets and acts as a free Wi-Fi base station. The bus stops themselves are connected to the city’s fiber network that runs most of the backhaul and connects many of the fixed devices. In Onyx (2017) it is presented a network of iBeacons located in buses and trolleybuses circulating in Bucharest, Romania. It was expected the solution will use an infrastructure of 500 iBeacons and will guide people with visual disabilities to independently use the public transport network in the Romanian capital area.
Smartquesina (SmartCitiesLab, 2017) has digital outdoor advertising, content management according to the type of audience, wireless content load, regulated light
5
intensity, Wi-Fi connection and direct purchase via NFC. Garreffa (2017) presents an interactive screen for advertising into two busy bus stops in Taipei, Taiwan.
A different subject is how better visualize the information of the bus lines, Skog, Ljungblad, & Holmquist (2003) explores how information visualization can be employed to make such dynamic data more useful and appealing. However, visualizations intended for non-desktop spaces will have to both provide valuable information and present an attractive addition to the environment – they must strike a balance between aesthetical appeal and usefulness. The authors designed a real-time visualization of bus departure times and deployed it in a public space, with about 300 potential users. The visualization subject was also addressed for instance in Krause (2012), HoosWhere (2017) or Zhang (2017). Nevertheless, the current tendency points out to user interface should adapt to each different user and could(/should) be built from “cards” philosophy (Rodrigues, et al., 2017).
In terms of prototype the focus in this thesis is to count how many people are in a SBS, so it is important to explain, even briefly, the basic concepts applied. To implement this, we use Computer Vision, which is an interdisciplinary field that deals with how computers can be made for gaining understanding from digital images or videos and it seeks to automate tasks that the human visual system can do (Ballard & Brown, 1982; Vandoni, 1996; Sonka, Hlavac, & Boyle, 2008.
Computer Vision tasks include methods for acquiring, processing, analyzing and understanding digital images. Understanding in this context means the transformation of visual images into descriptions of the world that can interface with other thought processes and elicit appropriate action. This image understanding can be seen as the disentangling of symbolic information from image data using models constructed with the aid of geometry, physics, statistics, and learning theory (Forsyth & Ponce, 2003). As a scientific discipline, Computer Vision is concerned with the theory behind artificial systems that extract information from images. The image data can take many forms, such as video sequences, views from multiple cameras, or multi-dimensional data from a medical scanner.
Sub-domains of computer vision include scene reconstruction, event detection, video tracking, object recognition, 3D pose estimation, learning, indexing, motion estimation, and image restoration (Morris, 2004).
6
Object detection in images and videos has received a lot of attention in the computer vision and pattern recognition communities, not just because it is a challenging problem but also because its many potential applications (Dalal, 2006).
Many techniques were developed over the years, but they are divided mainly into two main families, the “traditional” that don’t use Machine Learning like Histograms of Oriented Gradients (HOG), Scale-Invariant Feature Transform (SIFT), Speeded Up Robust Feature (SURF) and the ones that use Machine Learning like Convolutional Neural Network (CNN), Support Vector Machine (SVM), K-Nearest Neighbors (KNN), Linear Regression (Mallick, 2016; Ray, 2017). In interesting note is that in 2015 multiple Convolutional Neural Network (CNN) based algorithms surpassed the human recognition rate of 95%.
An image recognition algorithm and image classification algorithm take an image as his input and gives as output what the image contains as a class label like cat, dog, bird, etc. Basic machine learning models do become progressively better at whatever their function is, but they still need some guidance, but with a Deep Learning models, the algorithms can determine on their own if a prediction is accurate or not. In practical terms, deep learning is just a subset of machine learning, technically is Machine Learning, functions in a similar way, but its capabilities are different. (Zendesk, 2017).
In the case of deep learning algorithms, they must learn (being trained) the differences between each class. To do so feeding the algorithm with thousands of positive and negative images (Mallick, 2016), being positive images the ones that contains the class that the algorithm is being trained and negatives images the ones that don’t contain the class. Doing so the algorithm learns the specific class, there is no need to say that this algorithm can only understand objects/classes it has learned (Mallick, 2016).
When combining multiple of these algorithms, much harder tasks can be achieved like tracking and identity preservation of an object after his detection in a single camera or in multiple cameras environments.
NEC Laboratories America (Yang & Yu, 2011) recognizes clothing in real-time surveillance videos by taking advantage of face detection and tracking to locate human figures, then an efficient clothing segmentation method utilizing Voronoi is used to select seeds for region growing. Clothing is compared combining color histograms and three different texture descriptors. This is appealing to emerging applications such as intelligent customer profile analysis and computer-aided fashion design.
7
CVLab (2017) tracks multiple people in a multi-camera environment with a people detection algorithm, Probability Occupancy Map (POM), and a deep learning based improvement, that uses a generative model and Bayesian reasoning to estimate people's positions on each frame. Combining these estimates with a global optimization method known as K-Shortest Path (KSP) to generate trajectories in real-time. This can be used to track player in the game field like basketball or football for instance.
Syracuse University (Zheng, Chen, Velipasalar, & Tang, 2016) proposed Person Detection and Re-identification Across Multiple Images and Videos Obtained via Crowdsourcing since Person re-identification is indispensable for consistent labeling across different camera views. The approach was combining R-CNN based person detection with the GPU implementation of color histogram and SURF based re-identification.
Northeastern University (Liu, Camps, & Sznaier, 2017) proposed a pipeline for multitarget visual tracking under multi-camera system. For multi-camera system tracking problem, efficient data association across cameras, and at the same time, across frames becomes more important than single-camera system tracking. The model adopts Generalized Maximum Multi Clique optimization problem as core algorithm to take both across frame and across camera data correlation into account all together. For appearance feature, Local Maximal Occurrence Representation (LOMO) feature extraction algorithm for re-identification is conducted. When it comes to capturing the dynamic information, Hankel matrix is applied for each target along a rank estimation using Iterative Hankel Total Least Squares (IHTLS) algorithm.
Several algorithms have been applied according with the purpose of the task. Some comparative studies have been made for instance in facial recognition for security reasons (Kortli, Jridi, Al Falou, & Atri, 2018), where the objective was to demonstrate the effectiveness and feasibility of the best methods for face recognition in terms of design, implementation, and application.
All the above information will be complemented in Chapter 4, with specific methods implemented. Next chapter presents a Smart Bus Stop architecture and all the technology and ideas that were created over the time as new ones.
9
3 SBS System Architecture
A
BSTRACTMany ideas have come up over the years about SBS, some better and some worse, some kept, and others were being discarded. But step by step the concept of what is an SBS has been evolving. The idea is to understand where the concept is in order to advance it further.
10
3.1 I
NTRODUCTIONThe Internet of Everything (IoE) is the networked connection of people, data, processes and things (Cisco, 2017), i.e., it brings together people, process, data and things to make networked connections more relevant and valuable, turning information into actions that create new capabilities, richer experiences and unprecedented economic opportunity for businesses, individuals and countries (Cisco, 2017). The IoE is made up of many technologies including the Internet of Things. The typical definition of Smart City is an “urban development vision to integrate Information and Communication Technology and IoT technology in a secure way to manage a city’s assets. These assets include local departments’ information systems, schools, libraries, transportation systems, hospitals, power plants, water supply networks, and other community services". This definition or similar ones can be found in the literature (Ahvenniemi, Huovila, Pinto-Seppä, & Airaksinen, 2017) (Caragliu, Del Bo, & Nijkamp, 2011). The present/future step is to extend the present IoT to IoE technologies, not only integrating/connecting the things, but integrating the things with each individual, where each thing has a different behavior in function of the individual/person or group of persons that is interacting with it.
As already briefly mentioned, ACCES4ALL - Accessibility for All in Tourism, is a Portuguese project that aims to study the “accessibility for all" has a quality attribute in sustainable mobility, senior tourism, social inclusion and territorial marketing. It considers the needs of the elderly and other people with reduced mobility (e.g. wheelchair people, blind, deaf and tourists with trolleys). One of the project focuses is to study an intelligent and sustainable bus stop, in the present case designed for Faro airport, in a collaborative process.
Here, we are focusing IoE eco-friendly, accessible and smart bus stops/shelters that can be integrated in a smart city and have on it bases IoE values and technology. For instance, Barcelona features smart bus stops with solar powered displays that show waiting times and available seats as well as tourist information; intelligent illumination with sensors that detect movement, climate, pollution and noise; and intelligent parking, informing drivers of available seats in real time.
But, what makes a smart bus stops so important, e.g., the Zicla Blog (Zicla, 2018) points out four main features and advantages of smart bus stops: (a) enhanced communication, (b) creativity, (c) real time responses to changes in bus timetables and
11
(d) attractive and eco-friendly designs. We can point out one more, (e) the adaptation of the SBS to each (singular) individual (promoting inclusion). Also, thanks to the various gadgets and facilities currently available, persons with disabilities can move around very independently. To further enhance their independence, a SBS should help visually impaired, seniors (Cunha, Trigueiros, & Lemos, 2014) and individuals with physical disabilities to flag up buses without any trouble.
The main contribution of our work is this Chapter is the proposal for an IoE Smart Bus Stop, that integrates all the features from the existing bus stops, as well as integrating intelligent features that allow the bus stop to adapt itself to each different user. In order to do so we will be counting with the cameras in the bus stop and computer vision algorithms, so we can identify the type of person and we will also be counting how many people are in the bus stop.
3.2 D
ISCUSSION/F
IRSTC
ONCLUSIONAfter analyzing the literature, a Smart Bus Stop (Rodrigues et al., 2018) of today was generically the following features:
1. Communications:
a. Bluetooth, "RFID", or Wi-Fi communication between the bus stop and the bus, to know e.g., the bus number and how long a bus takes to arrive to the bus stop;
b. Wi-Fi, NFC (or Bluetooth) communication with the user mobile to inform e.g., buses routes;
c. RFID or Beacons to help/guide the user to the bus information board, and or to the bus stop.
2. Information’s:
a. Show at the bus stop the information about the bus that is arriving (big screen/led displays; big numbers/letters; chromatic contrast); show information of the time the remaining buses will take; show bus routes in a map;
b. The same as above, but for the mobile user application;
c. Screen for information and/or publicity with interaction: gestures, voice, touch, etc. Animated publicity Billboards;
12
d. Information/selection available in Braille. Information/selection available at wheelchair height. Sound information (pilot sound) to guide blind users to the bus.
3. Others:
a. Count how many people are waiting at the bus stop; b. Security camera for public safety;
c. Change light condition in function of the users;
d. Sensors for noise, pollution, traffic, wind and energy monitoring control;
e. Energy save solar panels; f. Heated shelters/bus stops; g. USB charging sockets.
As mentioned, in the present work we intend to study and define an integrated project (ICT) architecture for a smart bus stop that can be incorporated in a smart city, based on IoE values, providing information to the passengers, public transport operators and community organizations, greatly contributing to improvement the passenger experience, providing concentrated community services information. In the following Sections we present our proposed model.
3.3 IOE
SBS
M
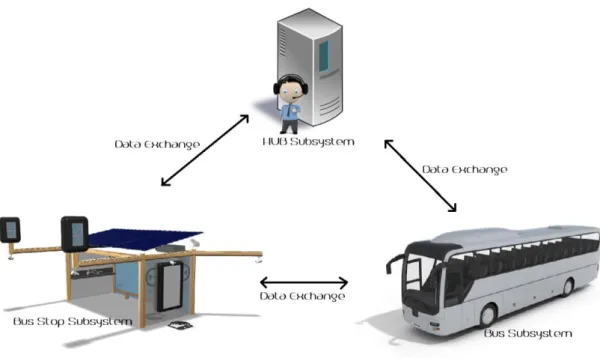
ODELTo define the ICT architecture behind the system, it’s necessary to understand how many subsystems are needed and how they could interact (Zhou, Hou, Zuo, & Li, 2012). Although the focus here is the smart bus stop, the bus stop itself is only one of the subsystems. The other two are the HUB subsystem and the bus subsystem.
In the Sec. 3.3.1 the bus and HUB subsystem will be briefly discussed, once they are out the focus of this study. The SBS subsystem will be discussed in detail in Sec. 3.3.2. It is important to stress that the design of the SBS is also out of our focus. In short, our IoE SBS Model has the following main modules:
13
a. Select/adjust automatically different type of communication systems, NFC, Beacons, RFID, Bluetooth and Wi-Fi between bus stop and buses, users and the central server.
b) Information:
a. Know how long each bus takes to arrive to the stop; b. Know users’ necessities (visual, physical, auditory, etc); c. Inform the user the time for the bus arrival;
d. Help/guide the user to the SBS information board; e. Help/guide the user from the SBS to the bus door;
f. Detect if there are users at the bus stop (also using cameras); g. Allow buses to skip stops with no users for that bus;
h. Count automatically how many users are waiting for each different bus; i. Avoid/decrease bus bunching;
j. Automatic/adaptive selection of routes/buses (faster, cheapest, scenic, user restrictions, etc.) for each user;
k. Suggestion for the user to select a different bus, in function of road works, heavy traffic, etc;
l. Dashboards:
14
1. Bus stop events/statistics; 2. Environmental-, eco-features; 3. Information of noise;
4. Pollution and weather;
5. Energy monitoring and traffic control. c) Interaction: a. Touch (screen); b. Gestures (3D sensors); c. Voice commands; d. Braille. d) User Interfaces:
a. Adaptive User Interfaces (AUI) - in function of the user type, age, handicap, etc.;
b. SBS displays, information display and arrival display; c. Animated publicity, interactive billboards;
d. AUI for mobile App; e. Sound information;
f. Edutainment and gamification “display’s". e) Others: a. Energy; b. Solar panels; c. Wind turbine; d. Battery system; e. Security (cameras); f. Heated shelters; g. USB charging sockets;
h. Light change conditions in function of the number of users in the SBS; i. Weather conditions.
3.3.1 Bus and HUB Subsystems
Taking in consideration the characteristics of the SBS presented above, there will be a constant flow of information being exchanged between all bus stops and buses (see Fig.
15
3.1). The HUB will be responsible to control this exchange. The central subsystem (HUB) (Zhou, Hou, Zuo, & Li, 2012) is also responsible for storing and analyzing in real time all the incoming information’s, predicting on-the-fly where each bus should go in function of the user’s numbers and type waiting at the bus stop, traffic, constructions, etc.
The main idea is to have a full automatic (intelligent) system that can connect all the things and the persons that want to use the transportations (IoE system), by using real data and historical data from each user, bus, road, bus driver, etc., it is possible to predict each user expectation (fast, comfortable transportation, etc.) and improve user experience.
The bus subsystem is also a very important piece of the ecosystem. It will be responsible to send its exact location, to do so it must have GPS. The system will select/adjust automatically different type of communication systems, Bluetooth, Wi-Fi, 3G/4G between bus stop, buses, and central server (HUB). The bus will also have some speakers and visual information to let people know which the next stop and how much time remains until the bus arrives. On the other hand, another useful information, will be the amount of people inside the bus, how many people got inside the bus in a particular bus stop, and how many people exited in the same stop. This can be particularly useful for: (a) the company to have the perception of which are the most used routes, (b) if more buses for the same route are needed, but more important, (c) for each user, giving/negotiating the bus he/she should take, i.e., for each user waiting at the bus stop suggests different alternative buses in function of the users preferences/handicap (travel sited, wheelchair, etc.) and urgency in traveling, as well as if the bus is almost or completely full.
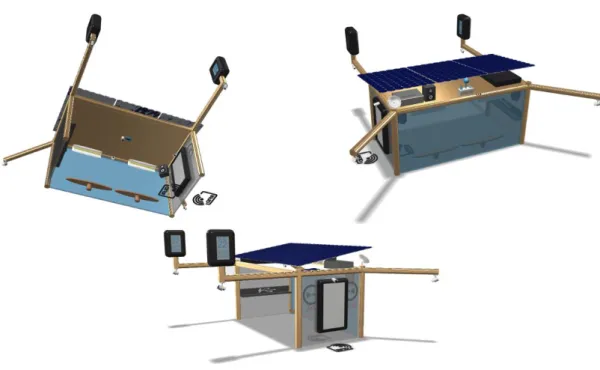
One system that can prioritize and select a specific bus for each user, will also be expected that is capable of decreasing waiting at the bus stops. The one information on how many people are exactly on the bus can be gathered through sensors, number of tickets purchased, etc. What is important is to have an accurate account of how many people are inside, how many entered and how many exited. If this cannot be guaranteed, the possible optimization of routes and user experience will be compromised. Figure 3.2 shows some views of a possible SBS.
16
3.3.2 Bus Stop Subsystem
Interaction with the bus stop can be done using touch, gesture or voice command. When the user interacts with the bus stop displays (see Fig. 3.3), he/she is recognized by his/her mobile phone NFC or by face recognition, and the user’s interfaces (UI) of the display adapts to the user preferences (Rodrigues et al., 2017) and necessities (visual, physical, audition).
Figure 3.2 – Bus Stop Overview
17
For each user different information appears, such as useful information, routes of all buses the user preferentially uses, what time they arrive to the stop (based on the current location, traffic, previous stops, etc.), real-time location, etc. For users like tourists it adapts automatically to the expected travel, for instance, it shows the necessary bus to go to the hotels. Nevertheless, the user can request information to the bus stop by using the touchscreen or a 3D-sensor to detect the gestures, e.g., a Leap Motion sensor (this way the user does not need to have physical contact with the bus stop).
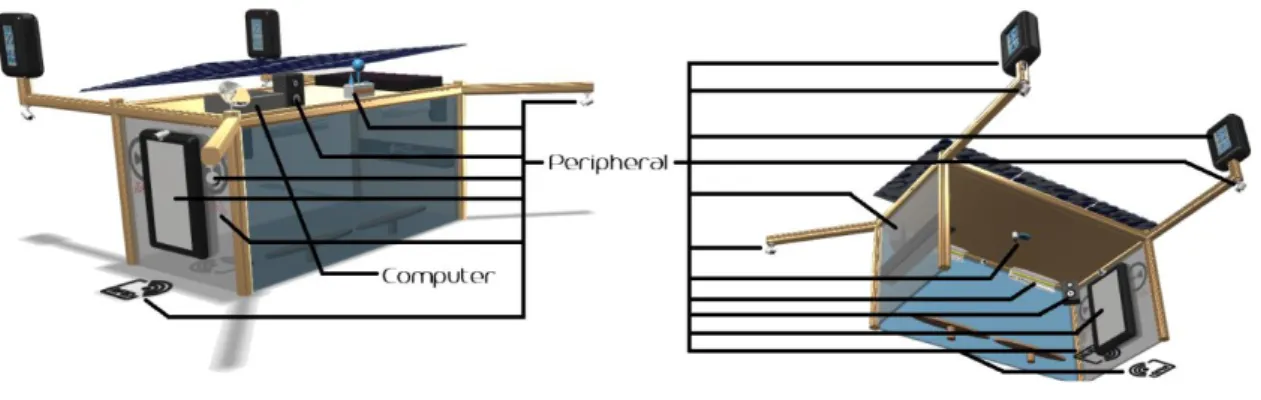
The stop will also have speakers to interact with the user(s), because the same speakers can be used to inform all people around the stop if a bus is coming and the corresponding number and destination. In addition, to the information provided by the screen inside the stop, there will also be an LCD screen outside the stop to inform. This can be seen at a considerable distance from the stop. It could present the most relevant information, namely the number of the bus and estimated time of arrival. Another type of information can also be displayed. Figure 3.4 shows some of the possible peripherals which can be integrated in SBS.
So far it cannot be said that this is a full smart bus stop, to be "smart", the bus stop should also suggest different bus lines adjusting the number of persons in each bus, and/or function of road works, heavy traffic, and/or in function of faster, cheaper, scenic routes (user’s preferences), see e.g., Cardoso, Schütz, Mazayev, Ey, & Correia (2015) for vehicle routing problem.
One important feature of a smart bus stop is to know (count) how many users are waiting for each different bus. This can be achieved by a combination of camera(s), NFC and Bluetooth information. This allows buses to skip stops with no users for that bus, it also allows to manage/optimize user occupancy, but at the same time gives to the user
18
the best user experience. Finally, it allows to avoid/decrease bus bunching. The cameras (Fig. 3.4) will also be used for public safety.
The user’s interface can also support other types of applications, such as games for users and/or kids to kill time, while they are waiting for the bus to arrive. Another application will be interactive publicity or digital books for people to read. Another focus different from games for kids, is the gamification of the SBSs, where the users can be advised (using the gamification principles) to take a different route, this way decreasing bus occupancy in the most crowded routes.
Augmented reality can also be inserted in a fun way, so the users could be entertained. This feature can be achieved by the same cameras and screens previously referred. Another functionality of the adaptive UI will be its ability to adapt to the user, both at the level of the interface itself, and in the choice of contents (games, advertising) that will be displayed.
For those who prefer to use their own cell phone, an application is available with a similar output as the ones presented at the bus stop. In addition, to all technologies, the bus stop should also have some instructions, not displayed on the screen, which should work for most blind users. These instructions should be in Braille (Fig. 3.3), but they are not "simple instructions". They have built-in sensors that detect when those instructions are being read. This way, the system can detect that a blind person is there and can help/interact with the user by using the proper way.
Also, when visually impaired (or blinds) users are detected (e.g., when the user’s mobile phone “Bluetooth" is detected) two pilot tones will be used (Somayeh, Martins, du Buf, Rodrigues, 2012). One to guide the visually impaired person to the SBS screen, not only to show visual information, but also to interact with the SBS by using sound and voice commands. The second pilot tone can guide the user to the bus door.
19
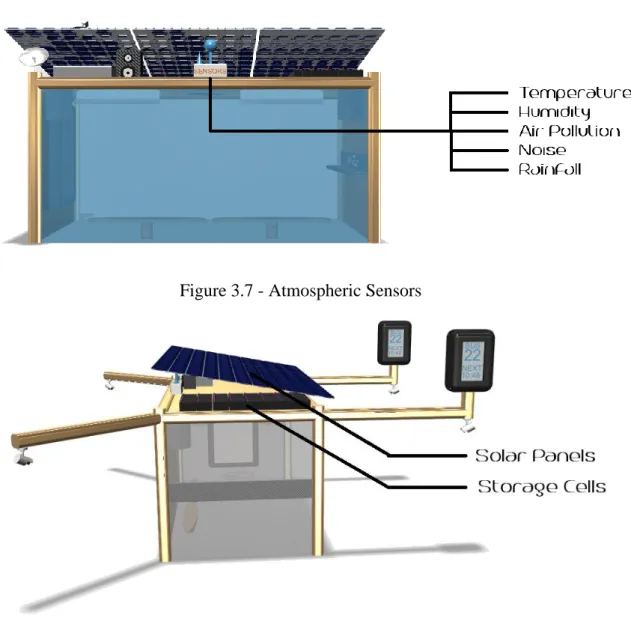
The SBS as an internet connection (also free Wi-Fi), could also be useful to have some other sensors built-in into the stop. Sensors that allow monitoring atmosphere conditions, like temperature, humidity, air pollution, noise, rainfall, etc. and energy monitoring and traffic control (Fig. 3.6). All this information can be presented in the SBS dashboard (Fig. 3.4), or in the user mobile phone SBS App. Another useful functionality is the capability of users being able to charge their mobile devices or any other devices.
The above system will require a considerable amount of energy, so it is important to collect as much renewable energy as possible. To do so, the use of solar panels (Fig. 3.7) is the most reliable option at the assembly and aesthetics level. Solar panels are the energy-gathering tool, but a place to store is also needed, to do so, the use of batteries is
Figure 3.7 - Atmospheric Sensors
20
just the way to do it. Nowadays, the batteries have a good storage capability, therefore it’s not necessary to resort to the use of super capacitors or other similar technology.
Nevertheless, other renewable energy gathering systems can be used, e.g., small wind turbines. For safety reasons in case of failure, power from the grid is also required. It turns out to be redundant but is currently the most reliable options for not having to resort to using a generator, that ends up being completely out of context if it were installed in the bus stop. Another solution is the distributed load scheduling for micro grids (Monteiro, Eduardo, Cardoso, & Semião, 2014). For details about the renewable energy system see (Rodrigues, Martins, Sousa, & Rosa, 2018).
Next Chapter presents one of the modules of the SBS, the prototype to know how many persons are in the SBS.
21
4 Counting Persons
A
BSTRACTOne of the SBS modules is to know how many persons are in the bus stop. This Chapters presents the frameworks and integration in a way to detect persons in the multi-camera system. After the persons being detected in several cameras they have to be checked if is the same person and counted.
22
4.1 G
ENERALO
VERVIEWAs mentioned in the Introduction, the prove of concept and prototype that is intended to implement in this thesis, is to count how many people are in a SBS in a multi static camera environment. So, the first step will be to gather as many information has possible from each camera so cross-referencing the data from all cameras can be faster and more accurate.
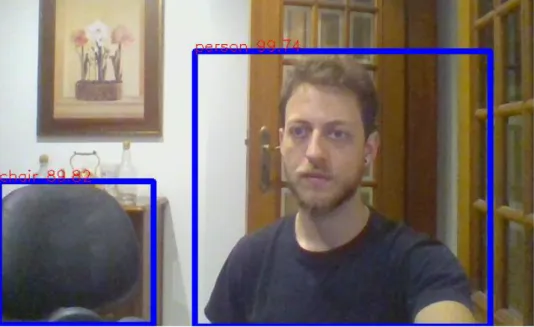
Since Convolutional Neural Network based algorithms surpassed the human recognition rate (Mallick, 2016), we will be integrating a Single Shot MultiBox Detector (SSD) (Liu et al., 2015) with MobileNet-SSD (MobileNetSSD, 2018) pre-trained model capable of detecting several classes of objects like dogs, cats, birds, cars, persons, etc., in a total of 21 different classes (Fig. 4.1 shows an example where a person and a chair were detected).
Figure 4.1 – MobileNet-SSD operation.
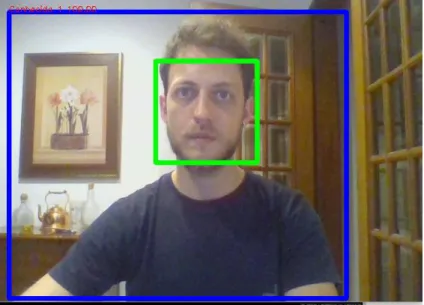
After a person is detected, the next step is to extract Regions of Interest (RoI) from the image. In our case the RoIs will be people and faces (as shown in Fig. 4.2). Faces are harder to get since the person needs to be looking to the camera (Fig. 4.2), so we will rely mostly on a group of features to keep identification.
23
Figure 4.2 – Person and facial detection operation, in the green square
If faces are present, dlib (King, 2018) that is a state-of-the-art facial detection and comparation library built with deep learning, can be used. If not, an SVM (Ray, 2017), classifier will be used for feature classification after being previously trained.
The algorithms used to cross information between frames from the same camera, so the identity of the person gets preserved, will also be used to cross information between cameras (Feed Acquisition #, in Fig. 4.3). Preserving the identity is important because if a person moves outside de image and comes back in, we will be able to re-identify he/she and update his/her information.
24
It is important to stress, that the goal is not to count the same person twice or more, according to the number of cameras used, while retaining the identification. Counting people accurately and retaining the identification is useful for knowing how much time a user spends on the bus stop and to know the affluence of the bus stop.
To do this, multiple processes will be used, Fig. 4.3, each process will be responsible for one task. In the end the last process will return the existing number of people at the bus stop.
4.2 F
EEDA
CQUISITIONP
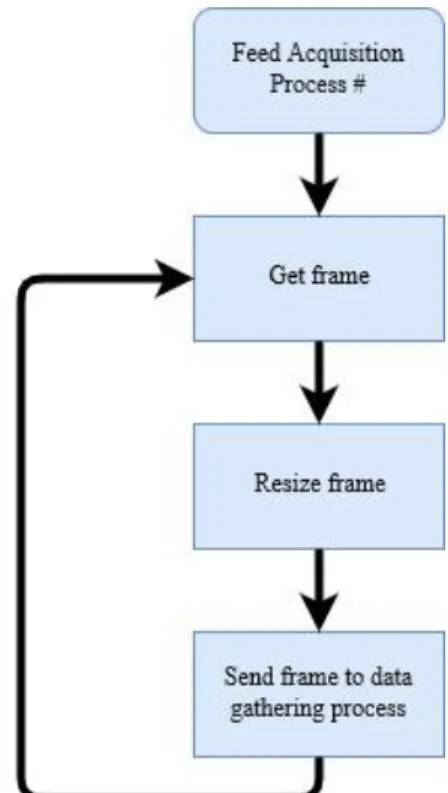
ROCESSThis process, Fig. 4.4, is responsible for the acquisition of images. It can get them from a live video stream, directly from a camera (or a video file). In this case the acquisition will be made from local cameras placed in the smart bus stop. After acquiring a frame, the process will resize it and sent it into the next process. The resize will reduce the amount of processing needed in the next process. Figure 4.5 shows the next step, data gathering process.
25
26
4.3 D
ATAG
ATHERINGP
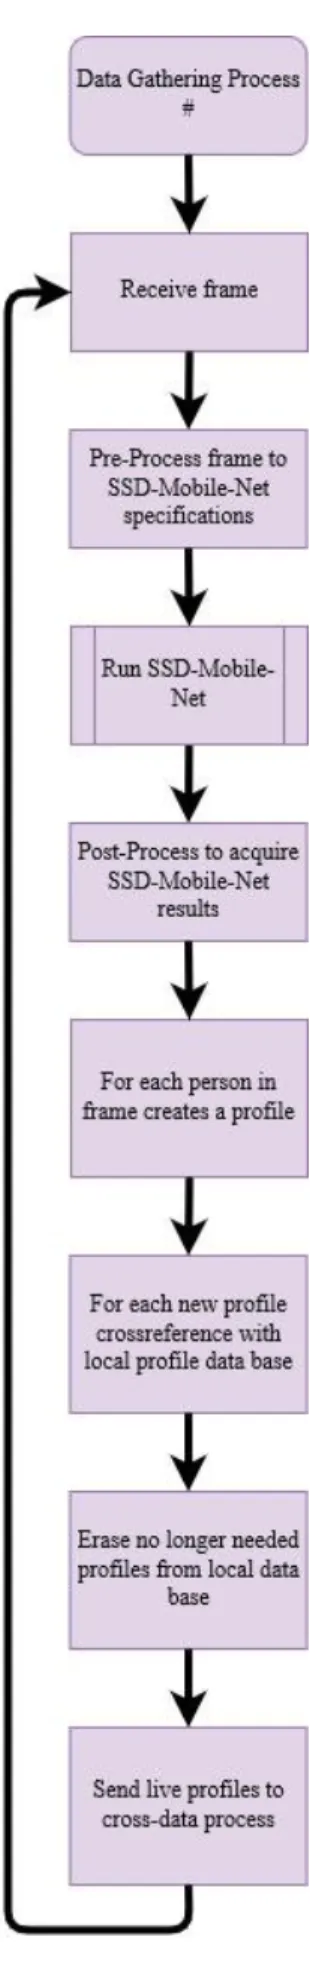
ROCESSThis process (Fig. 4.5) will receive the frames sent by the feed acquisition process and the first step is to make a copy of the frame so we can keep the original to show the results. The frame needs to be pre-processed in order to MobileNet-SSD can work with it. After “injecting” the image on the algorithm the coordinates of every person detected are available as well as the confidence that the algorithm has in his detection. Some people can be filtered because we are only interested in detections above a desired percentage.
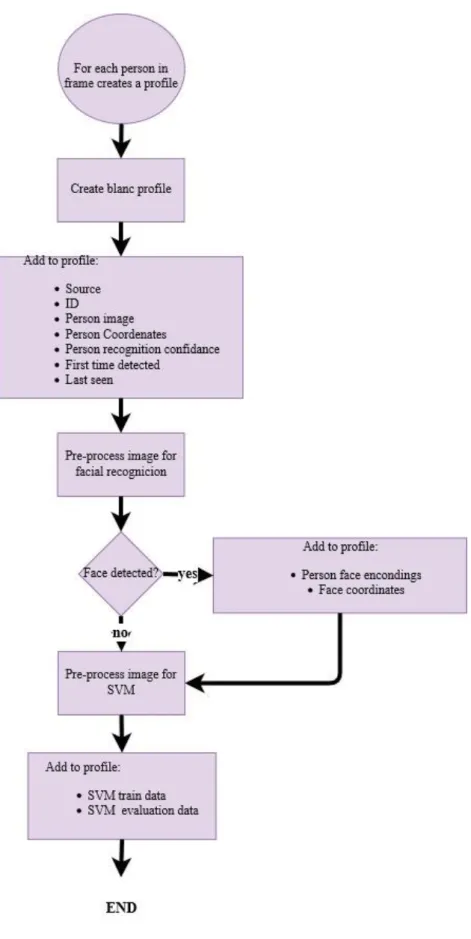
For each person detected in the image, a profile will be created, Fig 4.6, with all the relevant information like the source (camera id) of the frame; the coordinates (RoI) in the original image were the person is; the confidence of the algorithm in his detection; the timestamp when the detection occurred; a unique id for the profile; the image of the person itself which is basically the original image cropped by the RoI already saved; the SVM evaluation array and a list of previous arrays, which are a copy of the RoI converted into gray scale, resized, flatten. Finally, if possible, the face RoI and facial encodings.
After gathering all this information from the current frame, this data will be crossed against a local data base holding the same data from past frames, Fig. 4.7. First the process will try to match faces, if this is not possible the second choice will be the SVM model, but to do so the model needs to be trained. If no face is available and if the local data base does not contain enough data do have an SVM trained model, the last test will be the position/coordinates (RoI), if they match the process will consider the person to be the same. Using this method allows the process to keep gathering data and updating the local data base until a face is usable or an SVM model is ready to be trained. Doing this allows the process to retain the identity and keep the profiles of the live people in the image updated.
It is important to stress that, by choice, we do not explain in detail the Figs 4.6 and 4.7, both algorithm/diagrams are self-explanatory due to the amount of text inserted in the images.
27
28
Figure 4.7 – Creating and updating profiles.
The profiles from all the people in the image will be sent to the cross-data process in real time, this means that in the beginning, the frames required to train the SVM model will not be available, meaning that the process relies only on facial recognition to do profile filtering. To train the SVM model the process requires N past RoI, in this case, the RoI is the image that contains the person, which is all the area inside the blue lines (see Fig. 4.2). This RoI will be converted into grayscale. After that, the region will be resized into a matrix H × W and all the regions must be the same size. The next step is to flatten that matrix, this means that the matrix will be transformed into an array of length
29
H multiplied by W. Note that all matrices have the same size, therefore the arrays will also have the same length, and this is crucial as all SVM inputs must be the same size. Once the model is trained, it can be used to keep tracking of people or to re-identify them, in the case of them leaving and coming back from the SBS area.
4.4 C
ROSS-
DATAP
ROCESSThe Cross-data process, Fig. 4.8, will be receiving profiles from N sources (see Fig. 4.1); the first step will be organizing those profiles according to the source. There is no need to be trying to match profiles from the same source. After that being done, the process will iterate over the sources trying to find matching profiles
After every profile from every source is tested, it is already possible to say how many people exist without counting the repetitions. The algorithm that filters the repetitions has a very particular operation. The idea here is that as repeated profiles are being eliminated, the algorithm is getting faster and faster. Figure 4.9 will serve as an example. In this case there are four different sources, and on each one there are five diferent profiles, each profile represent one person and each person is represented as a color.
The algorithm will start on the first profile from the first source and will try to find a match on the second source. If a profile matches it will be removed and the algorithm will move on into a diferent source until there are no more sources left. Then it will move into the second profile and all the process will be repeated until there are no more sources letf.
After iterate from all sources the result will be the image below, Fig. 4.10, as it can be seen, the green profile remains only in the fisrt source. Now the total number of profiles are less so the next iteration will be faster. The algorithm will move on into the second profile in the first source and the all process will be repeated. When there no more profiles left on the first source, the algorithm will use has reference the second source and the all process repeat itself again until there are no more profiles or sources left. The total number of the remaining profiles, Fig. 4.11, in the end will be the total number of people in the Smart Bus Stop.
30
Figure 4.9 - General overview from data interpreter process
31
Figure 4.10 - First iteration result
Figure 4.11 - Remaining profiles after all iterations are done.
4.5 T
ESTS ANDR
ESULTSIt is now important to analyze how the prototype perform, in relation to some modules and in the overwall. MobileNet-SSD which is a Single Shot Multibox Detector pre-trained model for a CNN algorithm that as a mAP (mean Average Precision) of 0,727.
Facial recognition, which is built using dlib’s, that is a state-of-the-art face detection and comparison built with deep learning. The model has an accuracy of 99.38%
32
(King, 2018). The SVM which still needs to be trained so it could generate a model based in features, so it can make predictions. Based on the above mentioned, there is “not much” that can be tested on the first two. The models are already trained, so they will perform faster or slower (Table 5.1) according to the hardware that is being used. Nevertheless, the SVM model will be trained in real time, so the number of frames (arrays) to train the model and the size (length of the array) of each frame can be adjusted. Doing these adjustments, the algorithm may perform faster or better.
Using as CPU the Intel i7-4700MQ, which as four cores with a base frequency of 2.4 GHz and as GPU a Nvidia GeForce GT740M with 2Gb of DDR3 memory, the results of detection time and prediction time from the pre trained models are in the Tab. 4.1. The MobileNet-SSD takes approximately 0.2535s (seconds) to detect everyone in the image. This amount of time floats on each iteration, and the number of people in the image can make this fluctuation bigger or smaller. On the other hand, the facial recognition takes approximately 0.0094s to detect a face in the image and only 6.3x10⁻⁵ s to make a match.
Makes sense to evaluate the SVM using the same criteria, detection time, matching time (although in this case will be prediction time) and confidence. The tests will consist in varying the number of arrays used to train the model and the size of them. The number of arrays will give the model a bigger amount of variations and the size of the array will give more details.
Table 4.1 – MobileNet-SSD and Facial Recognition performance
4.6 S
UBMODULESIn this section will be presented several examples of the submodules in operation. Not only to see the behavior of the various algorithms, but also the behavior of the various processes involved and how they react to different videos sources.
Algorithm Detection Matching
MobileNet-SSD 0.2535 s
33
4.6.1 Execution Using a Single Source
Figure 4.12 shows all the people in it are detected accurately, then the tracking is made by facial recognition or position. As time goes by, frames are been gathered, then when enough samples are stored an SVM model is trained. After that the tracking is made by facial recognition, SVM and position, respectively.
The same figure (Fig. 4.12) also shows that SVM algorithm may fail (red rectangle in the figure), that is why subject number two was identified using position after being identified by the SVM model. This was not supposed to happen, since the priority of the algorithms is facial recognition, SVM, and position respectively like was mentioned before. When the SVM is not yet trained the identification is made by facials and position only, like is showed on the console (first eight prints). Once the SVM model is trained the only reason to a person being identified using position is if facial recognition and SVM fail to do it.
Figure 4.122 - Real time video processing from one source
4.6.2 Execution Using two Duplicate Sources
Figure 4.13 shows when using a duplicate source, all the people are detected accurately and like it was mentioned before the identification is made by facial recognition and position. But the cross-data process seems to have some trouble filtering the profiles accurately, because this process does not rely on positioning to filter the profiles that are sent to it. So, until the SVM model is trained, it only relies on facial recognition.
34
Therefore, it counts three people instead of two because, i.e., it counts one person twice. From the moment that the SVM model is trained and that information is sent to the cross-data process, now it can rely on facial recognition and on the SVM. Now it can filter profiles more accurately and it counts two people as it is supposed, see Fig. 4.14.
Figure 4.13 - Real time video processing from two duplicate sources (before SVM model is trained)
Figure 4.14 - Real time video processing from two duplicate sources (after SVM model is trained).
35
4.6.3 Execution Using two Different Sources
Figures 4.15 and 4.16 were made using a videos, where it is clearly seen, there is a face that can be easily identified. This was made to show that the cross-data process works using facials and failed were a facial could not be detected until the SVM model is trained. In a real-life scenario faces will not be always available, so in this example no faces are detected, Fig. 4.15 so the cross-data process relies only on SVM to do the filtering.
Figure 13.15 - Real time video processing from two sources (before SVM model is trained)
Figure 4.16 - Real time video processing from two sources (after SVM model is trained)