DEVELOPMENT OF LEAN ASSEMBLY LINE
–
A CASE STUDY
D. Rajenthirakumar* Associate Professor, Department of Mechanical Engineering,
PSG College of Technology, Peelamedu Coimbatore – 641004, Tamil Nadu, India. E-mail: [email protected]
R. Sridhar
Assistant Professor, Department of Mechanical Engineering,
PSG College of Technology, Peelamedu Coimbatore – 641004, Tamil Nadu, India. E-mail: [email protected]
A B S T R A C T K E Y W O R D S
A R T I C L E I N F O
Takt time, Line balance, Value stream mapping (VSM)
Received 12 July 2014 Accepted 12 September 2014 Available online 1 December 2014
This paper describes the implementation of lean tools in a wind mill-electrical control panel assembly plant in south India as a lean manufacturing improvement initiative. This involved mapping the activities of the firm, identifying opportunities for improvement and then undertaking with the firm an improvement programme. Current state map is prepared to describe the existing position and various problem areas. Takt time calculations are carried out to set the pace of production. Future state map is prepared to show the
proposed improvement action plans. The
achievements of value stream implementation are reduction in lead time, cycle time and inventory level. It was found that even a small company can make significant improvements by adopting lean principles.
________________________________ * Corresponding Author
1. Introduction
D.RAJENTHIRA KUMAR, R. SRIDHAR / International Journal of Lean Thinking Volume 5, Issue 1(December 2014)
2 A relatively recent tool to support and implement the lean philosophy is a VSM [5].
In this paper, an attempt has been made to initialise the implementation of lean manufacturing system using lean tools. VSM is used to identify the non-value added activities and to reduce the waste and lead time. A detailed implementation procedure conducted at a wind mill-electrical control panel assembly plant in south India is presented and some of the observations will be useful to the practitioners for implementing lean in small and medium scale firms.
2. Brief literature review
According to Stier [6], lean manufacturing is defined as a systematic approach to identify and eliminate non value-added activities through continuous improvement by flowing the product at the pull of the customer in pursuit of perfection. Domingo [7] has focused that in manufacturing plants, the assembly areas usually maintain a store of components to be assembled in the finished part. The main problem associated with the supply of these components is the inventory, limited space of the work station and optimizing the overall production-shop layout. The lean approach is focused on systematically reducing wastes in the value stream. The waste concept includes all possible defective work/activities, not only defective products [8]. Roberto Alvarez [9] has explained the use of value stream mapping as a tool in lean manufacturing implementation and a framework of improvement activities, in particular for an efficient introduction of kanban technique. Leslie D’Monte et al [10] have explained the implementation of lean tools using value stream mapping and the benefits derived out of it. From their work, it is also understood that the lean implementation always started with a basic tool of value stream mapping. In a highly competitive market, where quality and price are taken for granted, the key differentiator for many customers is the speed and consistency of product delivery. To provide more insights into implementation of lean manufacturing, a case study conducted in a in a wind mill-electrical control panel assembly plant in south India is presented.
3. Problem definition
3
Fig. 1 Electrical control panel assembly – Process flow
The list of objectives includes: (i) Elimination of the non-value adding actions (iii) Reduction of lead time (iii) Re-balance and optimize the electrical panel assembly line (iv) Empower the workers in the newly developed process and measure several runs to check if the process is repeatable and sustainable (v) Employee and line management training on principals of line balance and standard work.
4. Methodology
The different steps in implementation of lean are shown in Fig. 2. As a first step, data collection is done by walk through in the shop floor. The firm is producing different kind of panels for wind turbines and the products are grouped based on process steps (Tab. 1). Demand analysis shows that the Group-A contribute to 93.75% of daily demand (Tab. 2).
D.RAJENTHIRA KUMAR, R. SRIDHAR / International Journal of Lean Thinking Volume 5, Issue 1(December 2014)
4
Tab. 1 Identification of product family
Processes
Group A Group B
Control Panel
Pitch Panel
Power Panel
Enclosure preparation X X X Mechanical assembly X X X Electrical assembly X X X Electrical assembly X X X Electrical assembly X X X
Bus bar assembly X
Capacitor mounting X
Enclosure final assembly X X X Enclosure final assembly X X X Enclosure final assembly X X X Enclosure final assembly X X X Final inspection and testing X X X Packing and dispatch X X X
Tab. 2 Demand analysis
Group Product Weekly
demand
Contribution to Weekly demand
A Control Panel 64 93.75 %
Pitch Panel 32
B Power Panel 08 6.25 %
Total 128 100 %
4. 1 Preparation of current state map
After selecting a product family, the next step is to draw a current state map of the existing process. Current state map is prepared using standard icons for various processes to visualise the flow of material and information. The required takt time is calculated as 2.33 hours based on the demand. Considering the operation sequence, cycle time of each operation and precedence requirements, the existing imbalance in the assembly is identified (Fig. 3). Fig. 4 shows the current state map of the electrical control panel assembly. Results obtained from current state map indicates value added ratio as 0.84.
5
Fig. 4 The present state value stream map
4. 2 Work balancing
Line balancing is the problem that related to how the operations designated on the work stations can be optimized through balancing the activities assigned over the work stations. By reducing the takt time through equalizing the loads on the workstations the assembly line is balanced.
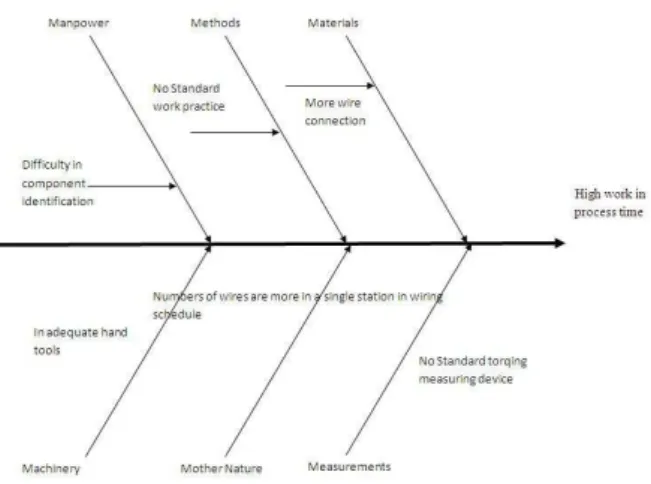
To begin with, the control panel assembly imbalance is analyzed and it is found that the electrical work related to control plate and power plate is greater than the required takt time (Fig. 5). For the elemental work “component wiring” it is found that 67.41% balance delay. The cause and effect diagram is drawn in order to find the cause of high work in process time for a electrical work-control side in control panel assembly. From Fig. 6, it is clear that, high work in process time occurs due to (i) worker facing difficulty in component identification (ii) absence of adequate tools and searching for tools (iii) absence of standard work practice (iv) absence of proper wiring schedule.
D.RAJENTHIRA KUMAR, R. SRIDHAR / International Journal of Lean Thinking Volume 5, Issue 1(December 2014)
6
Fig. 6 Cause and Effect diagram for high wiring time
The work balance is achieved by splitting the wiring schedule based on the wire specification. The solution is given in Tab. 3. As a result, the balance delay is reduced to 20%. Similar kind of task has been carried out in the power plate assembly and 23% of balance delay is achieved.
Tab. 3 Work balance in control plate wiring
Size/Color Total no of
wires
Control side-1 1/BU, 1.5/BU, 1.5/WHBU 166 Control side - 2 1.5/RD, 1.5/YE, 1.5/BK,
1.5/WHRD, 1.5/YEGN, 2.5/BK 163 Control side - 3 1/BU, 1.5/BU, 1.5/WHBU 87
4. 3 Standardized work procedure
Standard work instructions are used to maintain and improve productivity, quality and safety. They provide a documented process sequence to perform work with the most efficient method in the designated takt time. Used as a part of lean and kaizen initiatives they can highlight opportunities to make improvements in working procedures to reduce non value adding work content [7]. A snap shot of the standard work procedure developed for the electrical control panel assembly is shown in Fig. 7. The improved value added ratio is calculated as 0.90.
7
4. 4 Preparation of future state map
The second scenario or future state map is drawn considering all the improvement initiatives and the value added ratio is 0.90. The overall improvements are given in Tab. 4. Further, (i) visual management tools were added to reduce complexity and improve consistency of units produced (ii) Standard operating procedures and training were done for all operators (iii) Point-of-use tooling and shadow boards were implemented (iv) Error proof jig to prevent defects and rework was implemented.
Tab. 4 Improvements in VA time after lean implementation Station Description VA Time NVA Time Total Enclosure Preparation 2:00:43 0:08:30 2:09:13
Total 2:09:13
Co-1 Mounting Plate
Preparation 1:19:07 0:00:39 1:19:46
Co-2 Stickering and
Component Assembly 1:50:50 0:28:04 2:18:50 Co-4 Plate Wiring-1 1:58:59 0:24:41 2:23:40 Co-5 Plate wiring-2 2:09:23 0:23:09 2:22:36 Co-6 Plate Wiring-3 1:05:00 0:15:00 1:20:00 Co-7 Torqing 0:27:38 0:12:28 0:40:06
Total 10:24:58
Station Description VA Time NVA Time Total
Po-1 Mounting Plate
Preparation 2:11:53 0:17:03 2:28:56
Po-2 Stickering and
Component Assembly 2:28:14 0:20:40 2:48:54 Po-3 Plate Wiring-1 2:00:15 0:12:10 2:10:20 Po-4 Plate Wiring-2 2:01:18 0:13:09 2:16:32 Po-5 Plate Wiring-3 1:58:26 0:11:27 2:09:53 Po-6 Torqing 0:31:38 0:14:28 0:46:06
Total 12:40:41
Station Description VA Time NVA Time Total 7 Enclosure Assembly 1:59:11 0:23:09 2:22:20 8 Enclosure Wiring-1 2:11:13 0:12:49 2:24:02 9 Enclosure Wiring-2 1:03:36 0:17:36 1:21:12 10 Panel Testing 2:09:16 0:02:31 2:12:06 11 Packing 1:58:19 0:04:16 2:02:35
Total 10:22:15
5. Conclusions
D.RAJENTHIRA KUMAR, R. SRIDHAR / International Journal of Lean Thinking Volume 5, Issue 1(December 2014)
8
References
WOMACK J P, Jones D., Roos D.: The machine that changes the world: Macmillan, 1990.
CAGLIANO R, Caniato F., Spina G.: Lean, agile and traditional supply – how do they impact manufacturing performance?: J Purch Supply Manag, 2004:151-164.
SHAH R, Ward P.: Lean manufacturing – context, practice bundles and performance: J Oper Manae, 2003: 129-149.
PAVNASKAR S J, Gershenson J. K., Jambekar A. B.: Classification scheme for lean manufacturing tools: Int J Prod Res, 2003: 3075-3090.
Rother M, Shook J.: Learning to see: value stream mapping to add value and eliminate muda: The Lean Enterprise Institute, 1998.
Kenneth Stier.: Teaching lean manufacturing concepts through project based learning and simulation: Journal of Manufacturing Technology Management, 2003: 886-887.
Rosario Domingo, Roberto Alvarez, Marta Melodia Pena, Roque Calvo.: Material flow improvement in lean assembly line: a case study: Journal of Assembly Automation, 2007:141-147.
Shahram Taj, Lismar Berro.: Application of constrained management and lean manufacturing in developing best practices for productivity improvement in a auto-assembly plant: International Journal of Productivity and Performance Management, 2007:332 -345.
Roberto Alvarez, Roque Calvo, Marta Pena: Redesigning an assembly line through lean manufacturing tools: International journal of Advanced Manufacturing Technology, 2008: 1772-1780.