Capital Structure and Diversification Strategies for
Listed Portuguese Companies
by
Rafaela Teixeira Militão
Master in Finance Dissertation
Supervisor:
Professor Júlio Manuel dos Santos Martins
Bibliographical Note
Rafaela Teixeira Militão was born on the 24thof December 1991, in Vila Real.
She Graduated in Economics at School of Economics and Management at University of Porto (Faculdade de Economia do Porto) in 2012.
In the same year, she joined PwC, SROC, Lda in Assurance – area in which she continues working until now.
In the academic years of 2013/2014 and 2014/2015, she attended and completed the Masters in Finance curriculum part, under which is presented this dissertation.
Abstract
Capital structure decision is considered one of most debated topics in corporate finance, being several theories and empirical studies developed since the irrelevance of financing decisions in value creation of the firm with Modigliani and Miller (1958).
Notwithstanding, the puzzle of firm’s financial resources is still unsolved (Myers, 2001), and there is not a single theory capable of incorporating all the determinants in this dynamic process (Frank and Goyal, 2009).
For this reason, the present dissertation aims to introduce a corporate strategy approach in the capital structure decision, focusing on Product and Geographic Diversification.
Using a sample of 35 Portuguese listed companies, from 2003 until 2013, static panel data models were developed for three Leverage measures – Total Debt Ratio, Long-term Debt Ratio and Short-Long-term Debt Ratio – as dependent variables, being Product Diversification and Geographic Diversification introduced as explanatory variables.
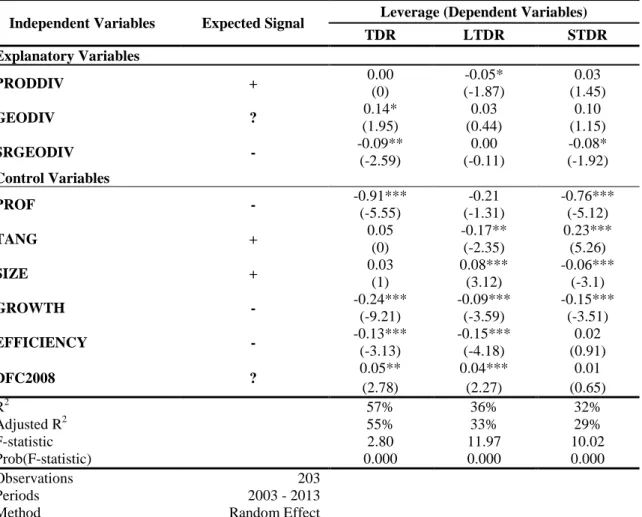
The results evidence that Product Diversification is not significant in explaining Leverage ratios. Alongside, some findings support that Total Debt and Short-term Debt Ratios exhibit a non-linear inverted U-shape relationship with Geographic Diversification.
Key-words: capital structure, corporate strategy, financing decisions, product
diversification, geographic diversification, panel data models.
Index
1. Introduction... 1
1.1 General Background... 1
1.2 Objectives and Motivations... 2
1.3 Structure of the study ... 3
2. Theoretical Background... 4
2.1 Major Capital Structure Theories... 4
2.1.1 Modigliani and Miller Model ... 4
2.1.2 Trade-off Theory ... 5
2.1.3 Pecking Order Theory ... 6
2.1.4 Signalling Models ... 7
2.1.5 Agency Costs Theories... 8
2.1.6 Market Timing Theory ... 9
2.1.7 Other contributions... 10
2.2 Capital Structure and Diversification... 11
2.2.1 Coinsurance Effect... 12
2.2.2 Transaction Costs ... 12
2.2.3 Agency Costs... 13
3. Related Research – Capital Structure and Diversification ... 14
3.1 Leverage and Product Diversification... 14
3.2 Leverage and Geographic Diversification ... 15
3.3 Leverage and Dual Diversification Strategy ... 16
3.4 Leverage and New Geographic Area of Operation... 17
3.5 Summary ... 17
4. Hypotheses Development and Research Design... 20
4.1 Research Hypotheses ... 20
4.2 Empirical Models ... 21
4.2.1 Panel Data Models ... 21
4.2.2 The Model ... 23
5. Sample Selection and Descriptive Statistics ... 28
5.1 Sample Selection and Data... 28
5.2 Descriptive Statistics ... 29
6. Empirical Results ... 35
6.1 Univariate Results ... 35
6.2 Multivariate Results ... 36
6.2.1 General Empirical Results... 37
6.2.2 Additional Analysis - Impact of 2008 Financial Crisis ... 42
6.3 Robustness Tests ... 45
6.3.1 Alternative Measure of Leverage... 45
6.3.2 Effect of Dual Diversification Strategy... 46
6.3.3 Sensitivity Test to Outliers ... 46
7. Conclusion ... 48 7.1 Discussion of results ... 48 7.2 Limitations ... 50 7.3 Future Research... 50 Appendixes ... 51 Bibliography ... 55 Annexes ... 62
Table Index
Table 1: Summary of empirical studies about Capital Structure and Diversification Strategies reviewed
and main findings. ... 18
Table 2: Summary of the dependent and independent variables and expected relationship with Leverage. ... 27
Table 3: Sample distribution across industries... 29
Table 4: Breakdown of the sample within each type of diversification, using Entropy Measure of Diversification Index. ... 30
Table 5: Descriptive Statistics of the Sample. ... 33
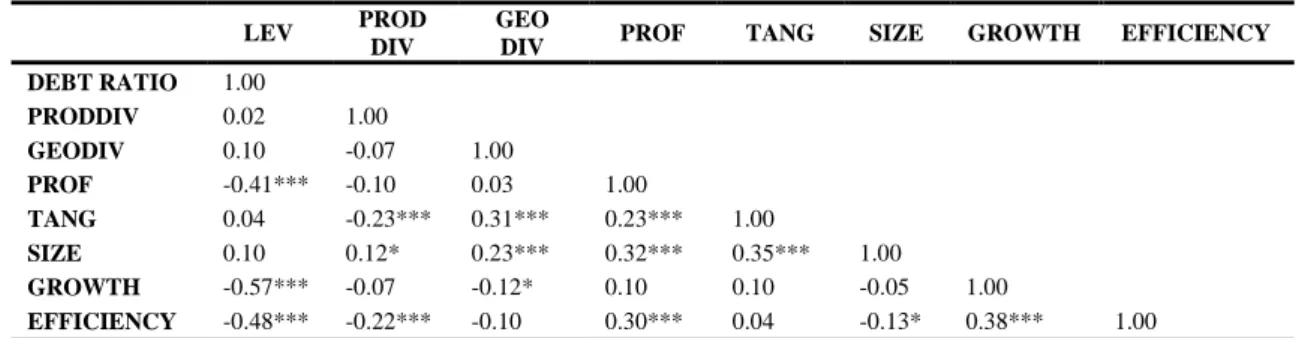
Table 6: Pearson Correlation Matrix, using Total Debt Ratio as Leverage measure. ... 35
Table 7: Regression Results of the Model (4.1) for the total sample, for the period 2003 - 2013. ... 38
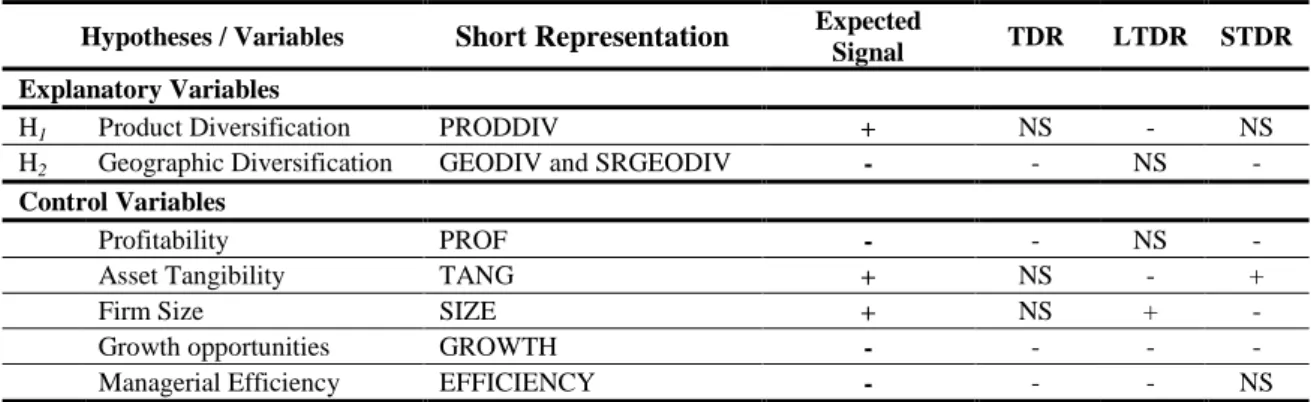
Table 8: Expected and observed signal by variable. ... 42
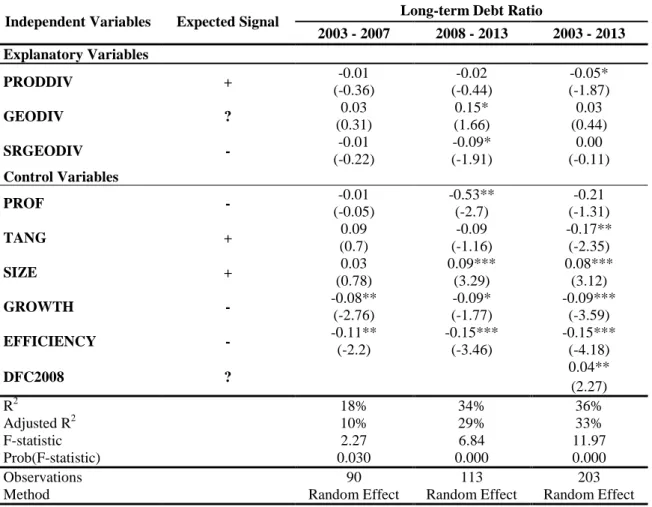
Table 9: Regression Results of the Model (4.1) splitting the sample before and after 2008 financial crisis for the dependent variable Long-term Debt Ratio. ... 44
Graph Index
Graph 1: Sample Average Leverage evolution between 2003 and 2013. ... 30Graph 2: Average composition of Sample Capital Structure between 2003 and 2013. ... 31
Appendix Index
Appendix 1 Entropy Measure of Diversification ... 51
Appendix 2 Hausman Test ... 51
Appendix 3 Correlation matrix with Dependent variable Long-term Debt Ratio ... 52
Appendix 4 Correlation matrix with Dependent variable Short-term Debt Ratio ... 52
Appendix 5 Regression Results of Models (4.1), for the period 2005 – 2013 ... 53
Appendix 6 Regression Results of Model (4.1) for the total sample, for the period 2003 – 2013, using different Dependent Variables ... 54
Annex Index
Annex 1 Companies included in the study ... 621. Introduction
The present study investigates the impact of the degree of Diversification Strategies on financial sources, and whether Product and Geographic Diversification are significant determinants of listed Portuguese companies’ capital structure.
Since de 50’s, it has been widely discussed what are the determinants of capital structure. These decisions have raised a significant amount of theories and empirical researches in order to investigate this complex process. Modern theory began the puzzle holding the irrelevance of financing decisions in value creation of the firm with Modigliani and Miller (1958). In the following years, some assumptions of this initial perspective were removed, emerging other theories to complement the determinants of the firms’ financial resources.
1.1 General Background
Relaxing some Modigliani and Miller (1958) assumptions, the Trade-off theory argues that capital structure results from the trade-off between the costs and benefits of debt, being tax deductible interest expenses an advantage, against the fixed debt obligations as a detrimental variable (Kraus and Litzenberger, 1973; Scott, 1976).
Myers and Majluf (1984) developed the Pecking Order theory based on asymmetric information, in which managers prefer internal sources, and when external financing is required, debt has priority over equity.
From the Agency Costs theory perspective, debt is a disciplinary mechanism, able of controlling the available cash-flows and managers discretionary behaviour; nonetheless, leverage increases the default probability, being also a trade-off to take into account in the debt level decision (Jensen and Meckling, 1976).
Under Market Timing theory presented by Baker and Wurgler (2002), the capital structure is a cumulative outcome of attempts to explore the market opportunities, without an optimal solution.
was exposed with Frank and Goyal (2009) extensive study over half a century for American companies, being pointed out weaknesses in the main theories of capital structure in explaining the findings achieved.
1.2 Objectives and Motivations
None of the theories appear alone to be more imperative than other. This environment opens an area of research for which it is useful to conduct additional studies to investigate the debt/equity mix. It became relevant to combine some other inputs, provided by management and strategic scholar, incorporating the role of the strategy in this complex process (Barton and Gordon, 1987). This is the main motivation of the current study that focuses on the specific case of Diversification Strategies (Product and Geographic) impact on financial sources.
The effect of such strategies on capital structure is a product of three factors – i) the Coinsurance Effect, through the imperfect correlation of cash-flows from the diversified activities, implying a decrease of the operational risks, which increases the debt capacity (Lewellen, 1971; Kim and McConnell, 1977; Bergh, 1997); ii) the Transaction costs in case of bankruptcy, having diversified firms also diversified assets, being more easily disposed, increasing the collateral provided to debtholders, which ultimately allows to obtain more debt (Williamson, 1988; Balakrishnan and Fox, 1993; Kochhar and Hitt, 1998); and iii) the Agency Costs, proceeding from the fact that more disperse activities increase their monitoring costs and asymmetric information, reducing debt capacity (Jensen and Meckling, 1976; Jensen, 1986; Kochhar, 1996).
A second and also important reason to develop the study is that empirical studies have examined the Diversification Strategies determinants on capital structure (e.g. Barton and Gordon (1988), Kochhar and Hitt (1998), Menendez-Alonso (2003), Singh, et al. (2003), Singh and Nejadmalayeri (2004) and Joliet and Muller (2013)) in other countries, but not in Portugal, which is a gap in the literature. Our study is therefore a contribution for the literature in this matter.
We also took advantage of the recent economic downturn to explore those determinants in such an environment.
The methodology adopted was grounded in multiple regressions techniques applied to panel data, as similar studies in the field (Barton and Gordon, 1988; Kochhar and Hitt, 1998; Menendez-Alonso, 2003; Singh, et al., 2003; Singh and Nejadmalayeri, 2004; Frank and Goyal, 2009).
1.3 Structure of the study
The remainder of the study is organized as follows. Section 2 presents the major capital structure theories, being also focused in the relationship of capital structure and diversification strategies. Section 3 introduces the related studies, exposing the empirical evidence available in the literature. Section 4 discusses the research questions and the respective methodology employed in our study. Section 5 gives details of the data used in our study and sampling procedures, along with the sample characterization. Section 6 reports the empirical results. Finally, the study concludes in Section 7 with the main findings, limitations and suggestions for future research.
2. Theoretical Background
To provide the theoretical background on the field of capital structure and also diversification strategies, firstly we present a general overview of the main theories of capital structure in section 2.1, followed by some specific theoretical explanations of the relationship between Capital Structure and Diversification Strategies in section 2.2.
2.1 Major Capital Structure Theories
It has been widely discussed, since many years, the value relevance of financing decisions. Modigliani and Miller (1958) started this long journey, giving the theoretical insights followed by many authors (e.g. Kraus and Litzenberger (1973), Jensen and Meckling (1976), Ross (1977), Myers and Majluf (1984), Brennan and Kraus (1987) and Baker and Wurgler (2002)).
2.1.1 Modigliani and Miller Model
Modigliani and Miller (1958) began the capital structure puzzle holding the irrelevance of financing decisions in value creation of the firm. However, as it is referred by the authors, some drastic simplifications were put in place to face the dilemma – such as, no taxes, no transaction and bankruptcy costs, symmetric information, rationality of investors and homogeneous expectations – creating a perfect, but not real and feasible, market scenario.
Miller (1977) puts a spotlight on taxes with the aim of introducing some real aspects to the theory above, since interests represent a tax deductible expense, creating gains for any company subject to tax-paying. Notwithstanding, even with this improvement, if interest tax shields are effectively firm value creators, it wasn’t enough to explain why capital structure were not exclusively composed by debt (Myers, 1984).
Furthermore, Miller (1977) establishes an equilibrium of aggregate supply and demand for corporate debt, along with and an equilibrium debt-equity ratio for the corporate sector as a whole, but with no optimum debt ratio for any individual firm. In this equilibrium state, the value of the firm will be again independent of the debt and equity scheme, since the taxes of the personal income by the managerial investor in corporate
debt, will offset the corporate tax saving. Therefore and considering that different investors have different taxes rates, firms will issue debt as long as the benefit is positive, i.e. until the marginal balance between benefits and costs of debt are positive.
2.1.2 Trade-off Theory
Kraus and Litzenberger (1973) introduced new pieces in the puzzle with Static Trade-off Theory, combining two market imperfections – taxation of corporate profits and the existence of bankruptcy penalties. The model developed demonstrates that the levered firm value results from the unlevered firm market value, plus the tax advantage of debt, deducted of corporate tax rate times the present value of bankruptcy costs. In this framework, the tax advantage allows a higher after-tax operating income, however, it is limited with legal obligation of fixed payments to debtholders, that when not met could represent penalties and possibly force into bankruptcy.
Scott (1976) also present an optimal capital structure model, being under the assumptions that bankruptcy is possible and the secondary markets for assets are imperfect. It also refers that debt is valuable, as interest payments are tax deductible, to the extent that level of debt implies higher probability of occurrence of insolvency costs. In addition, the author also argues that an increase in the liquidation value of the firm’s assets, collateral for debt obligations, reduces the costs of going bankrupt and consequently, will allow a higher level of debt.
In this way, Trade-off Theory sustains moderate debt ratios, putting out of scope established, profitable companies with superior credit ratings, operating historically at low debt ratios (Myers, 2001). Despite this weakness, the theory is consistent with the fact that companies holding higher slices of safe and tangible assets will borrow more than riskier companies with higher proportions of intangible assets, which offer an unsteady collateral to debtholders (Myers, 2001).
In order to innovate the static method of Trade-off Theory, Hennessy and Whited (2005) formulate a theory where capital structure decisions are defined simultaneous with investment decisions, enriching the previous approach with more dynamism in the process. They found evidence to support the inexistence of a target debt ratio, presenting variation in tax parameters as powerful explanatory variable of some
anomalies in the expected capital structure decision behaviour from the traditional Trade-off Theory point of view.
2.1.3 Pecking Order Theory
Moving forward with this unsolved puzzle, another milestone to consider is the Pecking Order Theory (Myers and Majluf, 1984), introducing a model based on previous studies concerning financing practices developed by Donaldson (1961) and asymmetric information. Contrasting with Trade-off Theory, Myers and Majluf (1984) have presented a model to explain some aspects of the corporate behaviour, such as the preference for internal sources and the prioritization of debt over equity, when external financing is required. The two key points of the theory are i) the costs of relying on external financing, since it would represent a separation of ownership and control, implying a subordination of managers to the capital markets and ii) the advantage of debt over equity caused by the asymmetric information effect, since raising equity to finance investments could be perceived by the market as a sing of stocks overvaluation, as managers have more information, expecting an higher rate of return and consequently, increasing the cost of equity.
Therefore, the Pecking Order Theory overcomes the Trade-off Theory explaining why profitable firms borrow less, considering that those firms will have more internal funds available, than less profitable ones. It also gives theoretical insights that help explain why debt is the preferred source of external financing, on the grounds that managers will avoid underpricing consequences of issuing new equity to finance projects, being debt more appealing. Nonetheless, the theory does not address the possibility of using financial tactics in order to balance the managers’ superior information, and the optimal capital structure goal is overshadowed by the costs of external financing.
Other authors (e.g. Harris and Raviv (1991) and Heinkel and Zechner (1990)) also explain capital structure decisions driven by new investments cash-flows and the effect of asymmetric information on the process.
To outside investors, the only investment information obtained regarding investment decisions of the firms is if certain project is taken. Under this information asymmetry, it is not possible to outside investors disaggregate a firm on its net present value projects
(Harris and Raviv, 1991). So, there is a window opportunity to overinvestment, since securities of the firm are valued by outside investors through the average project quality (Narayanan, 1988) and consequently, overpriced equity could be used to finance negative NPV projects. Knowing this, Heinkel and Zechner (1990) introduced a model to formulate an initial capital structure with an optimal level of debt that leads to the best subsequent investment policies - reduces the overinvestment financed through overvalued equity and at the same time, does not limited the available cash flows in such order that could lead to underinvestment policies. Their results suggest an optimal capital structure in the initial moment, with a debt/equity mix that generates the first best firm value-maximizing result of investment policy in the next time period, when managerial decisions have to be taken.
2.1.4 Signalling Models
The underinvestment problem present by Myers and Majluf (1984) is addressed by other authors, but resolved through a richer set of financing options than straight debt over equity, invalidating in some cases the results of Pecking Order Theory (Brennan and Kraus, 1987; Noe, 1988; Constantinides and Grundy, 1989).
Brennan and Kraus (1987) establish a value-revealing signalling equilibrium of the financing choice characterized by a theorem based on the lemon property, which sets that each financing strategy is chosen by the worst possible type of firm from the investor’s point of view and consequently, the net claim will be the lowest true and full-information value. Firms will try to maximize the lag between the price of its financing choice and its true value. Although, if investors will price financing choice at its worst case value, firms will be induce to choose the worst-case financing strategies, since other alternative choice will imply a negative difference the true value of financing choice and its price. Along these lines, the financing strategy is a signal of the characteristics of the firm (Brennan and Kraus, 1987), being equity issue a negative signal, but on the other hand, issuing equity to repurchase debt a positive signal.
In the scope of asymmetric information, other models with fixed investment give to capital structure the role of signalling private information (Ross, 1977; Heinkel, 1982; Poitevin, 1989; Hillier, et al., 2011).
Ross (1977) develops a model in which profitability and debt-equity ratio are positively related, being debt a signalling mechanism used by managers of high-quality firms to provide inside information not available to the market. The author explains that debt is an efficient and believable instrument of firm value, since engaging in new debt contracts signs the firms’ capability of future coupon debt payments and, on the other hand, firms with poor performance could not be able of issuing the same levels of debt, since have higher marginal expected bankruptcy costs than higher quality firms.
2.1.5 Agency Costs Theories
Other contributions to the puzzle defined a firm as nexus of contracts, since everyone who has an interest in the firms’ activities are part of the whole design web which the firm is made, (Jensen and Meckling, 1976). In that web, every role has a different influence – managers have direct control over the business activity, aside the fact that shareholders or suppliers of risk capital have indirect control. The foundation of this definition categorizes debt as less interventionist, because bondholders can only control the firm in the case of default or covenants breach, and equity as being similar to hierarchical control, through board of directors and monitoring activities. Considering this, debt and equity frame can be viewed as a governance structure, as it is suggested by Williamson (1988). Debt could reduce the agency costs between shareholders and managers, creating discipline in the use of the available cash-flows. Although an increase on leverage intensifies the bankruptcy costs. Taking into account this trade-off, Jensen (1986) defends an optimal debt ratio capable of equalizing the marginal benefits and costs of debt.
Harris and Raviv (1990) and Stulz (1990) study the agency costs as determinant of capital structure, being focused on the conflicts of interest between equityholders and managers.
The optimal capital structure of Stulz (1990) generate a solution with a debt level capable of limiting the free cash available, in order to resolve the overinvestment conflict, as it is presented by Jensen (1986). Additionally, this optimal solution also incorporates the costs of debt which arise from having the free cash allocated to debt payments, precluding the execution of profitable investments, thus conducting to underinvestment. Managers could be reluctant in execute the optimal level of debt on
account of being a manager’s flexibility restrain mechanism. Therefore, Stulz (1990) argues that potential takeover targets firms will have more debt, than firms with anti-takeover measures; he also expects that firms with higher positive net present value investment opportunities will have less debt in their capital structure, predicting that value-increasing investments are able of offsetting the value-decreasing ones.
Harris and Raviv (1990) argue that the conflict of interest between managers and shareholders is regarding liquidation decisions, since it is assumed that managers will always continue operations even if liquidation is a better scenario for investors. Under this assumption, debtholders could force liquidation when cash-flows are reduced; however, default decision study implies investigation costs in order to ultimate the decision, increasing the resources lost in the liquidation process. As a result, firms with higher liquidation value, i.e. with more tangible assets and/or lower investigation costs related to the default process will have higher levels of debt.
In pursuance of the conflicts between debtholders and equityholders, Diamond (1989) and Hirshleifer and Thakor (1992) incorporate reputational considerations of firms in the capital structure decision. The reputation of a firm is dependent on its history of debt repayment, so firms with a long history have a higher record and therefore will have more incentives to endorse safer projects. Notwithstanding, young firms do not have their reputation on stake, having lower costs when balancing riskier projects acceptance.
2.1.6 Market Timing Theory
In more recent years, Market Timing Theory (Baker and Wurgler, 2002) upgrades the traditional approaches, being based on the trend of companies issue equity when market-to-book ratios are high and repurchase when market value is below the book value. The authors considered this review as having a substantial explanatory power, using the market-to-book ratios to capture the market timing opportunities perceived by managers. As a result, the capital structure is a cumulative outcome of attempts to explore the market opportunities, without having an optimal solution.
Welch (2004) following the approach of Baker and Wurgler (2002) demonstrate that the debt ratio dynamics is largely explained by stock returns and also stock return-adjusted historical capital structure. However, it is not due to attempts of exploring market
timing opportunities, since it has not been found evidence that issuing equity is a used mechanism of counteract for stock returns variability by corporations. Despite this fact, the author puts stock return as a first order determinant of debt ratios, being the correlation between them near one. It also argues that other variables used in the study of capital structure play a significant role, because are correlated with omitted dynamics of stock returns.
Elliott, et al. (2008) decomposed the market-to-book ratio into two components – mispricing and growth options – avoiding the multiple interpretations of this variable. In a framework with growth options controlled, the author found strong evidence supporting market timing theory, founding that when equity is overvalued it is probable that firms issue equity.
2.1.7 Other contributions
Heaton (2002) introduces through the field of behavioural finance the impact of managers optimism into the problem, without invoking the conflicts of interests stated above and their agency costs. First, the author supports that optimistic managers could prefer internal funds, on behalf of external sources, due to the overvaluation made on the company. Second, since they also overvalue their capabilities, they could pursue negative net present value projects. These findings implicitly suggest that a certain amount of free cash-flow, enough to finance the positive net present value projects, could avoid under-investment. In the optimistic manager scenario, limited available cash-flows could not work as effective mechanism in order to maximize value creation, as suggested by Jensen (1986).
Frank and Goyal (2009) developed a research with American companies over 54 years, from 1950 until 2003, with the goal of identifying reliable patterns of capital structure explanatory theories, incorporating inputs to capture the main contribution presented in the literature. The main findings indicate that leverage is positive related with size, tangible assets and industry leverage; it is also pointed out that it is negatively related with profits and market-to-book ratios.
Summary
Despite all findings, the extensive research pointed out weakness in the main theories of capital structure. Market Timing approach has low explanatory power in the trends identified in the leverage ratios; the Pecking Order Theory intuitively relates profitability with low leverage, however, assets tangibility, industry leverage and firm size stay out of scope from this theoretical framework; from Trade-off Theory arises the empirical weakness of profitable firms with lower leverage ratios, although, sustain size, industry leverage, tangibility and market-to-book as important determinants.
A long journey has been accomplished in direction of the optimal capital structure, but the puzzle is still unsolved and probably will remain so (Myers, 2001). Granting all this, new perspectives and determinants are explored, sharping the main building blocks off this all dynamic process.
In section 2.2, bearing in mind the capital structure theories above mentioned, we shed further light and discuss the relationship between capital structure and diversification, introducing a corporate strategy approach to the financial paradigm.
2.2 Capital Structure and Diversification
The limitations of finance paradigm in explaining capital structure decisions at the firm level suggest that managerial choice is relevant, and the strategy decision framework is an important complement in capturing the factors that have an impact on this decision (Barton and Gordon, 1987). In fact this new perspective, complemented with corporate strategy, is a development from a deterministic product of external market forces as implied by the finance field, into a more functional managerial decision approach.
In particular, the effect of diversification on capital structure is likely to be a product of the coinsurance effect (Lewellen, 1971; Kim and McConnell, 1977; Bergh, 1997); the transaction cost (Williamson, 1988; Balakrishnan and Fox, 1993; Kochhar and Hitt, 1998) and the agency cost (Jensen and Meckling, 1976; Jensen, 1986; Kochhar, 1996).
We discussed on the following paragraphs for each of these theories the impact of Diversification Strategies on Capital Structure.
2.2.1 Coinsurance Effect
Lewellen (1971) questioned if it was possible to produce gains to the stockholders in a merger without sufficient operating efficiencies, referring this possibility as a pure financial combination of enterprises. Following this approach, the author concludes that mergers provide more debt capacity, because the likelihood of default of the consolidated firm is smaller than the sum of firm’s individual probability of failure on debt commitments. The merger partners are now accountable for all the jointed debt obligations, setting a borrower diversification context, which results in more debt capacity. Therefore, the coinsurance effect arises from the possibility of imperfect correlation of cash-flows, which reduces the operational risks, creating additional borrowing capacity.
In search of coinsurance effect, Kim and McConnell (1977) also conclude that merger firms employ more debt, than the individual ones. Additionally, it was found that this increase on leverage didn’t cause abnormal negative returns on bondholders, suggesting as explanation, that this growth was provided by the occurrence of higher coverage of the cash-flows.
2.2.2 Transaction Costs
In this framework, firm specific assets1 have lower reutilization in other business and structures, representing a restricted liquidation value in case of default (Balakrishnan and Fox, 1993). Subsequently, debt will be preeminent in supporting non-specific assets acquisitions and, on the other hand, equity will prevail on more focused and specialized businesses (Williamson, 1988).
Since the diversification type is dependent on the characteristics of the resources available, as exposed by Chatterjee and Wernerfelt (1991), unrelated business will point to more non-specific assets, than related businesses organizations. Therefore, the nature of assets, measure of their collateral capacity, will dictate the preferred financial tool – debt or equity.
1 As exposed by Balakrishnan and Fox (1993), this characteristic implies that the utility and output produce by the asset in a determined firm are higher than an alternative best use in other structure.
2.2.3 Agency Costs
Jensen (1986) sets the debt as discipline mechanism of managers and controlling device of free cash-flow available for spending at the discretion of managers. The author also highlights the role of debt in motivating the organizational efficiency, since the firm will conduct more efficient procedures and activities, with the threat of fail to comply with the debt service.
Nonetheless, there are some agency costs along with debt, since managers are agents acting on the behalf of equity holders and bondholders. Therefore, the debt use disadvantages comprises the monitoring expenditures, the increase in bankruptcy costs and also the opportunity wealth loss, to the extent that it influences the investments decisions (Jensen and Meckling, 1976).
Shareholders will endorse the use of debt, constraining the opportunistic behaviours and probably destroying value of diversification strategies held by managers. Therefore, firms with more leverage will conduct lower unrelated diversification strategies.
In the case of companies with foreign operations, the agency costs of debt intensify, because geographic dispersion demands more efforts in the information processing, increasing the costs of monitoring activities. Therefore, bondholders require higher interest rate to meet with the information asymmetries and higher monitoring costs.
After having discussed the theoretical background regarding Capital Structure and specifically its relationship with Diversification Strategies, in section 3, we present some of the empirical studies developed in the field.
3. Related Research – Capital Structure and Diversification
We complemented the theoretical background presented in the previous section with the description of some empirical studies developed in the field of Capital Structure and Diversification Strategies.
Taking into account the aim of the study, the impact of diversification strategies on leverage, previous empirical evidence is presented and discussed accordingly with the type of Diversification strategy.
3.1 Leverage and Product Diversification
Barton and Gordon (1987) first empirical study developed over this matter was an attempt to achieve an integrated view – filling the gap of the financial literature to explain and understand the capital structure and introduce more functional inputs to the strategy ground. In the following year, Barton and Gordon (1988) continued the research, introducing the values and goals of management, based on Andrews (1971) research, which settle the dimensions of corporate strategy as an organizing framework.
Using a sample of American industrial companies still in existence in 1982, which maintain the diversification strategy between 1970-74, the study concludes that the level of debt is different among different strategies of diversification – being unrelated strategies the ones that achieve a higher volume of debt financing, contrarian to single or related diversification.
Other important finding was the link between debt and the level of profits – across all diversification strategies, profit was shown to have a significant negative relationship with debt. This result is consistent with fact that managers want to have flexibility. So, with an increase in profit, firms could be financed by internal generated funds, reducing the level of debt, as it is predicted by Pecking Order Theory discussed in paragraph 2.1.3 (Myers and Majluf, 1984).
Kochhar and Hitt (1998) examine the relationship between corporate strategies and financing types and sources, dividing the diversification strategies into two types – related and unrelated diversification. A company is pursuing a related diversification
when acquires a company which segment is in the same industry or invests in specific assets related to the company’s industry. Unrelated diversification implies acquisition of businesses in different industry groups.
Using a sample of 187 large manufacturing firms traded on the American or New York stock exchange that adopted a diversification strategy during the period of 1982-1986, the study confirmed that financial decisions are influenced by firm diversification strategies. The results supported that related diversification implies more specific assets and businesses, since this is pointed out as more risky from the point of view of fund suppliers, which may lose their investment if the firm bankrupts. This also, linked with constraints to managerial actions faced by the debtholders, introduces higher risk into related diversification strategies. In short, it was found out that equity is preferred for related diversification and debt for unrelated diversification.
Regarding the source of financing (public or private), the results indicate that it is influenced by the form of entry in new business – acquiring an existing firm or through direct entries (internal development). In the case of internal development, since it involves more uncertainty than acquiring an existing business, because of greater information asymmetry, firms tend to rely more on private sources. On the other hand, firms using acquisitions of existing business will use more public sources.
Menendez-Alonso (2003) developed an article to study the effect of diversification on capital structure in a Spanish panel data composed by 480 manufacturing firms, from 1991 until 1994. The results conclude that diversification does not have influence in the leverage ratios for Spanish data during the period in study.
3.2 Leverage and Geographic Diversification
Pursuing the relationship of internationalization strategy and capital structure, Singh and Nejadmalayeri (2004) centred their study in French corporations with best performance from 1996 until 1999. The authors address some research questions in order to understand the differences between domestic and multinational firms in respect to the maturity of debt, the degree of leverage in relation with international diversification and the impact of international strategies over the cost of capital.
The models were constructed assuming a non-linear relationship between financial leverage and internationalization. The rationale behind this assumption is that in the initial stages of internationalization, firms will need to expand their financial resources, but will only have available short-term debt, due higher information asymmetries perceived by investors; then, in a more mature phase of the internationalization strategy, long-term debt will be available, implying a positive relationship between long-term debt and the degree of international diversification. The results support the hypothesis exposed, suggesting a U-shape relationship between the degree of internationalization and short-term debt; it also was reported that international diversification is positively related with total and long-term debt.
In respect of cost of capital, the models suggest that more international firms have higher level of debts, resulting in a reduction of the overall cost of capital. This outcome is sustained by the effect of debt as hedging instrument of the foreign exchange risk, particularly higher in international organizations.
3.3 Leverage and Dual Diversification Strategy
Singh, et al. (2003) explore the relationship of two types of diversification – geographic and product – and their impact on corporate leverage.
According with other authors and respective studies, the two types of diversification produce different effects on the capital structure. Li and Li (1996) support the fact that diversified firms need greater leverage, in order to maximize their value. Although, a considerable number of studies produce evidence showing that domestic firms have more debt emplaced than multinational companies (Senbet, 1979; Michel and Shaked, 1986; Fatemi, 1988; Lee and Kwok, 1988; Burgman, 1996; Chen, et al., 1997).
Using a sample from 1994 to 1996 of non-financial firms with business segments and international operations data available, Singh, et al. (2003) achieved a sample of 1,127 American companies.
It was found that product diversity is on average, unconnected with debt, but could be negatively related in some circumstances. Finally the study also concludes that a dual strategy diversification – product and also geographic – seems to conduct to higher leverage, suggesting that coinsurance effect is present.
3.4 Leverage and New Geographic Area of Operation
In recent years, Joliet and Muller (2013) also study the impacts on capital structure of international strategies, although assessing the degree of internationalization through the type of new geographic area of operation reported by the companies. The sample was categorized by the initial geographic area(s) of operation (domestic firms, firms in developed countries and well-diversified firms) and the new foreign target area (developed, emerging and diversified). This cross-sectional analysis improves previous approaches, since international diversification categorization captures the inherent risks and opportunities among regions, not being only measured through the foreign to total sales ratio.
The main stock indexes were used (American S&P 500 and S&P 400, Canadian TSX, Australian ASX 200, British FTSE 100 and FTSE 250, French SBF 120 and German DAX 30 and MDAX 50), selecting firms that disclose a new geographic area of operation between 1994 and 2004 and achieving 246 firms.
The results lead to three main conclusions: i) independently of the initial geographic diversification of the firm, a new entry in developed countries has no significant impact in the capital structure; ii) companies well-diversified don’t change their capital structure significantly after a new foreign area entry and iii) both domestic firms and firms only active in developed markets significantly increase their debt to equity ratio, when expanding into a region or country where they had no operation before.
3.5 Summary
Most of the studies found strong evidence regarding the impact of diversification strategies in capital structure. Those findings are in general supported by the theoretical field through the Coinsurance Effect (Lewellen, 1971; Kim and McConnell, 1977) and Agency Costs Theories (Jensen and Meckling, 1976; Jensen, 1986; Kochhar, 1996). Table 1 summarizes the samples, variables and main findings of the empirical studies previously exposed and reviewed.
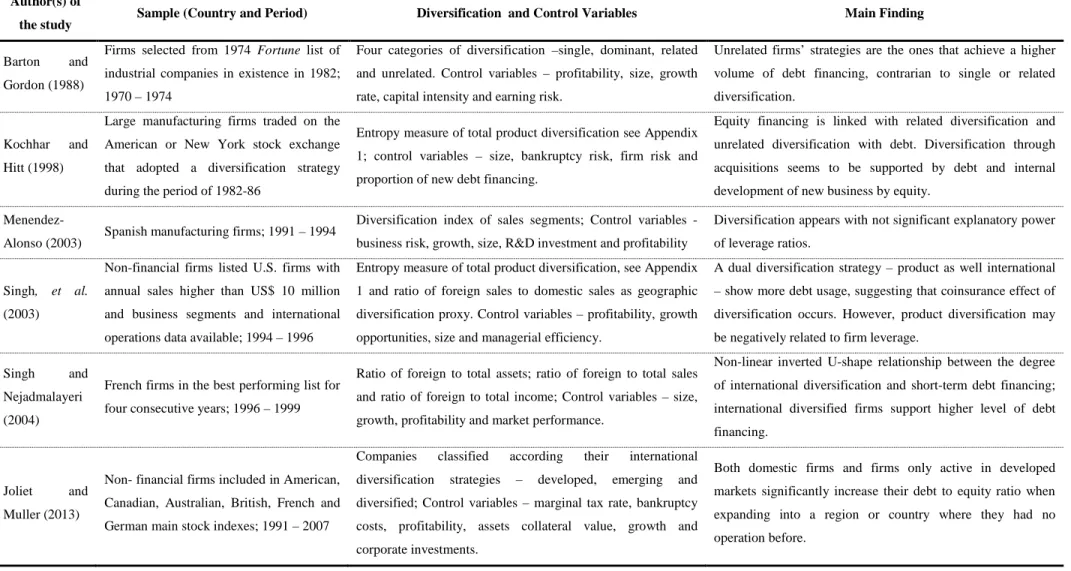
Table 1: Summary of empirical studies about Capital Structure and Diversification Strategies reviewed and main findings.
Author(s) of
the study Sample (Country and Period) Diversification and Control Variables Main Finding
Barton and Gordon (1988)
Firms selected from 1974 Fortune list of industrial companies in existence in 1982; 1970 – 1974
Four categories of diversification –single, dominant, related and unrelated. Control variables – profitability, size, growth rate, capital intensity and earning risk.
Unrelated firms’ strategies are the ones that achieve a higher volume of debt financing, contrarian to single or related diversification.
Kochhar and Hitt (1998)
Large manufacturing firms traded on the American or New York stock exchange that adopted a diversification strategy during the period of 1982-86
Entropy measure of total product diversification see Appendix 1; control variables – size, bankruptcy risk, firm risk and proportion of new debt financing.
Equity financing is linked with related diversification and unrelated diversification with debt. Diversification through acquisitions seems to be supported by debt and internal development of new business by equity.
Menendez-Alonso (2003) Spanish manufacturing firms; 1991 – 1994
Diversification index of sales segments; Control variables -business risk, growth, size, R&D investment and profitability
Diversification appears with not significant explanatory power of leverage ratios.
Singh, et al.
(2003)
Non-financial firms listed U.S. firms with annual sales higher than US$ 10 million and business segments and international operations data available; 1994 – 1996
Entropy measure of total product diversification, see Appendix 1 and ratio of foreign sales to domestic sales as geographic diversification proxy. Control variables – profitability, growth opportunities, size and managerial efficiency.
A dual diversification strategy – product as well international – show more debt usage, suggesting that coinsurance effect of diversification occurs. However, product diversification may be negatively related to firm leverage.
Singh and
Nejadmalayeri (2004)
French firms in the best performing list for four consecutive years; 1996 – 1999
Ratio of foreign to total assets; ratio of foreign to total sales and ratio of foreign to total income; Control variables – size, growth, profitability and market performance.
Non-linear inverted U-shape relationship between the degree of international diversification and short-term debt financing; international diversified firms support higher level of debt financing.
Joliet and Muller (2013)
Non- financial firms included in American, Canadian, Australian, British, French and German main stock indexes; 1991 – 2007
Companies classified according their international diversification strategies – developed, emerging and diversified; Control variables – marginal tax rate, bankruptcy costs, profitability, assets collateral value, growth and corporate investments.
Both domestic firms and firms only active in developed markets significantly increase their debt to equity ratio when expanding into a region or country where they had no operation before.
The previous studies have focused on samples from America and some European countries, namely French and Spain. However, the impact of Diversification Strategies on Leverage has not, so far, being studied for Portugal. Our study aims to contribute to fill the gap in the literature with an empirical research to study the effect of Diversification Strategies on Capital Structure of listed Portuguese companies.
4. Hypotheses Development and Research Design
This section presents the research questions and the methodology adopted in our study, being firstly developed the hypotheses and then the empirical models along with variables construction.
4.1 Research Hypotheses
As discussed in the previous section, the literature highlights the fact there is not a unique and single perspective capable of incorporate all the important determinants in the capital structure dynamic process. In fact, several elements have to be considered to construct a useful and effective explanatory model – the tax benefits and the financial distress costs of debt; the agency costs of debt and equity and the signalling effect of debt. Those elements capture the essence of the main building blocks of capital structure theory – the traditional Trade-off and Pecking Order theories, the agency cost and imperfect information approach and the signalling models.
Bearing in mind the aim of this study, the usefulness of diversification in explaining the capital structure for listed Portuguese companies, we introduce this managerial input as a strategic viewpoint in the study of capital structure.
Leverage and Product Diversification
In light of Coinsurance Effect, firms with uncorrelated cash-flows from different businesses and segments will have more debt capacity (Lewellen, 1971). Singh, et al. (2003) also found evidence of the Coinsurance Effect of diversification in the debt usage. Other studies report higher Leverage for unrelated diversification (Barton and Gordon, 1988; Kochhar and Hitt, 1998). Therefore, it is expected a positive relationship between Leverage and the degree of the Product Diversification. Based on these arguments, we formulated the following hypothesis:
H1: Leverage is positively related with Product Diversification
Leverage and Geographic Diversification
Taking into account agency costs theory perspective of Jensen and Meckling (1976), firms with more disperse activities increase the agency costs of debt, such as
information asymmetries between bondholders and shareholders and costs of monitoring their performance. Accordingly, geographic diversification implies higher agency costs of debt, reducing the debt usage, as it was found out by Singh, et al. (2003). Other authors also found evidence that domestic firms have more debt than multinational ones (Senbet, 1979; Michel and Shaked, 1986; Fatemi, 1988; Lee and Kwok, 1988; Burgman, 1996; Chen, et al., 1997). As a result, Leverage is related with Geographic Diversification.
Furthermore, Singh and Nejadmalayeri (2004) argue that, in the initial stages of international diversification, firms will demand debt to face their financial needs, since other sources will only be available in a more mature phase of the international strategy, when the information asymmetries perceived by investors reduce. So, it is expected a non-linear, specifically inverted U-shape, relationship between Leverage and the degree of Geographic Diversification. Based on these arguments, we formulated the following hypothesis:
H2: Leverage has an inverted U-shape relationship with Geographic Diversification
4.2 Empirical Models
Likewise other studies that adopted a similar approach (Barton and Gordon, 1988; Kochhar and Hitt, 1998; Menendez-Alonso, 2003; Singh, et al., 2003; Singh and Nejadmalayeri, 2004; Frank and Goyal, 2009) this study of the capital structure determinants will apply a regression analysis.
To test the hypotheses developed in the previous section, we use a multiple linear regression model which settles relationship between Leverage, the dependent variable, and the explanatory or independent variables.
4.2.1 Panel Data Models
Regression analyses might be based on time series, sectional or panel data. The first ones are related with observations of a variable in different time periods; sectional data, it deals with data obtained in the same point of the time period; as respects to panel data, it is composed by multi-dimensional observations obtained over several time
The panel data assembles several advantages over sectional or time-series data, such as the possibility of gathering more information, larger samples and more accurate statistical inference in hypotheses testing, because it generally contains more degrees of freedom and sample variability (Hsiao, 2006). Based on the above, we used a panel data model in the current study as exposed in the section 4.2.2.
In furtherance of panel data estimations, the most common approaches are the Pooled Regression (OLS - Ordinary Least Squares) or static panel data model admitting the existence of unobservable individual effects random or fixed. The OLS method is suggested as the most simple, although each observation is considered as an independent unit, in spite of the transversal and temporal dimension of panel data.
As regards to the Fixed Effect Model, it admits that the unobservable individual effects are constant and correlated with the independent variables. Similarly, the model assumes that the differences in the company’s specificities and overtime can be captured through a constant term (Johnston, 2001).
By contrast, the Random Effect Model the unobservable individual effect is not correlated with the independent variables. Therefore, in this specification the differences in the company’s specificities and overtime are unknown, unobservable and not measured (Marques, 2000).
The main challenge in panel data estimations is to adopt the appropriate methodology, able of controlling the impact of the unobserved heterogeneity (Hsiao, 2006).
In order to choose between fixed or random effects, Mátyás and Sevestre (2008) identified two main questions – i) the study purpose and ii) the context and sample selection and its environment. Marques (2000) exposes that if the study is designed to statistically infer about a particular individual unit (e.g. a specific group of countries) the fixed effects estimator will be more consistent and efficient.
On that account, we applied the Hausman Test1 to select which is the appropriate estimator for the sample in study, i.e. select the fixed effect which admits the existence of correlation between the unobservable individual effects and the explanatory variables or adopt a random effect estimator which recognizes no correlation between them.
4.2.2 The Model
To test our hypotheses H1and H2we estimate the following regression model, presented in equation (4.1), representative of the basic panel data model, as previously discussed.
In order to isolate other influences on the firms’ capital structure, control variables will be used, following the inputs provided by Pecking Order theory and Trade-off theory and the similar studies reviewed in the previous section (Barton and Gordon, 1988; Kochhar and Hitt, 1998; Menendez-Alonso, 2003; Singh, et al., 2003; Singh and Nejadmalayeri, 2004; Frank and Goyal, 2009).
The model to be estimated is:
ࡸࡱࢂ࢚= + ∗ ۾܀۽۲۲۷܄࢚+ ∗ ۵۳۽۲۷܄࢚+ ∗ ܁܀۵۳۽۲۷܄࢚+ ∗ ۾܀۽۴࢚+
∗ ܂ۯۼ۵࢚+ ∗ ܁۷܈۳࢚+ ૠ∗ ۵܀۽܅ ܂۶࢚+ ૡ∗ ۳۴۴۷۱۷۳ۼ۱܇࢚+ ࢿ࢚ (4.1)
Wherein:
- LEVitdenotes Leverage for the company i in the year t. The choice of the Leverage indicator is crucial for the research design, since different measures of Leverage could lead to different results. As argued by Rajan and Zingales (1995) study of Leverage for international panels, the ranking of most leveraged countries changes across measures. So, empirical studies have not unequivocally concluded that one of the measures is more useful. Those authors also argue that when the purpose is to study the effect of financing decisions, the ratio of total debt to capital (debt plus equity) will be the most adequate variable. On the other hand, those authors also pointed out that ratios using total assets as deflator could fail, because some assets are used to offset non-debt liabilities, such as trade receivables. Considering that, debt ratios calculated using total assets are influenced by industrial specifications which affect the level of trade receivables, as well as accounts payable. Therefore, ratios unaffected by the gross level of trade credit or other changes in assets not related to financing decisions are a preferred measure. Consequently, we measure the firm’s leverage through three debt ratios – total debt, long-term debt and short-term debt ratios – computed using each level of debt deflated by the sum of book value of
debt2 and the market value of equity, expressed by the market capitalization at year end. As a result, we have three variants of the regression (4.1) for each measure of Leverage.
- PRODDIVit is the Product Diversification for the company i in the year t, measured through the segment report of sales disclosed in the annual financial statements of the companies, applying the Entropy Measure of Diversification, as showed in Appendix 1 (Jacquemin and Berry, 1979). This measure was also used by Kochhar and Hitt (1998) and Singh, et al. (2003). Firms focused in a single segment will have diversification indexes with zero value; as long as the diversification increases, i.e., the dispersion of sales among relevant segments is higher, the entropy measure will raise. As exposed in H1, it is expected a positive relationship between Leverage and Product Diversification, and as such its coefficient to be positive.
- GEODIVit is the Geographic Diversification for the company i in the year t; being measured also applying Entropy Measure of Diversification, as per variable PRODDIVit and with the same behaviour, but using Geographic segment report of sales. We do not predict any signal for this coefficient as it has been incorporated to study non-linearities between Leverage and Geographic Diversification. Consequentially, this variable should be analysed together with the variable SRGEODIVit, presented below.
- SRGEODIVit is the square ratio of GEODIVit, measured by the square ratio of geographic entropy measure, adopting a similar approach to the one used in Singh and Nejadmalayeri (2004). This variable is introduced to study possible non-linear relationships between Leverage and Geographic Diversification. As such, recalling H2, an inverted U-shape relationship between Leverage and Geographic Diversification, it is expected its coefficient to be negative.
Control Variables
- PROFitis the Profitability for the company i in the year t. In this study, we used the proxy Return on Assets (Earnings before interest and taxes/ Total Assets), since it is
2 The market value of debt would be a more accurate measure. However, to achieve it, maturity dates and interest rates will be needed, implying a smaller sample to have that information available. Additionally, Bowman (1980) and Titman and Wessels (1988) found evidence of a large cross-sectional correlation between market value of debt and its book value.
considered an efficient variable, on account of being correlated with additional return measures (Bettis, 1981). Myers and Majluf (1984) defend that firms prefer internal funds, rather than external financing, leaving the choice of the Leverage level dependent on the investment opportunities and the cash flow available. In this way, more profitable firms will have more retained earnings (ceteris paribus) to finance their growth, having lower Leverage. Adversely, analysing the trade-off between tax advantage of debt and the Leverage related costs, other authors, Kraus and Litzenberger (1973), Bradley, et al. (1984) and Hillier, et al. (2011), proposed a contrary expected relationship between profitability and debt. According to Trade-off theory, discussed in the section 2.1.2, firms with better performance will attempt to reduce the taxes from its positive earnings, using deductible interest expenses. Finally, the signalling effect of debt, previously exposed in the section 2.1.4, also contributes to a positive expected relationship between Profitability and Leverage, because issuance of debt signs the capability of the firm comply with future debt payments, being an efficient way to adjust the information asymmetries between stakeholders over firm’s performance. Despite the contradiction in the literature, we expected a negative relationship between Profitability and Leverage, following the findings present in the previous studies - Barton and Gordon (1988), Singh, et al. (2003), Singh and Nejadmalayeri (2004), Joliet and Muller (2013) and Frank and Goyal (2009).
- TANGit is the Asset Tangibility for the company i in the year t, incorporating the value of assets in place that might be used as debt collateral, measured through the ratio of Property, Plant and Equipment to Total Assets, also used, among others, in Frank and Goyal (2009). The Asset Tangibility captures the possible debt collaterals and consequently the value liquidation of firm in case of bankruptcy. As a result, it is expected that the possession of relative high tangible assets will improve debt capacity, since debtholders will perceived a lower risk, reducing the agency costs of debt. Therefore, we incorporated Assets Tangibility to analyse this positive expected relationship, as in similar studies (Myers, 1984; Barton and Gordon, 1988; Singh, et al., 2003; Frank and Goyal, 2009) and expect its coefficient to be positive.
for the size variable the logarithm of assets. Also in which concerns this variable, Pecking Order theory and Trade-off theory have opposite perspectives in respect to Firm Size. Based on Pecking Order theory (Myers and Majluf, 1984), exposed in section 2.1.3, as well as Titman and Wessels (1988) is expected a negative relationship, since smaller firms have higher costs in equity issues than larger ones and are consequently predisposed to use more debt. Contrarily, from Trade-off theory, it is expected a positive relationship, because firms with more robust structure will be able to reduce the transaction and agency costs, being able to trade larger blocks of debt. We expect a positive relationship between Leverage and Firm Size, as reported by Singh, et al. (2003), Singh and Nejadmalayeri (2004) and Frank and Goyal (2009).
- GROWTHit represents the Growth Opportunities for the company i in the year t. As Rajan and Zingales (1995), Singh, et al. (2003), Singh and Nejadmalayeri (2004) and Joliet and Muller (2013), we use Market-to-book Ratio as a proxy for growth opportunities, being determined through the ratio of the Enterprise Value3 to Total Assets. As it was pointed out by Myers (1977), growth opportunities could be postponed or eventually wasted, when firms have their cash-flows restricted to ensure debt commitments. Based on that, we expect a negative signal for the coefficient of Growth Opportunities.
- EFFICIENCYitis the Managerial Efficiency for the company i in the year t. We use the amount of revenues generated for each euro of assets as a proxy of the Managerial Efficiency, that is Asset Turnover ratio (Sales to total Assets), consistent with Singh, et al. (2003). Firms less efficient than others will require more management restraint devices. Knowing that debt is as disciplinary mechanism of managers and controlling device of free cash-flow, it is expected a negative relationship between Leverage and Managerial Efficiency, as it was reported by Singh, et al. (2003).
- β0,β1,β2, ….,βk are the Regression Coefficients;
3Enterprise Value is computed through the Fiscal Period End Market Capitalisation, plus Preferred Stock, plus Minority Interest, plus Total Debt, minus Cash.
- εit is the estimation error which complies with the classical assumptions of models estimated by OLS technique.
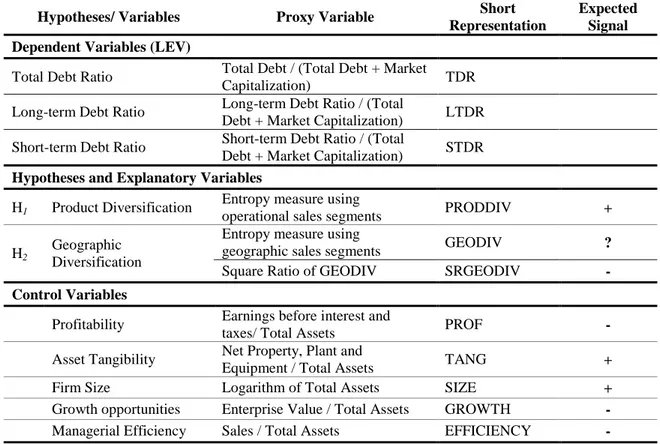
Table 2 summarizes the dependent variables, explanatory and control variables, hypotheses, variable proxies used in this study and its expected signal on leverage.
Table 2: Summary of the dependent and independent variables and expected relationship with Leverage.
Hypotheses/ Variables Proxy Variable Short Representation
Expected Signal Dependent Variables (LEV)
Total Debt Ratio Total Debt / (Total Debt + Market Capitalization) TDR Long-term Debt Ratio Long-term Debt Ratio / (Total
Debt + Market Capitalization) LTDR Short-term Debt Ratio Short-term Debt Ratio / (Total
Debt + Market Capitalization) STDR
Hypotheses and Explanatory Variables
H1 Product Diversification
Entropy measure using
operational sales segments PRODDIV + H2
Geographic Diversification
Entropy measure using
geographic sales segments GEODIV ? Square Ratio of GEODIV SRGEODIV -Control Variables
Profitability Earnings before interest and
taxes/ Total Assets PROF
-Asset Tangibility Net Property, Plant and
Equipment / Total Assets TANG + Firm Size Logarithm of Total Assets SIZE +
Growth opportunities Enterprise Value / Total Assets GROWTH
-Managerial Efficiency Sales / Total Assets EFFICIENCY
-Note: As referred in the definition of LEVitvariable, firms Leverage was measured through the three debt ratios summarized in this table.
We present in this section the research hypotheses and the models for testing them. In next section, we present the sample and data collection, as well as its descriptive statistics.
5. Sample Selection and Descriptive Statistics
Our research analyses the impact of Diversification on Leverage. We have focused the selection of our sample on Portuguese companies listed on Euronext Lisbon. The reason for this choice comes from the fact that, as far we know, no previous research in the field of Leverage and Diversification has been carried out using Portuguese data.
Section 5.1 presents the sample selection and data collection. Descriptive statistics of the sample used in this study are displayed and discussed in section 5.2.
5.1 Sample Selection and Data
The data of the annual reports and disclosures of segment information were collected from DataStream database of Thomson Reuters for listed Portuguese companies on Euronext Lisbon in 2015.
Financial companies were excluded, since they have specific regulations applied to their capital structure as well as companies with year-end different from 31st of December, constructing a panel data with annual frequency from January until December of each year.
Our sample period extends from 2003 to 2013, since we considered relevant to include the most recent data available, thus, the sample is composed by observations until 2013; on the other hand, as a result of the current financial crisis, beginning in 2008 (Grouhy, et al., 2008), the time period window was expanded incorporating five years before, in order to capture a pre-crisis period.
The final sample was computed eliminating observations with no data available for the variables in study, achieving a final sample of 35 companies4, representing 203 company-year combinations.
5.2 Descriptive Statistics
5.2.1 Global Characterization of the sample
Table 3 reports the number of firms in sample by industry in accordance with two-digits SIC Code5.
Table 3: Sample distribution across industries.
Industry Companies Obs. % Obs.
Business Services 3 23 11%
Communications 4 22 11%
Food Stores 2 20 10%
Heavy Construction, Except Building Construction - Contractors 4 19 9% Lumber and Wood Products, Except Furniture 2 18 9%
Paper and Allied Products 3 17 8%
Electric, Gas and Sanitary Services 2 16 8% Stone, Clay, Glass, and Concrete Products 2 14 7%
Eating and Drinking Places 1 9 4%
Wholesale Trade - Durable Goods 1 9 4%
Amusement and Recreation Services 1 6 3%
Petroleum Refining and Related Industries 1 6 3% Printing, Publishing and Allied Industries 2 6 3%
Transportation Equipment 1 6 3%
Food and Kindred Products 2 5 2%
Wholesale Trade - Nondurable Goods 1 4 2% Hotels, Rooming Houses, Camps, and Other Lodging Places 1 1 0%
Primary Metal Industries 1 1 0%
Real Estate 1 1 0%
Total 35 203 100%
Note: Industries correspond to the Two-digit SIC Code.
Table 3 shows that the observations are distributed along several sectors, being the ones with more percentage Business Services and Communications with 11% of the total panel each one. Consequently, no influence is expected from the industry.
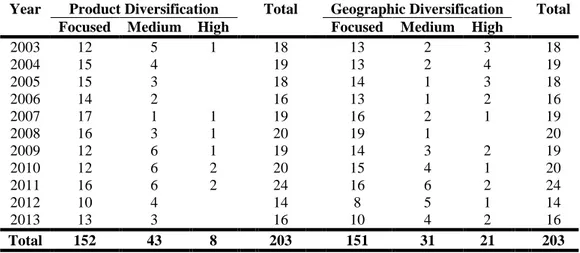
The sample was broadly divided into two groups as presented in Table 4, taking into account the two types of diversification strategy – product and geographic – using the segment report of sales and computing the Entropy Measure of Diversification for each type, applying the formula on the Appendix 1.
Table 4 reveals that most of the current listed Portuguese companies are in average focused in a single segment for both Product and Geographic strategies. Regarding
Geographic Diversification, the number of companies highly diversified is higher than within Product Diversification group.
Table 4: Breakdown of the sample within each type of diversification, using Entropy Measure of
Diversification Index.
Year Product Diversification Total Geographic Diversification Total Focused Medium High Focused Medium High
2003 12 5 1 18 13 2 3 18 2004 15 4 19 13 2 4 19 2005 15 3 18 14 1 3 18 2006 14 2 16 13 1 2 16 2007 17 1 1 19 16 2 1 19 2008 16 3 1 20 19 1 20 2009 12 6 1 19 14 3 2 19 2010 12 6 2 20 15 4 1 20 2011 16 6 2 24 16 6 2 24 2012 10 4 14 8 5 1 14 2013 13 3 16 10 4 2 16 Total 152 43 8 203 151 31 21 203 Notes:
If the Entropy Measure of Diversification index is 0, the company is focused in a single segment, having no diversification, referred to as “focused”; indexes between 1 and 1.5 represent firms with medium diversification (“medium” column); being high diversification showed by ratios higher than 1.5 (“high” column).
Graph 1 presents the evolution of the debt ratios, different proxies for our dependent research variables, for the sample in the study.
Graph 1: Sample Average Leverage evolution between 2003 and 2013.
On average, companies have more than 50% of the capital structure composed by debt, except in the years from 2004 until 2007.
Graph 2 displays the average composition of the capital structure of the sample. 0% 10% 20% 30% 40% 50% 60% 70% 2003 2004 2005 2006 2007 2008 2009 2010 2011 2012 2013
Average Long-term Debt Ratio Average Short-term Debt Ratio Average Total Debt Ratio
Graph 2: Average composition of Sample Capital Structure between 2003 and 2013.
From 2003 until 2007, on average the equity slice of the capital structure increased. In the period of the 2008 financial crisis, from 2008 until the present, the equity financing was replaced by long-term debt. As respect of short-term debt, 2003, 2004, 2008, 2011 and 2013 were the years with higher significance; although, it remains more or less constant over the period under review.
Graph 3 presents the evolution of the Debt to Gross Operating Surplus Ratio for the period under review for Non-Financial companies in several European countries and United States of America.
Graph 3: Non-financial corporations’ debt to gross operating surplus ratio, between 2003 and 2013.
Source: Organisation for Economic Co-operation and Development (OECD).
Debt is the sum of securities other than shares, except financial derivatives, loans and other accounts payables. Gross operating surplus is the measure of Earnings before interest and depreciation and amortizations and taxes. A ratio of 2.5 means that debt outstanding is 2.5 times larger than the gross
0% 10% 20% 30% 40% 50% 60% 70% 80% 90% 100% 2003 2004 2005 2006 2007 2008 2009 2010 2011 2012 2013
% Long-term Debt % Short-term Debt % Market Capitalization
France Germany Greece Ireland Italy Portugal Spain United Kingdom United States 0 1 2 3 4 5 6 7 8 9 10 2003 2004 2005 2006 2007 2008 2009 2010 2011 2012 2013