The Effect of Corporative Diversification on the Capital Structure of
Brazilian Firms
1Jandir Nicoli Junior
Master in Business Administration Department of Management, FUCAPE Business School E-mail: [email protected]
Bruno Funchal
Ph.D. in Economics Department of Management and Accounting, FUCAPE Business School E-mail: [email protected]
Received on 11.28.2012 - Accepted on 3.14.2013 - 2nd version accepted on 5.22.2013
ABSTRACT
This study aims to determine whether corporate diversification increases the borrowing capacity of Brazilian companies by means of cross-pledging. Using a panel data model, we estimated the relationship between leverage and the degree of corporate diversification using a sample of companies listed on the São Paulo Stock Exchange (Bovespa) between 2009 and 2011 and Brazilian companies with access to international markets through American Depositary Receipts (ADRs) in the period 2003-2011. Using empirical tests, we found no rela-tionship between diversification and debt in either sample, indicating that a strategy of corporate diversification should not be used as a strategy to expand a company's financing capacity.
Keywords: Cross-pledging. Corporate diversification. Capital structure.
1 INTRODUCTION
Following the earliest studies of Modigliani and Mil-ler (1958), the choice of capital structure has been a cen-tral theme in finance research, and the use of debt in this context is essential to finance the growth of many firms. However, very indebted firms may face difficulties in obtai-ning external resources for new investment opportunities. Corporate diversification can provide advantages for firms funding and investment.
There are theoretically two potential benefits to fir-ms of exploring different business lines. First, diversi-fied firms can transfer scarce capital among divisions to finance some projects at the expense of others (Willia-mson, 1975; Stein, 1997; Matsusaka & Nanda, 2002). Se-cond, the imperfect correlation effect between the cash flows of these divisions or projects reduces the risk of default and increases the firm's collateral, resulting in greater access to credit (Diamond, 1984; Lewellen, 1971, Stein, 2003). This effect is called "cross-pledging" by Tirole (2006), meaning that firms can use the income they receive from a successful project as collateral for the financing of another, provided that the projects are independent (Diamond, 1984.)
Nonetheless, Lang and Stulz (1994) and Servaes (1996) have shown that the value of conglomerates may be dis-counted compared to firms that keep activities focused on their core business. In Brazil, the most recent study was conducted by Carvalho, Maia and Barbedo (2012). For the conventional wisdom, this decline happens because an increase in the number of segments generates agency problems and exacerbates the internal distortion of capital (Berger & Ofek, 1995; Shin & Stulz, 1998; Rajan, Servaes, & Zingales, 2000; Scharfstein & Stein, 2000).
Recent empirical studies have focused on how diver-sification offers firms financing and investment advan-tages (Hubbard & Palia, 1999; Campelo, 2002; Hovaki-mian, 2011). The results of these studies indicate that efficiency in the allocation of internal resources allevia-tes credit constraints generated by adverse external ma-rket conditions. According to the authors, under such adverse conditions, diversification can provide invest-ment advantages in that diversified firms can choose to allocate scarce resources to one project in preference to a less cost-effective one.
With regard to financing advantages, previous re-sults show that in times of financial crisis, conglomera-tes are significantly more leveraged than focused com-panies (e.g., Dimitrov & Tice, 2006; Yan, Yang, & Jiao, 2010; Kuppuswamy & Villalonga, 2010). This fact is ex-plained by diversification in corporate projects, which provides a type of insurance to investors against adver-se market conditions. Thus, in general, previous stu-dies have concluded that from a statistical perspective, diversified firms are more leveraged than focused firms (Berger and Ofek, 1995; Ahn, Denis & Denis, 2006). However, Comment and Jarrell (1995) questioned the empirical validity of these results due to the low
eco-nomic significance in the association between leverage and diversification when the latter is measured using the Herfindahl index.
The broader issue that this paper sets out to address is therefore whether corporate diversification increases the financing capacity of Brazilian companies through the potential use of the cash flow income of divisions or projects as collateral to finance new investment op-portunities.
Note that the contribution of this work is to investigate whether diversified firms are actually more leveraged than focused firms, not only considering periods of financial crisis but also analyzing in a systematic way, which would serve as a policy tool for business financing. Furthermo-re, we seek to add to discussions in the literature on the benefits of corporate diversification in Brazil, highlighting the effects of diversification on market value and corpo-rate performance (Carvalho, Maia, & Barbedo, 2012) and addressing the possibilities generated by expanding the borrowing capacity of firms.
The cross-pledging test was conducted using a panel of 335 Brazilian companies listed on Bovespa between 2009 and 2011, providing a total of 559 observations. The time period is limited to the years 2009-2011 becau-se the companies listed on the exchange have only been required to provide specific information about operating segments since CPC 22. Given this limitation, to test the stability of the results for the period under review, a robustness test was conducted only for ADR Level II and III companies that were listed on the U.S. market for the period 2003 to 2011, totaling 191 observations. This group of companies reported such information by segment according to the requirements of the Securities and Exchange Commission (SEC).
The financial data for the present study were collected from the Economática database, and other information ne-cessary to calculate diversification measures was manually extracted from Form 20-F and the annual Standardized Fi-nancial Statements (SFS) of each company, available from the Bovespa website.
The econometric procedure used throughout the stu-dy was a panel model with double fixed effect. The gene-ral result was that no significant relationship was obser-ved between diversification and the financing capacity of firms using cross-pledging. This result shows that in the Brazilian economic environment, companies have still not been able to translate the benefits of corporate diversifica-tion into their capital structure, which helps to reduce the incentive to form conglomerates. Diversification should therefore not be used as a strategy to expand the financing capacity of a business.
2 THEORETICAL MODEL
Holmstrom and Tirole (1997) developed a model in which a firm would have incentives to diversify. This model allows the benefits of diversification to be analyzed in the case of two or more independent pro-jects. The model presented below can also be found in Tirole (2006).
2.1 Leverage with Diversification:
Cross-Pledging.
As assumptions for the model, every entrepreneur is risk-neutral and has an initial asset level that will be used in conducting an investment project. If successful, the pro-ject will generate returns R > 0, but in case of failure, the project will not produce income, i.e., R = 0. The probability of success is represented by p.
Each project requires a fixed investment of I; however, it is assumed that the initial assets of the business are insu-fficient to carry out the project, therefore, A < I. Thus, all entrepreneurs must borrow I-A from lenders to implement their projects.
Every project is subject to moral risk, i.e., the entre-preneur can choose to make a great effort, increasing the likelihood of project success (pH), or he can make less of an effort, reducing the likelihood of project success (pL). If the entrepreneur chooses a low level of effort, he receives benefits (usually non-pecuniary) as defined by
B > 0 (measured in monetary units)2. Note that the
pro-bability of success when there is greater effort is strictly higher than when low effort is made (Δp= (pH – PL) > 0), and that while the result of the project is negotiable and observable, the choice of effort level on the part of the entrepreneur is not.
On the credit-supply side, lenders are in a compe-titive environment and are risk-neutral. For simplici-ty, it is assumed that the interest rate is zero. The loan agreement stipulates how the profit is divided between lenders and borrowers. The borrowers are protected by limited liability, i.e., their income cannot assume nega-tive values, and both sides receive 0 in case of failure. In the case of success, the two parties share the profit R, where Rb goes to the entrepreneur, and R1 goes to lenders.
Because the contract may only rely on observable va-riables, an incentive mechanism for the entrepreneur is de-fined based on receipts in the event of success. Thus, the entrepreneur should receive Rb if successful and 0 in the case of failure. For lenders, the expected value of the receipt must compensate the loan amount3:
pHR1 = I – A. 1
Thus, the interest ratei is given as follows:
R1 = (1 + i)(I – A) 2
The loan agreement must be structured to indu-ce the entrepreneur to behave appropriately. Thus, the
expected gain of the entrepreneur should be greater if he chooses to make greater effort than if he chooses to make less effort (this restriction is called the incentive compatibility constraint), which can be represented by the following relation:
2 Examples of the beneits usually observed in practice are retrenchment tactics, ease of project implementation, hiring of people connected with the manager and perks. 3 This equality is a direct result of the assumptions of risk neutrality and a competitive market.
4 This condition is the result of the inequality in the expected return (7) relative to the expected return in case of greater effort in only one project or in neither project.
The highest income in the event of success that can be offered to lenders without compromising the entrepreneur’s incentives is therefore determined as follows:
Rl = R – Rb = R - B 4
Δp
The expected value of the cash flow generated by the project that can be given to the lender is therefore calculated as follows:
PH R- B 5
Δp
To finance a project, lenders should receive as collate-ral an amount as defined in (5) that is at least equal to the amount that was borrowed, I - A. This condition is called the participation constraint:
PH R- > I – A B 6 Δp
However, thus far, this relation is only a necessary con-dition for the financing of companies' investment projects. How would such a financing condition be modified by the inclusion of other investment projects?
To understand how borrowing capacity can be increa-sed through diversification, consider two identical and in-dependent projects and investments with fixed investments of the same size I. The same premise conditions as descri-bed above would be maintained.
In assuming both of the financed projects, the entre-preneur can commit to making great effort in both, in only one or in neither of the projects. There are three pos-sible outcomes: both of the projects succeed (R2), only one of them is successful (R1), or neither is successful (R0). For both of the projects to be carried out, it is necessary for the entrepreneur's incentive to be sufficient for him or her to exert great effort in both of the projects. Thus, the ex-pected return of the projects can be described as follows:
pHR2 + 2pH (1 – pH)R1 + (1-pH)2R
0 7
2
When considering two projects in a single firm, the income from one project can be used as collateral for the other project. With respect to the loan agreement, consider a contract such that the borrower is rewarded only when both projects are successful:
R2 > 0, R1 = R0 = 0,
i.e., there is an optimum incentive scheme that rewards the manager only in case of complete success. With an op-timum incentive system, the incentive compatibility cons-traint that guarantees the borrower's effort in working on both of the projects is calculated as follows4:
Rb2 > 2B 8 Δp(pH + PL)
The expected value of project cash flow that can be pledged as security for the lender is therefore
pHR + pHR - p2 HR2b:
pH R - > I – A pH 9 pH + PL
B Δp
Note that < 1, and thereforepH
pH + PL
pH R - > ppH H R - > I – A 10 pH + PL
B Δp
B Δp
which ensures that the cash flow generated by the two inde-pendent projects has the power to increase the capacity of business financing (first inequality of (10)).
Cross-pledging therefore facilitates funding. However,
Debt = α + β (diversification) + ε, 11 the benefits of cross-pledging arise as a result of the diver-sification effect. The main argument is that because of the independence of projects, the entrepreneur (borrower) can pledge the income of one project as collateral for a second project that may fail. Thus, the funding in ques-tion establishes obligaques-tions on individual (non-related) projects because when projects are correlated and fail, in-come is worthless.
Thus, we may expect that firms with diverse pro-jects tend to increase their indebtedness. We want to test in practice the reduced form of the following rela-tionship:
and we expect to find β > 0, indicating this positive rela-tionship between diversification and indebtedness.
3 METHODOLOGY
A panel data model with fixed double effects was used in this study. Fixed effects estimation was selected with a view to considering unobservable and time-invariant individual characteristics (fixed effect in cross-section) and common shocks to firms over time (temporally fi-xed effects), which can contribute to the variability of the selected dependent variable. The random-effects model was also considered as an alternative. Despite its estimator being more efficient because it does not gene-rate consistent estimators for construction5 as the fixed
effects model does, we used the Hausman test to ensure the model’s statistical consistency.
To answer the main question of this research, i.e., whe-ther corporate diversification increases the financing ca-pacity of firms through cross-pledging, a relationship be-tween the degree of diversification and leverage should be found. In this analysis, the dependent variable is the debt, represented by the natural logarithm of the sum of all of the short- and long-term balance debts, and the degree of diversification represents an explanatory variable.
The degree of diversification was defined in two steps, the first being the number of segments that the firm re-ports and the second and most important being the firm’s Herfindahl index. The index is the sum of the squares of the percentage of net revenue for each reportable segment. Thus, if there is only one segment, the index is equal to one, and the index will be closer to zero for more diverse firms.
This methodology is similar to that used by Lang and Stulz (1994), Comment and Jarrell (1995) and Berger and Ofek (1995), all seminal studies on corporate diversifica-tion. The Herfindahl index is calculated as follows:
HHI = Σi=1 Pi 12
p
n 2
5 The estimator-consistency property ensures that the estimated sampling parameter converges with the true population parameter for suficiently large samples.
6 The information is presented in accordance with CPC 22 (IFRS 8). An operating segment is a component of an entity that engages in business activities from which it may earn revenue and incur expenses and for which the operating results are regularly reviewed by the chief operating manager of the company responsible for decision-making and to whom individualized inancial information is available.
7 The 20-F is a report that follows the rules of the Securities and Exchange Commission in which irms report standardized information.
ment6, and P is the total net revenue of firm i in year t. Data on
net revenues by segment for the initial sample were collected in the explanatory notes disclosed in the annual Standardized Financial Statements (SFS) of each company; however, for the subsample, the data were manually collected for each firm and year from the 20-F report7.
For the cross-pledging test, the following regression equation is therefore proposed:
Debtit = αi + β1hhiit + β2Segit + δControlsit + εit 13 where:
Debtit - dependent variable, is the natural logarithm of the sum of all short- and long-term balance debts;
αi - model constant;
β - represents the independent-variable coefficient, i.e., the expected change in the dependent variable for a unit of change in the independent variable;
Seg - explanatory variable that represents the degree of diversification of company (i) in time period (t);
hhi - explanatory variable that represents the degree of diversification of company (i) in time period (t);
Controlsit - represents the control variables used in the model, being the attributes of company (i) in time period (t);
εit - represents the regression error in time period (t). Other factors that can determine the borrowing capa-city of firms were also considered. The following factors and control variables used to represent these factors were considered:
Growth opportunities. For Myers (1977), very levera-◆
ged firms are more likely to pass up good investment opportunities. Thus, firms with future growth expec-tations should maintain a minimum level of debt on their balance sheets. For Lang, Ofek, and Stulz (1996), firms with more valuable growth opportunities tend to be less leveraged. Therefore, we expect a negative relationship between leverage and growth opportu-where is the number of segments that the company
seg-nities. Price to Book was used as a proxy for growth opportunities.
Size. Larger companies tend to have a higher degree ◆
of diversification and lower risk of bankruptcy, which results in more access to credit (Lewellen, 1971; Stein, 2003; Rajan & Zingales, 1995; Rajan et al., 2000). To represent company size, the natural logarithm of the total assets of a given company was used.
Tangibility. Araujo, Ferreira, and Funchal (2012) ◆
argue that tangible assets are easier to leverage, thus having a direct effect on a firm’s debt characteristics. Rajan and Zingales (1995) also consider that the tangible assets of the firm can be used as security (collateral) for lenders; thus, companies with larger amounts of assets would be more leveraged. Tangi-bility was calculated as the ratio between the firm's fixed and total assets.
Profitability. Rajan and Zingales (1995) argue that ◆
more profitable firms tend to be more leveraged. For these authors, lenders are more willing to enter into loan agreements with more profitable companies be-cause these ratios reflect the operational results of the company. In addition, more profitable firms can raise their level of indebtedness due to the fiscal benefits of this source of financing (Myers, 1984). Profitability is represented by the return on assets (ROA) indicator, calculated as the ratio of Earnings Before Interest and Taxes (EBIT) to the total assets.
Risk of bankruptcy and liquidity. Companies with ◆
more liquidity problems face greater risks of bankrup-tcy (Araújo, Ferreira, & Funchal, 2012). Thus, riskier firms tend to be less leveraged because they have a higher probability of default, reducing the availability of external credit. According to Araújo et al. (2012), the risk of bankruptcy and liquidity was calculated as the ratio between the earnings before interest and taxes (EBIT) and the financial expenses.
3.1 Data and Sample.
The empirical cross-pledging test was conducted using two groups of companies. The initial sample was compo-sed of 335 companies listed on Bovespa between the years 2009 to 2011, totaling 559 observations. The second group, the subsample, corresponded to Brazilian companies with access to the international American Depositary Receipts (ADRs) market, levels II and III. A total of 24 companies were surveyed in the period 2003-2011, providing a total of 191 observations.
The companies' consolidated financial data were obtai-ned from Economática, and other information necessary to calculate the diversification measures was extracted from the 20-F report and the Standardized Financial Statements (SFS) that are published annually by each company and available on the BM&F/Bovespa website. Data collection was conducted manually, consulting the report of all the companies during the proposed years of observation.
Table 1 Description of the considered variables
VARIABLE DESCRIPTION
Debt (in log) Short- + Long-term Debts
Growth Price to Book
Size Log of Total Assets
Tangibility Fixed/Total Assets
Return on Assets (ROA) Earnings before interest and taxes/Total assets Risk of Bankruptcy and Liquidity (RISK) Earnings before interest and taxes/expenses. Financial.
4 RESULTS
Table 2 presents the descriptive statistics of the variables used in this study. The initial sample for the cross-pledging test was composed of 335 Brazilian companies listed on Bo-vespa between 2009 and 2011. The subsample consisted of
24 Brazilian ADR companies with shares publicly traded on the U.S. stock exchange, observed between the years 2003 and 2011. The debt variable was expressed in millions and was divided by the total assets.
Table 2 Descriptive statistics of the selected variables
VARIABLES COMPANIES - ADRs COMPANIES - BOVESPA
MEAN STANDARD DEVIATION MEAN STANDARD DEVIATION
Debt 0.2873 0.1152 0.8952 9.6278
HHI 0.6754 0.2494 0.7588 0.2471
Segments 2.7453 1.8985 2.4138 1.5027
Price to Book 2.1609 1.9840 1.9143 10.4099
Size 16.822 1.2581 13.9579 2.4250
Tangibility 0.4099 0.1870 0.2786 0.2471
ROA 0.0972 0.0771 -24.2980 735.4479
Risk 3.2042 3.9416 45.5748 832.56
The differences in the variable values are due to the size of each sample. Regarding the degree of
The mean of the Herfindahl index is 0.75 for the initial sample and 0.67 for the subsample.
4.1 Panel Regression.
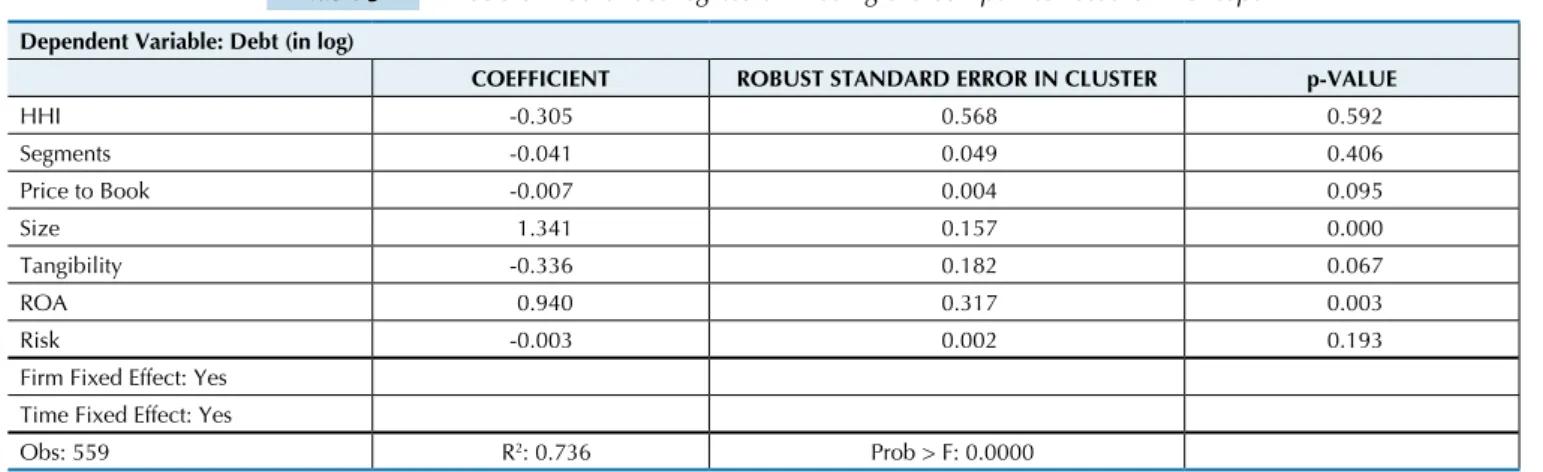
The cross-pledging analysis verifies the impact on debt of the degree of diversification, as measured using the Herfindahl index, and the number of segments that the company reports.
The sample analyzed in Table 3 is composed of 335 companies listed on Bovespa and observed during the ye-ars 2009-2011. Both of the models were estimated in panels
Table 3 Double ixed-effect regression – using the companies listed on Bovespa
Dependent Variable: Debt (in log)
COEFFICIENT ROBUST STANDARD ERROR IN CLUSTER p-VALUE
HHI -0.305 0.568 0.592
Segments -0.041 0.049 0.406
Price to Book -0.007 0.004 0.095
Size 1.341 0.157 0.000
Tangibility -0.336 0.182 0.067
ROA 0.940 0.317 0.003
Risk -0.003 0.002 0.193
Firm Fixed Effect: Yes Time Fixed Effect: Yes
Obs: 559 R2: 0.736 Prob > F: 0.0000
Note: Heteroskedasticity-robust variance and covariance matrix and serial autocorrelation with cluster by cross-section.
This result seems at first sight contradictory to the results of the theoretical model previously presen-ted. To really understand this result, it is necessary to analyze whether the result of the theoretical model is valid for all situations. Note that a key assumption for the validity of the results is the independence of invest-ment projects, i.e., the cash flows generated cannot be highly correlated because, if they were, there would be no possibility of diversifying risk.
In practice, the segments reported by Brazilian fir-ms are highly correlated sectors, and this high correla-tion prevents the benefits of cross-pledging because it is through the independence between projects or busi-ness units that income from one can be used as collate-ral to finance the construction of another, as predicted by Diamond (1984), Lewellen (1971), Stein (2003) and Tirole (2006).
A second possible explanation is the low level of in-debtedness of Brazilian firms. Diversification benefits are greater for firms with high leverage levels, allowing
new financing possibilities through cross-pledging. Finally, a third possible cause for the lack of correla-tion is the low level of diversificacorrela-tion of the companies in the sample. Note that the mean of the Herfindahl-Hirschman Index for the sample of companies listed on Bovespa was 0.75, which is still a rather low level of diversification (HHI equal to 1 represents complete concentration).
An empirical limitation of our results is the fact that our sample is limited to the period 2009-2011. As dis-cussed earlier, this information is available for all the companies listed on the Brazilian stock market only from 2009, due to the new requirement for segment re-porting.
To test the robustness with respect to the sample pe-riod analyzed, we used the companies with ADR levels II and III for the period 2003-2011 as a sample. These companies are listed on the U.S. market and therefore divulge such information by segment according to SEC requirements. The results are shown in Table 4.
Table 4 Regression with ixed effect - ADR companies
Dependent variable:
DEBT (IN LOG) COEFFICIENT ROBUST STANDARD ERROR IN CLUSTER P VALUE
HHI 0.338 0.398 0.404
Segments 0.078 0.040 0.063
Price to Book -0.035 0.021 0.116
Size 0.869 0.222 0.001
Tangibility -0.466 0.354 0.201
ROA -1.16 0.609 0.068
Risk -0.014 0.009 0.132
Firm Fixed Effect: Yes Time Fixed Effect: Yes
Obs: 191 R2: 0.8502 Prob > F: 0.0000
Note: Heteroskedasticity-robust variance and covariance matrix and serial autocorrelation with cluster by cross-section
with fixed effects and random effects. However, after per-forming the Hausman test, it was not possible statistically to guarantee the consistency of the parameters estimated by random effects. Therefore, only the results of the fixed-effects model are presented.
The results presented in the robustness test (Table 3) also showed no statistically significant correlation between the diversification, represented by the Herfin-dahl-Hirschman Index, and indebtedness of the ADR companies. These results corroborate those of Comment and Jarrell (1995), who found no statistical significance
in this relationship when the degree of diversification was measured using the Herfindahl index.
The lack of correlation is therefore potentially cor-related with the aforementioned factors, such as highly correlated projects, high levels of concentration of ca-pital within projects and low levels of indebtedness.
5 CONCLUSIONS
The main aim of this study was to determine whether corporate diversification increases the borrowing capacity of Brazilian companies by means of cross-pledging. To that end, the relationship between the degree of diversification and leverage was evaluated.
Using a panel data model, no evidence was found that diversification offered financing advantages for Brazilian firms in the studied sample. This result allo-ws us to say that the use of a corporate diversification strategy such as has been carried out in Brazil does not bring positive results in terms of business financing ability. Thus, managers who focus on increasing poten-tial financing should consider alternatives to corporate diversification.
Based on our analyses, several possible explanations were identified for this result. The first analysis referred to the high correlation between the segments reported by the firms. Because of the independence between company projects or business units, income from one project can be
used as collateral to finance another. An alternative expla-nation is the low level of indebtedness of firms: the benefits of diversification are higher for firms with high leverage levels, and diversification allows new possibilities for finan-cing through cross-pledging.
Finally, the sample firms showed little diversification. The mean of the Herfindahl index was 0.75 for the sample of companies listed on Bovespa and 0.67 for the firms with shares listed on the U.S. stock exchange.
As a suggestion for future research, it would be inte-resting to analyze more deeply the causes of this lack of correlation between diversification and debt. One way to do this is to create a measure of correlation betwe-en the various businesses of each company and to add this element into the specification that relates diversi-fication to indebtedness. The interaction of correlation and diversification would thus indicate whether diver-sified firms with uncorrelated projects do in fact enjoy the benefits of cross-pledging.
Ahn, S., Denis, D. J., & Denis, K. D. (2006). Leverage and investment in diversiied irms. Journal of Financial Economics, 79, 317-337. Araújo, A. P., Ferreira, R. V. X., & Funchal, B. (2012). he Brazilian
bankruptcy law experience. Journal of Corporate Finance, 18 (4), 994-1004.
Berger, P., & Ofek, E. (1995). Diversiication’s efect on irm value. Journal of Financial Economics, 37, 39-65.
Campello, M. (2002). Internal capital markets in inancial conglomerates: evidence from small bank responses to monetary policy. Journal of Finance, 57 (6), 2773-2805.
Carvalho, T. F. de, Maia, M. V., & Barbedo, C. H. da S. (2012, February). O efeito da diversiicação no valor das empresas listadas em bolsa no Brasil. RAM - Rev. Adm. Mackenzie, São Paulo, 13 (1), 87-109. Comment, R., & Jarrell, G. (1995). Corporate focus and stock returns.
Journal of Financial Economics, 37 (1), 67-87.
Denis, D. J., & Denis, D. K. (1993). Managerial discretion, organizational structure, and corporate performance: a study of leveraged recapitalizations. Journal of Accounting and Economics, 16, 209-236. Diamond, D. (1984). Financial intermediation and delegated monitoring.
Review of Economic Studies, 5 (3), 393-414.
Dimitrov, V., & Tice, S. (2006). Corporate diversiication and credit constraints: real efects across the business cycle. Review of Financial Studies, 19 (4), 1465-1498.
Holmstrom, B., & Tirole, J. (1997). Financial intermediation, loanable funds, and the real sector. Quarterly Journal of Economics, 112 (3), 663-691.
Hovakimian, G. (2011). Financial constraints and investment eiciency: internal capital allocation across the business cycle. Fordham University, Working Paper, 20 (2), 264-283.
Hubbard, R. G., & Palia, D. (1999). A reexamination of the conglomerate merger wave in the 1960s: an internal capital markets view. Journal of Finance, 54 (3), 1131-1152.
Kuppuswamy, V., & Villalonga, B. (2010, November). Does diversiication create value in the presence of external inancing constraints?
Evidence from the 2007–2009 inancial crisis. Harvard Business School Finance, Working Paper, n. 10-101.
Lang, L. H. P., Ofek, E., & Stulz, R. M. (1996). Leverage, investment, and irm growth. Journal of Financial Economics, 40 (1), 3-29.
Lang, L. H. P., & Stulz, R. M. (1994). Tobin’s Q, corporate diversiication, and irm performance. Journal of Political Economy, 102 (6), 1248-1280. Lewellen, E. (1971). A pure inancial rationale for the conglomerate
merger. Journal of Finance, 26, 521-537.
Matsusaka, J.G., & Nanda, V. (2002). Internal capital markets and corporate refocusing. Journal of Financial Intermediation, 11, 176-211. Modigliani, F., & Miller, M. H. (1958). he cost of capital, corporation
inance and the theory of investment. he American Economic Review, 48 (3), 261-297.
Myers, S. C. (1977). he determinants of corporate borrowing. Journal of Financial Economics, 5 (2), 147-175.
Myers, S. C. (1984, July). he capital structure puzzle. he Journal of Finance, 39 (3), p. 575-592.
Rajan, R. G., & Zingales, L. (1995, December). What do we know about capital structure? Some evidence from international data. he Journal of Finance, 50 (5), 1421-1460.
Rajan, R. G., Servaes, H., & Zingales, L. (2000). he cost of diversity: the diversiication discount and ineicient investment. Journal of Finance, 60, 35-80.
Scharfstein, D. S., & Stein, J. C. (2000). he dark side of internal capital markets: divisional rent seeking and ineicient investments. Journal of Finance, 55, 2537-2564.
Servaes, H. (1996). he value of diversiication during the conglomerate merger wave. Journal of Finance, 51 (4), 1201-1225.
Shin, H., & Stulz, R. M. (1998). Are internal capital markets eicient? Quarterly Journal of Economics, 113 (2), 531-552.
Stein, J. C. (1997). Internal capital markets and the competition for corporate resources, Journal of Finance, 52 (1), 111-133. Stein, J. C. (2003). Agency, information and corporate investment. In
Constantinides, G. M., Harris, M., & Stulz, R. M. (Eds.). Handbook of
the Economics of Finance. Amsterdam: Elsevier, 1A, 111-165. Tirole, J. (2006). he theory of corporate inance. New Jersey: Princeton
University Press.
Yan, A., Yang, Z., & Jiao, J. (2010). Conglomerate investment under various capital market conditions. Journal of Banking & Finance, 34
(1), 103-115.
Williamson, O. E. (1975). Markets and hierarchies: analysis and antitrust implications. New York: Free Press.