1
Work Project, presented as part of the requirements for the Award of a Masters Degree in
Finance from Nova – School of Business and Economics
Insights into Reported Earnings per Share
Compliance and Value Relevance in Portuguese Listed Companies
Carlos Ramalhinho, # 2297
A Project Supervised by Professor Leonor Ferreira
2
Title:
Insights into Reported Earnings per Share – Compliance and Value Relevance in Portuguese Listed Companies
Abstract
Earnings per Share (EPS) is the only mandatory ratio for firms and its reporting is closely regulated by IAS 33. By designing and using an index methodology, this Work Project analyses compliance in financial reporting of companies listed in the Euronext Lisbon, for the years 2012-2015. Furthermore, to determine if investors focus on EPS, a value relevance study is carried out. The level of compliance is found to be high. Firm Size, Type of Auditor, Net Income and Leverage influence the level of compliance reporting and investors closely monitor EPS value, as it is statistically value relevant.
Key Words: Earnings per Share, IAS 33, Reporting Compliance, Value Relevance, Euronext
Lisbon
1. Introduction
3 some industries1, EPS is the only profitability ratio of mandatory reporting for companies in general.
Nevertheless, EPS computation, as income, net of operational and non-operational expenses, is divided by the number of outstanding shares of a company, raises several issues. On one side, both numerator and denominator of EPS ratio can be subject to judgments and assumptions, which lead to different numbers, and, thus, there is the danger of financial statement manipulation, which prevents statements from providing a true and fair view of the company’s business (Balaciu, Cernușca, Teodora, & Mester, 2014). Additionally, there are several computation formulas, as regulations can differ. IAS 332, which is mandatory for consolidated financial statements of companies with shares listed in any EU Stock Exchange, requires presenting both Basic EPS and Diluted EPS.
In the context, this Work Project aims at understanding if Portuguese firms with shares listed in the Euronext Lisbon comply with the mandatory reporting standards and if their EPS figures are value relevant for investors. The analysis covers EPS reporting tin he periods 2012 to 2015, and an overview of EPS presentation and disclosures precedes the insights into compliance with IAS 33 and the value relevance of the EPS numbers.
The Work Project proceeds as follows. After this Introduction, Section 2 examines the concept of EPS, such as Basic EPS and EPS Section 3 summarizes the prior literature regarding both compliance with regulation and value relevance of EPS figures. Section 4 describes the methodology and data analysed in the research. Section 5 discusses the results and limitations of the research. Section 6 concludes and outlines future research.
1 Banks, Insurance companies and other Financial Institutions are the exceptions.
4
2. Earnings per Share - the Concept
Earnings per Share is a simply income indicator computed as follows:
Different EPS ratios can be calculated, among which are Basic EPS and Diluted EPS. Both these measures are designed for common shareholders and each gives valuable information to investors. While Basic EPS does not account for potential dilutive instruments, Diluted EPS is able to account for complex financial instruments that have a dilutive effect, leading, ultimately, to lowers earnings attributable to each common shareholder. Briefly, Diluted EPS assumes all potential dilutive instruments with dilutive effect will be converted into common stock while Basic EPS only integrates in its computation mandatorily convertible instruments with dilutive effect.
Several issues are discussed around the EPS calculation. Regarding the denominator, only
outstanding common shares should be included. Treasury stocks are excluded from the EPS
calculation, as they are not entitled to receive cash dividends. The number of common shares may change during the period of reporting events occur, such as capitalization, stock splits, reverse stock splits or stock dividends that change the number of shares “without a corresponding change
5 The pros and cons of equity versus debt have led to the creation of hybrid instruments, which
capture certain features of each type of financing mechanisms. Thus, depending on the type of instrument, the conversion into outstanding shares may be optional or mandatory.
Concerning the numerator, EPS is an earnings measure of interest only for common shareholders, since preferred shareholders have a fixed and predictable income that does not depend on a company’s performance. Thus, net income must be deducted of any preferred shares
expense/dividends, in an after-tax basis.3 Companies can issue different types of shares, which differ regarding duties and the rights assigned to shareholders4, namely common and preference shares. The former are most commonly used type of shares issued and do not have any restrictions or additional rights; however, this type of shares does not have a guaranteed income through dividends received and usually have the lowest priority claim in bankruptcy situations.5 Conversely, preference shares are given special rights but are also subject to certain restrictions Preferred shareholders have a guaranteed income as they are entitled to receive a fixed dividend per period. Additionally, the latter also have an advantage in bankruptcy situations, where they have a priority claim over common shareholders. Nevertheless, they cannot be members of the governing bodies of the company and they do not have full voting rights.
EPS computation is subject to rules regarding the number of shares. Besides the aforementioned adjustment of Net Income that has to be deducted of Preferred Dividends, the number of shares considered into its denominator must be solely the actual outstanding to common shares.
3 The most common income indicator used is Net Income, as presented in the Income Statement. It summarizes in a single number the revenues and expenses of a company in a given period, indicating to all stakeholders the profit or the loss of the company.
4 Different types of shares issued differ regarding the following rights assigned to shareholders: (i) right to information; (ii) right to receive dividends; (iii) voting rights; (iv) claiming rights in bankruptcy situation; (v) right to be elected for the governing bodies of the company, as stated in Companies Business Code (Decree Law No 262/86 and its amendments)
6 Additionally, common shares must have already been fully paid up, in order to be included in the EPS calculation.
Thus, the following formula should apply when calculating Basic EPS, which does not account
for potential dilution effects:
Diluted EPS assumes that all financial instruments that can cause dilution will be converted into
common shares6. Even though it can be an unlikely scenario, it provides useful information for investors, as it establishes a dilution range, making investors aware of the potential reduced return of their investments. Several types of instruments can originate a dilutive effect. Options and warrants have a dilutive effect if they are issued at a price below market price.7 Contracts to be settled in cash or in common shares are assumed to be settled in shares and, consequently, have a dilutive effect on EPS. Other convertible instruments such as convertible debt and convertible preferred stock can also have a dilutive effect.
The conversion of potential dilutive instruments has effects on both the numerator and the denominator of the EPS ratio. It results in an increase in the number of common shares, and the numerator must be adjusted for the change in Net Income due to the conversion of dilutive instruments, namely dividends to converted preferred shares or interest not anymore paid8. The number of shares and the issue date depend on each individual contract but must be a concern of the company, in order to compute Diluted EPS.
6 Conversion date can be at the beginning, at the end of the year, or at any other date stipulated by the type of instrument in question.
7 In this case, the number of shares to be added is the difference between the number of shares issued and the number of shares that would be issued at a market price with the procedures from the exercise of those options.
7 There is a trade-off between comparability and usefulness when presenting EPS according to a certain regulation. On one side, standard formulas guarantee less pervasive effects of management and the possibility of accurately comparing between EPS numbers, but on the other side a Pro Forma EPS, can be significantly more useful and value relevant to investors, as it can represent a number closer to the performance of the company. Nonetheless, Pro forma EPS is given a significant focus by investors and consequently have a tremendous impact on stock returns (Bradshaw & Sloan, 2002), since it has the advantage of reflecting the company’s business context. As an example, Cash EPS, an earnings measurement based on the operating cash flow for the reporting period, has the advantage of representing the company’s ability to generate cash, and is less sensitive to earnings manipulation.
It is worth mention that different types of Income may be relevant to investors. As such, when computing EPS ratios one can consider Net Income either in an individual or consolidated basis, and Income from discontinued operations, all of them relevant for investors when evaluating EPS, and thus worth to separately calculate and inform about them. The primary role of the financial information is to “to ensure that the information provided is useful for making decisions” (Elliot & Elliot, 2011). As such, Non-GAAP indicators should complement GAAP indicators, instead of substituting them (Walker Jr., 2016). It is one reason why accounting regulators have claimed for “reconciliationto the nearest GAAP measure.”
8 numerous aspects that can cause EPS to be calculated differently, it is understandable that the simple EPS formula is subject to rules concerning its calculation, in order to obtain comparable information between companies and across periods. An analysis of the evolution of Regulatory standards as well as the main differences between International and the U.S. regulation is in appendix 1.
Despite the efforts to regulate EPS computation, an important remark must be made, as IAS 33 focus too heavily on the calculation of the denominator. The numerator, which represents indeed earnings generation capability of a firm, should deserve a higher emphasis as its measurement is subject to judgements and assumptions that can materially change the computation of EPS number.
3. Literature Review
The literature about EPS is vast and diverse, with studies done across the world. Two streams of EPS empirical research matters for this Work project, one focuses on compliance with financial reporting regulation and the other on value relevance of the EPS numbers9.
3.1. Compliance in Reporting
Studies about compliance in financial reporting with standards, such as the IAS / IFRS10 and the SFAS (Statement of Financial Accounting Standards) from the U.S, have been extensive, and have usually recurred to the index methodology. Historically, the use of compliance indices in accounting research has been quite helpful in quantifying harmonization of financial reporting, that is, “the extent of concentration around a particular accounting choice” (Pierce, 1997). Its
9 Besides the two reviewed streams of research about EPS, there are other types of studies which are out of the scope of this Work Project. Earnings quality and management is an extensively studied research topic. Most studies, as explained by Healy & Wahlen (1999), use a model of discretionary accruals, which can indicate the quality of the accounting information. The avoidance of dilutive instruments, studied, for instance, by Huang, Marquardt & Zhang (2011), and the effect of more complex capital structures, research undertook by Sivathaasan and Rathika (2013), along with EPS data rounding as studied by Grundfest & Malenko (2011).,
9 importance comes from the fact that different accounting practices might wrongly influence business decisions, as accounting information lacks a fundamental characteristic: comparability between different reporting periods and entities.
In the reporting compliance area of research, the index approach can be traced back to the beginning of the century where several studies used different disclosure criteria, constructing an index “through an accumulation of scores assigned to individual voluntary and mandatory information items” (Agyei-Mensah, 2012). Studies usually investigate the two types of research: firstly, authors study the effective compliance with recent regulations; secondly, those exact same researches try to understand the factors that influence and are influenced by reporting compliance.
Craig & Diga (1988)studied the disclosure of appropriate accounting information in a few Asian countries by analysing the practices of disclosure in the annual reports of listed companies according to the appropriate regulations. These practices are analysed using a disclosure checklist that covers different financial items, including EPS disclosure. Differences in disclosure level were found between countries, which would have implications for the harmonization of accounting in those Asian countries.
10 mentioned methodology, found low levels of compliance with IFRS, while also confirming the extensively studied relation between company size and with disclosure of information.
In Kuwait, compliance with twelve IAS, investigating the reporting of 101 disclosure items, were tested by Mutawaa & Hewaidy (2010). A higher compliance level was found in this study, while the type of industry was a significant factor influencing the reporting compliance. An analysis on the IFRS compliance of Malaysian companies by Hla, Isa, & Shaikh (2013) indicated that where there were higher levels of compliance there were also better corporate governance practices. In Philippines, Ferrer & Ferrer (2011) tested the effect of liquidity and leverage on IFRS
compliance. Using the aforementioned methodology, the results did not indicate any relationship between IFRS Compliance and independent variables, liquidity and leverage level. However, in Ghana, liquidity was found to have a statistically significant effect on compliance levels, as studied by Agyei-Mensah (2012). Nevertheless, contrary to all the different factors mentioned, there was not statistical support for company size or auditor size.
The aforementioned studies analyse EPS regulation among other IAS. Regarding IAS 33, to the best of our knowledge, no studies cover the compliance with this regulation alone.
3.2. Value Relevance of the Accounting Numbers
Value relevance can be defined as the power and ability of a given number “to capture company “value” (Karğın, 2013). By investigating through the extensive literature on EPS, capturing the company value can be performed and understood in several ways.
Among the vast literature on value relevance11, one approach is to study a specific accounting variable and its impact on market value, based on statistical significance of the coefficient of the studied accounting variable. This Work Project performs an analysis similar to this type of
11 analysis. Given the importance of stock markets and the focus given to it by investors, value relevance of accounting numbers has been extensively studied, especially EPS numbers.
As Camodeca, Almici & Brivio (2014) “value relevance is the ability of accounting information,
to capture or summarize information affecting companies’ share values”. (Camodeca, Almici, & Brivio, 2014)
One of the first researches to test the usefulness of accounting numbers was Ball & Brown (1968). The authors proved the usefulness of the earnings information of annual reports and its relation with stock prices, by constructing a model in which expected and unexpected return are separate and in which the latter is explained by information contained in the accounting numbers. In 1995 Ohlson & Feltham published a cornerstone study in this area. These authors developed a statistical method to compute value relevance, which many researchers have used since then to investigate value relevance of accounting numbers across the world. Francis & Schipper (1999) analysed the value relevance of accounting numbers through a 50 year period and conclude that the “explanatory power of earnings levels and changes for returns has significantly decreased over time”.
12 In further attempts to understand the explanatory power of accounting earnings, Robert Lipe (1986) studied the separate relevance of earnings components in stock returns. The results indicated each component that is able to add valuable information. Maydew, Collins & Weiss (1997) have contradicted several studies that indicate a decrease of the value relevance of EPS. Their results indicated a slight increase in the usefulness of EPS.
Regarding Portuguese companies, the research about EPS is scarce. Two studies are worth notice: Alves (2006; 2014) and Freixinho (2012). The former is a normative study, which describes IAS 33. The latter is an empirical research which provides an overview of EPS reporting according to IAS 33 by Portuguese listed companies in the years 2010-2011. The results showed a few companies were not complying with the regulation. This Work Project extends Freixinho’s (2012) research to more periods, 2012-2015. It provides a qualitative and quantitative analysis, and continues paving the study of reporting patterns in Portugal. Moreover, it gives two insights into EPS reporting by Portuguese listed companies: reporting compliance with IAS 33 and value relevance, that is, EPS impact on stock prices.
4. Research Design
4.1 Research Questions
The purpose of this Work Project is to get insights into EPS reporting by Portuguese companies listed in the Euronext Lisbon, namely assessing the level of compliance with regulation, understanding which factor influence Portuguese companies to comply with IAS 33 standard regulations and if reported EPS numbers are value relevant for investors. Three main research questions are addressed, as follows:
RQ1: DoPortuguese listed companies comply with IAS 33 when reporting EPS?
RQ1.1–What is the level of reporting compliance with IAS 33?
13 RQ2-Which factors influence the level of reporting compliance year by year?
RQ3: Is the EPS ratio reported by Portuguese listed companies’ value relevant tostakeholders?
RQ3.1 –Is Basic EPS value relevant?
RQ3.2 –Is Diluted EPS value relevant?
Data analysis provide an overview of the characteristics of the companies in the sample and their EPS reporting.
4.2. Methodology
In order to analyze the level of compliance with the regulation about EPS and its evolution throughout the four years (RQ1), an index methodology is used. The analysis factor which influence reporting compliance (RQ2) and value relevance (RQ3) is performed on Stata. Thus, some preparation is needed, in order to provide internal consistency to the research and avoid jeopardizing the validity of the models used.12
Level of Reporting Compliance
Two checklists of disclosure are adopted to measure the level of compliance with the mandatory regulation (IAS 33), one published by Deloitte (2010) and the other by KPMG (2015). Both checklists mention items that companies should present and disclose according to IAS 33. This Work Project follows the methodology described in the literature reviewed in section 3 as dichotomous index, where each item is equally weighted in the model that provides the level of reporting compliance. If a company complies with a specific item in the list, the value one is
14 awarded; otherwise the zero value is assigned. Exception is made for certain checklist items that demand the presentation of three items, in which case, three scoring can happen (0 or 0.5 or 1). Given idiosyncrasies of each company, there might be some items in the checklist that are not applicable, and thus, the final level of reporting compliance only considers the items classified as applicable. The equal weight of each checklist point was based on past literature. Items included in the reporting compliance index are presented in appendix 6.
Consequently, an index summarizes the final reporting compliance level which assumes a value between zero and one, the former if the companies do not comply with any item and the latter when the company fully complies with IAS 33. The Reporting Compliance Index (RCI) is calculated for each company and period as follows:
Where RCIij stands for index of compliance for reporting of company i in year j
The RCI is calculated over the four years of analysis (2012-2015), for each of the 42 companies in the sample and its evolution is analyzed.
Factors influencing the Reporting Compliance Index
Regarding RQ 2, several factors are studied with the aim to understanding which of them influences the level of reporting compliance. These factors are the Auditor type, Leverage, Profit and companies’ Size, Assuming that higher resources and more investors’ attention could lead to
15 ways: (i) Total Assets; (ii) Total Annual Revenues. In order to make it more parsimonious13, the logarithmic transformation of both these variables was considered for its study.
Leverage level also is expected to influence RCI. More information could be a way to solve agency problems and asymmetries of information that higher levels of leverage can provoke. In this research, both Debt to Total Assets and Debt to Equity ratios are used as proxies to Leverage, and they provided equal results, what adds internal consistency to the models. Profitability, proxied by Net Income, is also expected to be an influential factor. A profitable company may have more incentives to comply with reporting regulation, as it represents positive news to investors and the company itself. Furthermore, unprofitable companies may avoid revealing bad results, leading to lower compliance levels. On the other hand, given the less prosperous situation that unprofitable firms are found in, stakeholders can demand more information from the company, resulting in higher reporting compliance levels.
As for The Auditor Type, also expected to have an effect on the level of compliance, as the argument is that because the Big Four auditing companies tend to have more and better
resources, the level of compliance might be superior when a company uses their services. Thus, in this study the Auditor Type is a dummy variable, assuming the value one if one of the Big Four audit companies is its auditor and zero if otherwise.
Finally, after removing non-significant variables, the model tested remains in equation [4] :
RCI=β0+β1 x LogSIZE+β2 x LEVERAGE+β4 xNET INCOME+ β5 x AUDITOR TYPE+ Ɛ [4] In order to understand if the aforementioned factors have significant effects on RCI, an analysis of the statistical significance of the independent variables is performed.14
13 It simplifies data by inducing a smoother data pattern. Consequently, it can enhance explanatory power of variables.
16
Value Relevance
In order to answer to RQ3, this WP follows the methodology of Feltham & Ohlson (1995). This method has been widely used to measure value relevance of accounting numbers. It uses a regression to test the hypothesis of value relevance. Control variables are added, in order to prevent the problem of correlated omitted variables, which could jeopardize the results.
Provided that assumptions on Basic EPS and Diluted EPS are different, this study addresses two perspectives that culminate in sub models [5] and [6], as follows:
PRICE =β0+β1 x Basic EPS+β2 x DIVIDEND PER SHARE +β4 x NET INCOME + β5 x AUDITOR TYPE + Ɛ [5] PRICE =β0+β1 x Diluted EPS+β2 x DIVIDEND PER SHARE +β3 x NET INCOME+ β5 x AUDITOR TYPE + Ɛ [6]
Price represents market capitalization per share at the end of the fourth month of the reporting period, April. This date was selected in order to guarantee that the Annual Reports of each company were already made public and available to investors. In order to understand if the accounting information is, in fact, value relevant an analysis of the statistical significance of the independent variables is performed.15
4.3 Sample Selection and Data Collection
The research covers a period of four years, from 2012 to 2015. A four-year period of analysis allows for comparisons and change analysis. While the latter is the most recent information which is publicly available, the former marks the first complete year after the arrival of the Troika in Portugal16. During the four years of analysis, Portuguese companies struggled with the
economic crisis but were also able to recover, at least partially, from it. It is then an important
15 This analysis was done on three levels of significance, namely 1%, 5% and 10%.
17 period for Portuguese companies and an especially interesting moment to analyse EPS reporting patterns, compliance and EPS value relevance.
The initial sample is formed by companies listed in the Lisbon Euronext Stock Exchange, as of December 31st, 2015. It includes the largest and most traded companies in Portugal. Furthermore, those are the ones with publicly available information and easy access to financial data. By being listed companies, they are audited twice, internally and externally, which presumably guarantees more reliable information. Reporting under IAS 33 is mandatory for the consolidated financial reporting of these companies, according to Regulation No. 1606/2002, in force for the years 2005 onwards.
The initial sample includes 48 companies. However, some companies were excluded due to different criteria: three football SADs were excluded because they adopted a reporting period which does not end on December 31st 17 .NEXPONOR SICAFI was also excluded from the sample, as its Annual Reports were not available. MONTEPIO, a bank which in this period of analysis suffered a paramount restructuring of its activities18, which consequently prevents comparative analysis, was also excluded from the sample. PHAROL, the company that in 2014 took over PT, was also excluded as relevant information could not be gathered for comparison analysis. Thus, the final sample includes 42 companies. Appendix 2 provides the list of the companies in the sample and appendix 3 shows an analysis per industry.
In order to bullet proof the database, data was gathered from two sources: (i) hand collected data from the companies’ financial reports (Income Statement and Notes to the financial statement)
17 For those companies, the year 2011 corresponds to the report of the fiscal year 2010/2011, which corresponds to their operating cycle, not coinciding with the civil year. For that reason, these three companies were excluded from the final sample.
18 which are available at their websites or from the Stock market authority website (www.cmvm.pt) to retrieve data on EPS, Size, Leverage, Auditor, Dividends and other firm specific factors. (ii) Bloomberg information centres available at Nova SBE to retrieve some financial ratios.
Data was collected in an excel file, and a database was built. This is a contribution of this Work Project for those who may use it for further research in the future.
4.4 Data Analysis
Company Characteristics
In terms of size, six companies have assets worth more than ten billion Euros, 13 companies have assets worth between one and ten billion Euros, and the remaining 23 have assets worth below one billion Euros. Fifty seven per cent of the companies (24 out of 42) analyzed had an SGPS Statues.19 The Big Four auditing companies audit more than 80 per cent (34 out of 42). More than eighty one per cent of the firms (34 out of 42) have a simple capital structure. Table 1 summarizes aggregated indicators for the companies analyzed, about leverage and profitability.
Table 1 – Aggregated information on firms analyzed 2012 2013 2014 2015 #Profitable Companies (# Net Income>0) 28 33 30 32
Leverage (Debt /Assets) 0.76 0.72 0.73 0.74
Several insights can be withdrawn. Portuguese listed companies have high levels of leverage, financing their operations mainly with debt. This can indicate that companies try to take advantage of the lower cost of capital of debt even though it can be dangerous and add additional costs when in an economic downturn due to agency costs. The period of analysis ranges from 2012, where Portugal was suffering from the sovereign debt crises that spread across Europe, and 2015, some companies were already recovering from the crisis while others still struggled to get
19 back on their feet. Thus, it is reasonable to expect performance indicators to increase even though some fluctuations can happen, given the diversity of companies studied, with different economic cycles and different internationalization levels.
From appendix 4, we can understand that there are several variables with statistical correlation to EPS, such as Auditor Type, Positive Net Income, Leverage and Company Size. As a result, further research on the relationship between these variables is studied by recurring to regression analysis.
Overview of EPS Reporting
According to IAS 33, companies should present Basic EPS and Diluted EPS in the face of the income statement (IAS 33, Para 66). Among the analyzed companies, only one did not comply with this obligation20. This firm did not present any note on EPS either. Another two firms, LISGRAFICA and IMPRESA, presented only a different type of EPS, having comprehensive income per share.
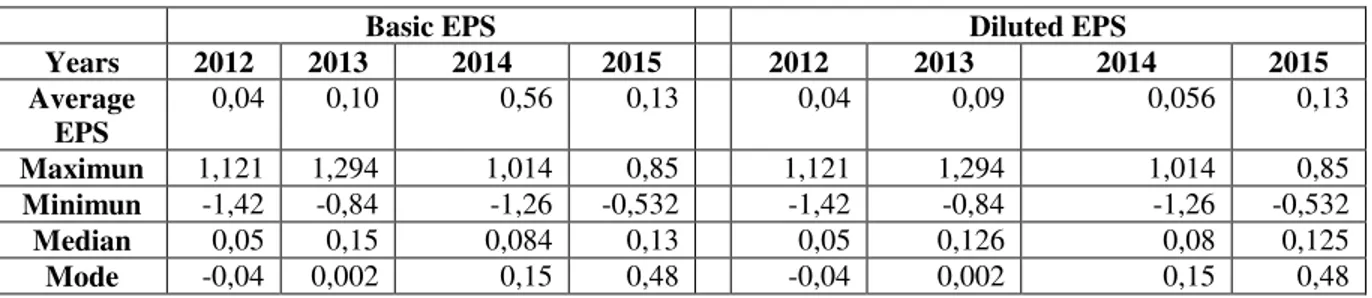
The economic recovery of Portuguese companies is confirmed in the average EPS number across the period of analysis. Table 2 shows the descriptive statistics with this evidence.
Table 2. Basic EPS and Diluted EPS Reported by Portuguese listed companies (2012-2015)
Basic EPS Diluted EPS
Years 2012 2013 2014 2015 2012 2013 2014 2015 Average
EPS
0,04 0,10 0,56 0,13 0,04 0,09 0,056 0,13
Maximun 1,121 1,294 1,014 0,85 1,121 1,294 1,014 0,85 Minimun -1,42 -0,84 -1,26 -0,532 -1,42 -0,84 -1,26 -0,532 Median 0,05 0,15 0,084 0,13 0,05 0,126 0,08 0,125
Mode -0,04 0,002 0,15 0,48 -0,04 0,002 0,15 0,48
While a recalculation of each EPS was performed, it was also reviewed the average number of outstanding shares, and the types of shares that each company has. It is worth mention that in
20 2015, 24 per cent (10 out of 42) of the firms had own shares. This number fluctuated slightly in the years before.
Companies chosen triggered some limitations to this research. Some did not provide the whole data required to compute EPS. Additionally, not all companies indicate in which note to the financial statement was the EPS computation described, as in the face of the Income Statement cross references to the notes are missing in the line where EPS numbers are presented.21.
Dilutive Instruments and Effects of Dilution
Regarding the capital structure, only 19 per cent (eight out of 42) companies have potential dilutive instruments, which are described in section 5. For the years 2012-2015, most companies do not have potential dilutive instruments, what results in similar Basic and Diluted EPS numbers. The few complex instruments found include Convertible Debt, Stock Options (including employee stock options, as compensation schemes) and CoCos, a special type of convertible debt22. CIMPOR, EDP and NOVABASE used Employee Stock Options which were converted in the years analysed. Among the banks that used CoCos23 BCP and BPI were. Additionally, the latter used stock options. Only two companies SONAE and SONAE INDÚSTRIA have conventional convertible debt during the analysis period. Potential dilutive instruments in the cases of MARTIFER and of NOVABASE, did not have dilutive effect on EPS.
Appendix 5 shows a summary of the potential dilutive instruments of Portuguese listed companies in the years 2012-2015, and their dilutive effects. Freixinho (2012) found that Portuguese listed companies have few potential dilutive instruments in 2010 and 2011.
21 This represented a noncompliance with IAS 1.
22 CoCos is a special type of convertible debt provided by the Portuguese Government to the banking sector, in an attempt to provide advantageous funds. The ultimate point of this financing mechanism was to provide liquidity to the market and to companies, such that the levels of investment would increase, benefiting the overall economy. Its conversion into common equity would happen in case the banks failed to repay part of the debt.
21 Comparing to previous research, very few Portuguese listed companies continue to use potential dilutive instruments though the years 2012 to 2015. In fact, the number of companies using potential dilutive instruments slightly decreased which may suggest that companies tend to use them more when there is an economic downturn. The economic theory of agency costs and information asymmetry supports this statement as convertible instruments can be used to mitigate agency conflicts. Nevertheless, it lacks empirical support and additional research on this issue is needed.
5. Results
5.1. Evolution of Reporting Compliance (RQ1)
On average, the results indicate that companies are increasing their level of compliance with IAS 33 in the period 2012-2015. There are 15 companies improving their result throughout the reported period, while there are only four companies that worsened their result. A general analysis of the results presented in appendix 7 indicates the main insights per year that the Reporting Compliance Index is able to capture.
Eighteen companies achieved a score above 90 per cent, while there is only one that complies with less than 50 per cent of the checklist points.
On an individual basis, several companies deserve an additional analysis. That is the case for GRÃO-PARÁ, ISA and SUMOL+COMPAL, three companies that do not present enough information about EPS: GRÃO-PARÁ does not present any information on EPS, neither the EPS numbers nor the notes about their computation; ISA presents a few information about Basic EPS, even though
22 any disclosure about how to compute the EPS ratio, the numerator, the number of shares used in the denominator, and the reconciliation of the values used.
On the other hand, throughout the period 2012-2015, 11 out of 42, companies comply with every single item on the checklist in the four years of the period under analysis.24
Some patterns were found in the lack of information that prevents several companies from fully complying with the regulation. There should be more information on the reconciliation with the Income Statement values, as companies should clearly state the numbers in as numerator and denominator, and explain how and why they were used.
Where there discontinued operations happened, companies often forget to separately present the EPS number for discontinued, continued and the whole operations in the face of the Income Staement. Thirty three per cent (14 out of 42) of the firms discontinued operations throughout the years 2012 to 2015. Out of them, eight companies lack at least one of the discontinued or continued EPS presentation, as required by IAS 33 paragraph 68.
There is not an equal prominence between Basic EPS and Diluted EPS. The most common type of computations in the studied companies was to present Basic EPS, followed by a simple disclosure note on why Basic and Diluted EPS are equal. Overall, the lack of information and equal treatment of Basic and Diluted EPS can be explained by the low use of potential dilutive instruments that justify equal values for Basic and Diluted EPS and also by the low dilution effect present in the data analysed for the companies with a complex capital structure. Twenty one per cent of the firms (nine out of 42) do not present any indication on the type of EPS that they are presenting, given that their simple capital structure implies no difference between Basic and
23 Diluted EPS. If the use of those instruments increases, there must be an additional attention to the computation of EPS, in order to provide relevant information to all stakeholders.
5.2. Factors influencing the Reporting Compliance Index (RQ 2)
This analysis was performed on Stata. As explained, there was the need to prepare the data for a correct and valid analysis. Table 3 summarizes the results of the regression that analyses the explanatory power of the variables presented in the methodology section, namely Size, Auditor Type, Net Income and Leverage.
Table 3. Factors influencing Reporting Compliance. Reporting Compliance Index Coef. Std. Err. p-value Log Size 0,039 0,00139 0.000 Auditor Type 0,676 0,017 0.029 Net Income -0.0449 0.117 0.031 Leverage 0.106 0.008 0.001
Adjusted R2 0,969
These results provide interesting insights. Company size appears to be a significant factor. Bigger companies are more likely to have a higher compliance level. Taken into consideration the high level of resources and investors’ attention given to these companies, it is not only easier but also an additional requirement for these companies to be in high compliance with the international standards. This result is in line with the findings of Juhmani (2012) and Akhtarudin (2005), who also found size to be an influential factor in regulation compliance. Smaller firms should not sneer regulation compliance.
Being a Big Four audited company has a positive effect on the compliance level. One explanation
24 The model also indicates that companies with negative Net Income tend to have higher levels of compliance. This result can be explained by the same reasoning as before. Companies in a worse financial situation are given more attention by its investors, leading to an additional incentive to comply with regulation.
Highly leveraged companies are also given more attention by all its stakeholders, as debt payments can be a heavy burden that limits the financial slack of companies. Thus, a higher level of leverage influences positively compliance with the regulation. However, if shareholders demands are a more influential factor in a company’s business, the leverage effect on regulation compliance might have an opposite effect. This conclusion was found by several studies, as described in Demir & Bahadir (2014). Thus, there is yet to be reached a final conclusion regarding the effect of leverage on reporting compliance.
To conclude, this model in which a Compliance Index is regressed on company factors is able to identify which firms can comply with the regulation at a higher level. It addresses to three types of agents involved in financial reporting, namely standard-setters, preparers, and users of financial information. It contributes with a warning sign for the need to improve reporting compliance or an indication for the need to keep high reporting standards.
5.3. Value Relevance of EPS numbers (RQ3)
25 Table 4.Value Relevance of Basic EPS and Diluted EPS
Value Relevance of
Basic EPS Market Price
Value Relevance
of Diluted EPS Market Price
Coef. Std.
Err.
p-value
Coe
f. Std. Err. p-value
B0 -1.97 0.265 0.005 B0 1.97 - 0.265 0.05
Basic EPS 2.848 0.720 0.029
Diluted EPS
2.84
8 0.7199 0.029
Dividend per Share 1.782 2.674 0.553 Dividend per Share 1.781 2.673 0.553 Big Four 0.884 0.270 0.047 Big Four 0.884 0.270 0.046 Net Income 0.188 0.535 0.749 Net Income 0.188 0.535 0.749 Reporting Compliance
Index 1.236 0.992 0.302
Reporting
Compliance Index 1.235 0.992 0.302 Log Size 0.147 0.538 0.072 Log Size 0.147 0.054 0.072 Leverage -1.32 0.18 0.005 Leverage 1.31 - 0.178 0.005
Adjusted R2 0.340 Adjusted R2 0.340
Given the low use of dilutive instruments, and their low dilutive effect, Basic and Diluted EPS are equal in most cases. Thus, these similar results were expected. Both Basic EPS and Diluted EPS have a relevant and positive effect on market share per price. Earnings per Share ratios have relevance to investors, having its reflections on market price. As such, companies should have a positive incentive to report, present and disclose it and standard-setters should continue to improve and tighten compliance with the appropriate regulation.
6. Conclusion
26 The mandatory presentation of this ratio according to international financial reporting standards guarantees that the ratio is comparable between companies, making it valuable in investment decisions.
An analysis on reporting compliance and value relevance of EPS was performed.
A total of 42 Portuguese listed companies were studied across a four year period (2012-2015). A Reporting Compliance Index measured the level of compliance in reporting EPS according to IAS 33. The results suggest that Size, Net Income, Leverage and the Auditor are factors that influence the compliance level of a company. Furthermore, Basic and Diluted EPS are relevant to investors, as EPS numbers presented ability “to capture company value” (Karğın, 2013). This research contributed to the existing literature by adding further research to the factors that influence regulation compliance. It continues to pave the study of reporting patterns in Portugal, in qualitative and index-based approach. It also added to the existing literature of value relevance, as it analyses a specific and not studied market. The database from 2012 to 2015 and as well as the index specifically designed for this Work Project are additional contributions of this research, and will serve as input data for future research.
27
References
Accounting Foundation Organization. accountingfoundation.org. Retrieved from http://www.accountingfoundation.org/cs/ContentServer?c=Page&pagename=Foundation%2FP
age%2FFAFBridgePage&cid=1176164538898 (accessed August 20, 2016).
Alves, Sandra. 2002. ‘A Contabilização das Obrigações Convertíveis na Perspectiva do
Emitente’, Jornal de Contabilidade, n.º 309, Dezembro: 361-368.;
Alves, Sandra . 2006 . ‘O Efeito do Tratamento da Obrigações Convertíveis na Determinação
dos Resultados por Ação Diluídos. http://www.oroc.pt/fotos/editor2/R35_Contabilidade_09.pdf (
accessed on August 20, 2016)
Alves, Sandra. 2014. Resultados por Acção: Especial Ênfase na Análise da NIC 33.
Lisboa, Almedina
Akhtaruddin, M. 2005, Corporate Mandatory Disclosure Practices in Bangladesh, The International Journal of Accounting, 2005, vol. 40(4): 399-422
Balaciu, D., Cernușca, L., Teodora, I., & Mester, I. (2014). Accounting Manipulation: An
Empirical Study Regarding Managers' Behaviour.in
http://steconomiceuoradea.ro/anale/volume/2014/n1/058.pdf (accessed August 20, 2016).
Ball, R., & Brown, P. 1968. An Empirical Evaluation of Accounting Income Numbers. Journal of Accounting Research, Vol. 6 (2) :159-178.
Barnea, A., Sadan, S., & Ronen, J..1975. The Implementation of Accounting Objectives: An
Application to Extraordinary Items. The Accounting Review, Accounting Review; January
1975, Vol. 50(1): 58-68.
Beaver, W., & Dukes, R. .1972. Interperiod Tax Allocation, Earnings Expectations, and the
Behavior of Security Prices. The Accounting Review: 320-322.
Bok Baik, Bruce K. Billings & Richard M. Morton 2008 Reliability and Transparency of
Non‐GAAP Disclosures by Real Estate Investment Trusts (REITs). The Accounting Review:
March 2008, Vol. 83(2): 271-301.
Bradshaw, M., & Sloan, R. 2002. GAAP versus The Street: An Empirical Assessment of Two
28
Camodeca, R., Almici, A., & Brivio, A. R. 2014. The value relevance of accounting
information in the Italian and UK. Problems and Perspectives in Management, Volume 12(4):
512-419
Dumontier, P., & Raffournier, B. 1998. “Why Companies Comply Voluntarily with IAS: An
Empirical Analysis with Swiss Data”, Journal of International Financial Management and Accounting, vol. 9 (3): 216-245
Earnings per share: Key differences between U.S. GAAP and IFRSs. iasplus.com:
http://www.iasplus.com/en-us/standards/ifrs-usgaap/eps (accessed on August 20, 2016)
Elliot, B., & Elliot, J. 2011. Accountant’s reporting role. Em B. Elliot, & J. Elliot, Financial
Accouting and Reporting, Volume 11: 5. Edinburgh: Pearson Education Limited.
Feltham, G., & Ohlson, J. 1995. Valuation and Clean Surplus Accounting for Operating and
Financial Activities. Contemporary Accounting Research, Spring 1995; 11( 2): 689-730
Francis, J., & Schipper, K. 1999. Have Financial Statements Lost Their Relevance? Journal of Accounting Research, Vol. 37 (2): 319-352.
Freixinho, C. 2012. Reporting Earnings per Share: Evidence from Portuguese Annual Reports.
Master Thesis. Universidade Nova de Lisboa. Nova School of Business and Economics. https://run.unl.pt/handle/10362/9582 (Acessed on August 1, 2016)
Harris, T., Lang, M., & Móller, H. 1994. The Value Relevance of German Accounting
Measures: An Empirical Analysis. Journal of Accounting Research, Vol. 32 (2):187-209 Holthausen, R., & Watts, R. 2001. The relevance of the value-relevance literature for financial
accounting standard setting. Journal of Accounting and Economics. nº33 : 77- 104
Hossain, M., & Hammami, H. 2009 “Voluntary Disclosure in the Annual Reports of an
Emerging Country: The Case of Qatar”, Advances in Accounting, Incorporating Advances in International Accounting, vol. 25: 255-265.
IASC [Internactional Accounting Standards Committee] 2012. IAS 33 – Earnings per Share.
Accessed on July 31, 2016)
Jeffrey Wooldridge. 2012. Introductory Econometrics: A Modern Approach, 5th Edition,
29 Karğın, S. 2013. The Impact of IFRS on the Value Relevance of Accounting Information: Evidence from Turkish Companies. International Journal of Economics and Finance; Vol. 5
(4):71-80
Karunarathne, & Rajapakse. 2010. The Value Relevance of Financial Statements Information
with Special Reference to the Listed Companies in Colombo Stock Exchange. http://kln.ac.lk/uokr/ICBI2010/42.pdf ( Acessed on August 15, 2016)
Lipe, R. C. 1986. The Information Contained in the Components of Earnings. Journal of
Accounting Research, , Studies on Alternative Measures of Accounting Income (1986), Vol.
24: 37-64
Maines, L. A., & McDaniel, L. S. 2000. Effects of Comprehensive-Income Characteristics on
Nonprofessional Investors' Judgments: The Role of Financial-Statement Presentation Format.
The Accounting Review:179-207.
Malik, M. F., Qureshi, M. U., Azeem, M. 2012. Determination of Share Price: Evidence from
Karachi Stock Exchange. The Romanian Economic Journal, Vol. XV (3): 43-97.
Millar, J., & Nunthirapakorn, T. 1991. Earnings per Share Reporting for Canadian Companies
with Complex Capital Structures. Journal of Business Finance & Accounting, January 1991:
306- 686.
Munter, P. 1997. Earnings Per Share Reporting Under the New FASB Standard. The Joumal of
Corporate Accounting and Finance, Summer 1997, Volume 8(4):1–123.
Ross, J., LeCiere, M. J., & Thom, R. B. 1997. Evidence on the Usefulness of Alternative
Earnings per Share Measures. Financial Analysts Journal, Financial Analysts Journal, 53(6):
24- 33.
Stunda, R. A., & Wills, M. B. 2015. Big GAAP vs Little GAAP. Journal of Business & Economics Research, May 2012 Volume 10, Number 5
Volkan Demir & Oğuzhan Bahadir 2014. “An investigation of compliance with International Financial Reporting Standards by listed companies in Turkey”, Accounting and Management Information Systems, Vol. 13(1),:4–34.
30
Zhang, M. 2008. “A Theoretical and Empirical Study of Computing Earnings Per Share.”
http://pdffinder.net/Title-of-Dissertation:-A-Theoretical-and-Empirical-Study-of.html, (Accessed on August 12, 2016)
Appendix
Appendix 1 - Overview of EPS Regulation
Regulating how and when EPS is revealed has been a matter of concern for domestic and international standards setters, from the start of the regulatory activities in the US, and later in the IASC and almost every country.
The first mandatory regulation about EPS was APB Opinion No. 15,Earnings per Share, issued in
1969 by FASB in the US. This was one of the main and first attempts “to standardize EPS reporting” (Freixinho, 2012). Nonetheless, years before the focus on the EPS value led to guide releases on how to calculate EPS, encouraging its presentation to inform common shareholders about company performance. Among the instructions given, was already suggested to report the effect of diluting instruments25 (Zhang, 2008). If dilutive instruments were present in their capital structure, it mandated companies to present two types of EPS: Primary and Fully Diluted EPS.26 In 1997, a new reporting standard was set, the Statement of Financial Accounting Standards (SFAS) No. 128, Earnings per Share (FASB, 1997). This standard, designed in collaboration with
25 Companies were recommended to report a pro forma diluted EPS that would indicate the reduction in earnings due to the dilution effects.
31 international accounting associations27, also demanded two types of EPS for companies with
complex financial instruments. Primary EPS is substituted by Basic EPS, in which fewer instruments are assumed to be converted. 28
The need for comparability of EPS between companies across the globe led to issuance of IAS 33 (IASC, 2003), a regulatory framework that began to take shape ten years before and which was aligned with the US regulation, Consequently, it also demands reporting the same two types of EPS, Basic and Diluted EPS (Zhang, 2008). Improvements and amendments to both regulations have been approved since 2003. 29
Various countries developed domestic EPS regulation, in accordance with the Financial Accounting Standards Board (FASB) and IAS 33. Following EC Regulation Nr. 1606/2002, IAS / IFRS should be adopted from 2005 onwards by companies with listed shares in any EU stock exchange, when preparing consolidated reports. An analysis of the differences between these two regulations can be consulted next. Companies with shares listed firm in European Union Stock Exchange shall apply IAS 33 when reporting consolidated EPS, since 2005 onwards, according to EC Regulation 10606/2002.30
27 A common standard began to be developed in 1993 between the International Accounting Standards Committee (IASC) and the Financial Accounting Standards Board (FASB).
28 Diluted EPS is similar to the fully diluted EPS, involving the assumption that all potential dilutive instruments are converted. (Ross, LeCiere, & Thom, 1997). Consequently, the new standard, SFAS No. 128, defines a range for the real EPS value, in which the limits are the cases of total dilution and no dilution. Deciding where in that ranges the actual earnings per share is up to the investor, who needs to analyze the odds of a given financial instrument being convertedand its impact on EPS and its potential return.
29 Despite the international regulatory framework, even though it represented a major step towards similar regulations, it was still a work in progress project, as there were still some differences in the accounting treatment of some potential dilutive financial instruments.
30 The only reference in the domestic regulation is as follows:
32 As for Portugal, the SNC (Sistema de Normalização Contabilística), which is the domestic
adaptation to IAS /IFRS that applies to non-listed companies, it does not include a standard concerning EPS, but both Basic EPS and Diluted EPS are included in the model for presentation of the Income statement, being shown at the bottom line of the statement. In the absence of domestic regulation, the international standard IAS 33 should apply.
SFAS 95 versus IAS 33
Investment companies and wholly owned companies are not required to compute EPS under US reporting standard, while IAS 33 demands presentation as long as companies are listed or potentially listed (Munter, 1997).
Thus, as IAS 33 states in its Objective statement in paragraph 1, the focus of this regulation is on the denominator, as a “consistently determined denominator enhances financial reporting”.
IAS 33 demands reporting an EPS even in the case where there is a loss per share. The US Standard does not demand the presentation of a loss per share.
The numerator of EPS ratio involves several accounting rules that lead to an earnings number, which result in several differences between USA and international EPS reporting.
Regarding extraordinary items, the USA rule allows for an EPS calculation for this type of items, while the International standard does not allow companies to present EPS calculations for extraordinary items.
Furthermore, there are some differences in technical accounting rules.
33 Forward and options contracts are also subject to different rules, depending on its contractual conversion options. (Earnings per share: Key differences between U.S. GAAP and IFRSs )
There are some differences when computing the Diluted EPS number. Regarding contracts that may be settled in cash or shares, IAS33 demands the assumption that those contracts will be settled in shares,
34
Appendix 2 - Final Sample
Initial Sample Reasons for Exclusion Final Sample
Altri SGPS, S.A. - Altri SGPS, S.A.
Banco Comercial Português, S.A. - Banco Comercial Português,
S.A. Banco Português de Investimento,
S.A.
- Banco Português de
Investimento, S.A. Banco Santander Totta SGPS,
S.A.
- Banco Santander Totta SGPS,
S.A. Sport Lisboa e Benfica - Futebol,
SAD
Different reporting period Excluded
Cimpor Cimentos de Portugal SGPS, S.A.
- Cimpor Cimentos de Portugal
SGPS, S.A.
Cofina SGPS S.A - Cofina SGPS S.A
Compta - Equipamentos e Serviços de Informática, S.A.
- Compta - Equipamentos e
Serviços de Informática, S.A.
Corticeira Amorim, SGPS, S.A - Corticeira Amorim, SGPS,
S.A
CTT - Correios de Portugal,S.A. - CTT - Correios de
Portugal, S.A.
EDP - Energias de Portugal S.A - EDP - Energias de Portugal
S.A
EDP Renováveis, S.A. - EDP Renováveis, S.A
Estoril Sol, SGPS, S.A - Estoril Sol, SGPS, S.A
F. Ramada - Investimentos, SGPS, S.A
- F. Ramada - Investimentos,
SGPS, S.A Futebol Clube do Porto - Futebol
SAD
Different reporting period Excluded
Galp Energia SGPS, S.A - Galp Energia SGPS, S.A
Glintt - Global Intelligent Technologies, S.A
- Glintt - Global Intelligent
Technologies, S.A
Ibersol - SGPS, S.A. - Ibersol - SGPS, S.A.
Imobiliária Construtora Grão-Pará, S.A
- Imobiliária Construtora
Grão-Pará, S.A.
Impresa - SGPS, S.A - Impresa - SGPS, S.A
Inapa-Investimentos Participações e Gestão,
S.A
Annual Reports were not available. Excluded
ISA - Intelligent Sensing Anywhere, S.A.
ISA - Intelligent Sensing Anywhere, S.A.
Jerónimo Martins SGPS S.A. - Jerónimo Martins SGPS S.A.
Lisgráfica - Impressão e Artes Gráficas, S.A.
- Lisgráfica - Impressão e
Artes Gráficas, S.A.
Luz Saúde, S.A. - Luz Saúde, S.A.
35 Initial Sample Reasons for Exclusion Final Sample
Media Capital SGPS S.A. - Media Capital SGPS S.A.
Montepio In this period of analysis, Montepio
suffered a restructure of its activities
which consequently prevents
comparison analysis.
Excluded
Mota-Engil, SGPS, S.A. - Mota-Engil, SGPS, S.A.
Nexponor Sicafi Annual Reports were not available. Excluded
NOS, SGPS, S.A. NOS, SGPS, S.A.
Novabase, SGPS, S.A. Novabase, SGPS, S.A.
Sociedade Comercial Orey Antunes S.A.
Sociedade Comercial Orey Antunes S.A.
Pharol Relevant information could not be
gathered for comparison analysis.
Excluded
Reditus - SGPS, S.A. Reditus - SGPS, S.A.
REN - Redes Energéticas Nacionais, SGPS, S.A.
REN - Redes Energéticas Nacionais, SGPS, S.A. SAG GEST - Soluções
Automóveis Globais SGPS S.A.
SAG GEST - Soluções Automóveis Globais
SGPS S.A. SDC Investimentos, S.G.P.S.,
S.A. SDC Investimentos, S.G.P.S., S.A.
Semapa - Sociedade de Investimento e Gestão,
SGPS, S.A
Semapa - Sociedade de Investimento e Gestão,
SGPS, S.A
Sonae, SGPS, S.A. Sonae, SGPS, S.A.
Sonae Capital SGPS, S.A. Sonae Capital SGPS, S.A.
Sonae Indústria, SGPS, S.A. Sonae Indústria, SGPS, S.A.
Sonaecom SGPS S.A. Sonaecom SGPS S.A.
Sporting - Sociedade Desportiva de Futebol,
SAD
Different reporting period Excluded
Sumol+Compal, S.A Sumol+Compal, S.A
Teixeira Duarte - Engenharia e Construções,
S.A.
Teixeira Duarte - Engenharia e Construções,
S.A.
The Navigator Company, S.A. The Navigator Company,
S.A.
Toyota Caetano Portugal, S.A. Toyota Caetano Portugal,
S.A. VAA-Vista Alegre Atlantis,
SGPS, SA
36
Appendix 3 - Industry and Sectorial distribution of companies
Industry Analysis
Code Industry Number of
Companies
%
0001 Oil&Gas 1 2.38%
1000 Basic Materials 3 7.14%
2000 Industrials 12 28.57%
3000 Consumer Goods 3 7.14%
4000 Health Care 1 2.38%
5000 Consumer Services 9 21.43%
6000 Telecommunication
s
1 2.38%
7000 Utilities 3 7.14%
8000 Financials 4 9.52%
9000 Technology 5 11.90%
SuperSector Analysis
Code SuperSector Number of
Companies
%
0500 Oil & Gas 1 2.38%
1700 Basic Resources 3 7.14%
2300 Construction &
Materials
6 14.29%
2700 Industrial Goods& Services
6 14.29%
3500 Food&Beverage 2 4.76&
3700 Personal&Househol
d Goods 1 2.38%
4500 Health Care 1 2.38%
5300 Retail 3 7.14%
5500 Media 4 9.52%
5700 Travel&Leisure 2 4.76%
6500 Telecommunication
s
1 2.38%
7500 Utilities 3 7.14%
8300 Banks 3 7.14%
8700 Financial Services 1 2.38%
37
Appendix 4 - Variance Covariance Matrix of studied variables
Leverage Basic EPS Diluted EPS
Market per Share
Dividend Big4 Net Incom
e
Log Size
Leverage 1
Basic EPS -0.23 1
Diluted EPS -0.23 1 1
Market per share -0.24 0.51 0.51 1
Dividend -0.16 0.39 0.39 0.34 1
Big4 -0.00 0.19 0.189 0.24 0.19 1
Net Income -0.35 0.65 0.645 0.35 0.25 -0.05 1
Log Size -0.22 0.39 0.39 0.38 0.28 0.234 0.30 1
Appendix 5 -Dilutive instruments and effects identified
Company Dilutive Variables Dilutive Effect Years
BCP CoCo No dilutive effect 2012-2015
BPI CoCo and Stock Options Convertible debt 2014
Stock options exercised 2015
EDP Employee Stock Options Stock options exercised 2012-2014
Martifer Employee Stock Options No dilutive effect 2012-2015
Sonae Employee Stock Options and Convertible Debt
Convertible debt 2014-2015
Stock options exercised 2012-2015 SonaeCom Employee Stock Options No dilutive effect 2012-2013
Sonae Indústria
Convertible Debt No dilutive effect 2012-2014
38
Appendix 6 - Reporting Compliance Index Items
Item Score
EPS on Income Statement? 1/0
Note on EPS computation 1/0
Dilutive instruments? Y/N
Dilution? Y/N
Detailed info on each dilutive instrument? 1/0
Instruments with anti dilutive effect
disclosed? 1/0
Discontinued operations? Y/N
EPS for discontinued operations? 1/0
EPS, B and D, from continuing operations in
Statement 0/0,5/1
EPS, B and D, from whole operations in
Statement 0/0,5/1
Numerator for BEPS disclosed? 1/0
Numerator for DEPS disclosed? 1/0
Reconciliation? 1/0
Denominator for BEPS disclosed? 1/0
Denominator for DEPS disclosed? 1/0
Reconciliation? 1/0
Ordinary share transaction after end of
reporting period? Y/N
Description? 1/0
Basic and Diluted with equal prominence? 1/0
Other amount per share Y/N
39
Appendix 7 - Information on Reporting Compliance
2012 2013 2014 2015
Average Compliance Level 0.83 0.848 0.85 0.87
Firsm with perfect Score 11 11 11 12
Companies who improved their score - - - 15
Companies who worsened their score - - - 4
Companies who improved their score – Yearly - 10 7 4 Companies who worsened their score - Yearly - 5 3 4
Companies with compliance above 90% 15 16 18 18