Comparison of cloud height and depth from atmospheric modelling
and ceilometer measurements
D. Santos*
a, M. J. Costa
a,b, A. M. Silva
a,b, R. Salgado
a,b, and D. Bortoli
a,ca
Évora Geophysics Centre, University of Évora, Rua Romão Ramalho 59, 7000 Évora, Portugal;
bDepartment of Physics, University of Évora, Rua Romão Ramalho 59, 7000 Évora, Portugal;
c
Institute of Atmospheric Sciences and Climate (ISAC-CNR), Via Gobetti 101, 40129 Bologna, Italy
ABSTRACT
In the current study, the cloud base height obtained from the ceilometer measurements, in Évora (south of Portugal), are compared with the results obtained from atmospheric modelling. The atmospheric model adopted is the nonhydrostatic MesoNH model, initiated and forced by ECMWF (European Centre for Medium–Range weather Forecasts) analyses. Also the simulated cloud depth results are presented. The availability of mesoscale modelling for the region, as well as the cloud local vertical distributions obtained from the ceilometer, provide a good opportunity to compare cloud base height and estimate the errors associated. From the obtained results it is possible to observe that the simulated cloud base height values are in good agreement with the correspondent values obtained from the ceilometer measurements.
Keywords: Atmospheric modelling, Ceilometer, Cloud height, Cloud depth
1. INTRODUCTION
Clouds cover almost two thirds of the global surface. Depending on their properties, clouds can reflect incoming solar radiation, thus cooling the Earth-atmosphere system, reducing outgoing infrared radiation, and warming the system1,2. Information about cloud composition, structure and vertical distribution is of vital importance for the understanding of the radiation balance and energy budget of the earth-atmosphere system3. In this sense, cloud height and depth are significant parameters that need to be accurately determined.
A VAISALA Ceilometer CL31 is a compact and lightweight instrument that uses a pulsed diode laser LIDAR (light detection and ranging) technology, where short, powerful laser pulses are sent out in a vertical or near vertical direction, and may be very useful for cloud studies. This instrument measures the reflection of light (backscatter) caused by clouds, precipitation or other obscuration, which is analyzed and used to determine the cloud base height. A VAISALA CL31 Ceilometer is installed in the observatory of the Évora Geophysics Centre (CGE), as shown in Fig. 1, since the beginning of May 20064. The instrument measures the cloud base height up to three layers simultaneously, as well as the atmospheric backscattering.
The CL31 uses a second generation of advanced single lens design, providing excellent performance, which is used for transmitting and receiving light. This ceilometer also has a measurement range from 0 to 7.5km, maximum reporting resolution of 5m and programmable measurement cycle (from 2 to 120s). The CL31 uses an eye-safe laser InGaAs diode at 910nm.A full description of Vaisala CL31 Ceilometer can be found at http://vaisala.com.
Particular attention must be paid to the representation of clouds in atmospheric models, since the formation and spatial distribution of clouds and precipitation is crucial for numerical weather prediction as well as for climate modelling5. Unfortunately, each individual cloud itself is a very complex non linear sub-system of the atmosphere2.
Fig. 1. VAISALA Ceilometer CL31, installed in the CGE observatory in Évora (38º34’ N, 7º54’’W, 300m a.m.s.l.), in the South of Portugal.
The aim of this study is to compare the cloud base height values obtained from the ceilometer measurements, in Évora, with the results obtained from atmospheric modelling. In this work, the atmospheric model adopted is the MesoNH model6.
MesoNH is a mesoscale, nonhydrostatic model that has been developed by the Centre National de la Recherche Meteorologique (CNRM, Meteo France) in cooperation with the Laboratoire d’Aeérologie (LA, CNRS). A complete description of this model can be found at http://mesonh.aero.obs-mip.fr/. MesoNH is able to simulate atmospheric circulations from small to synoptic scales with a horizontal resolution ranging from a few meters to several tens of kilometers and it can run in a two-way nested mode concerning up to 8 nesting stages.
Parameterizations for turbulence7, shallow and deep convection8 and cloud microphysics9 are included. The explicit bulk microphysical scheme includes the treatment of the three water phases with five species of precipitating and nonprecipitating liquid and solid water9. The subgrid-scale convection is parameterized by a mass-flux convection scheme8, which simulate some properties of convective clouds, particularly its base and top heights.
MesoNH is also coupled to an externalized surface model (SURFEX) which computes the fluxes between the atmosphere and the surface, taking into account the soil-vegetation-atmosphere exchanges10. MesoNH uses the Morcrette and Fouquart11,12 ECMWF radiative transfer model to compute the shortwave and longwave radiative fluxes. In the shortwave spectral region clouds are described by means of the Delta Eddington approximation13.
Since the presence of dust aerosols are taken into account in the cloud microphysical schemes used in the model, MesoNH model includes a dust schemewhich uses the Dust Entrainment and Deposition Model14 to describe dust sources and sinks while dust advection and diffusion are quantified by the transport processes.
In the simulations performed, the MesoNH was initiated and forced by six-hourly ECMWF analyses. The simulations started at 00:00 UTC on 26 May 2006 and ended at 00:00 UTC 30 May 2006. The first day of simulation has been used as a model spin-up period. For this work, MesoNH run in a two way nested mode on two grids. In the horizontal plane, the coarser domain had 60 x 90 grid points, with 50 km grid spacing, and the finer domain had 150 x 225 points and a space resolution of 10 km, as shown in Fig. 2. In the vertical, 49 layers were used from the surface up to 24km height.
Fig.2. Simulation domains with topography (m): 50-km mesh size coarser domain (a) and 2km mesh size innermost domain (b)
2. RESULTS AND DISCUSSION
The considered period of study is between the 26 and 30 May 2006. During this period, on days 27 and 28 May low and medium altitude clouds were observed in the afternoon, while in the other days only very few clouds were observed over the region in study. Therefore only the results referring to 27 and 28 May will be analysed and compared with the simulated data obtained from MesoNH. Figs. 3a and 3b show the ceilometer backscattering measurements for 27 and 28 May 2006, respectively, from 0:00 to 24:00 UTC, in Évora.
Fig. 3. CL31 ceilometer backscatter coefficient measurements taken in Évora on 27 (a) and 28 (b) May 2006, from 0:00 to 24:00.
From Figs. 3a and 3b it is noted that in this period most of the clouds occurred in the afternoon. Between 18:00 and 22:00 UTC it is possible to observe, particularly on 28 May, the formation of convective clouds. For that reason the time interval between 18:00 and the 22:00 UTC was selected for both days.
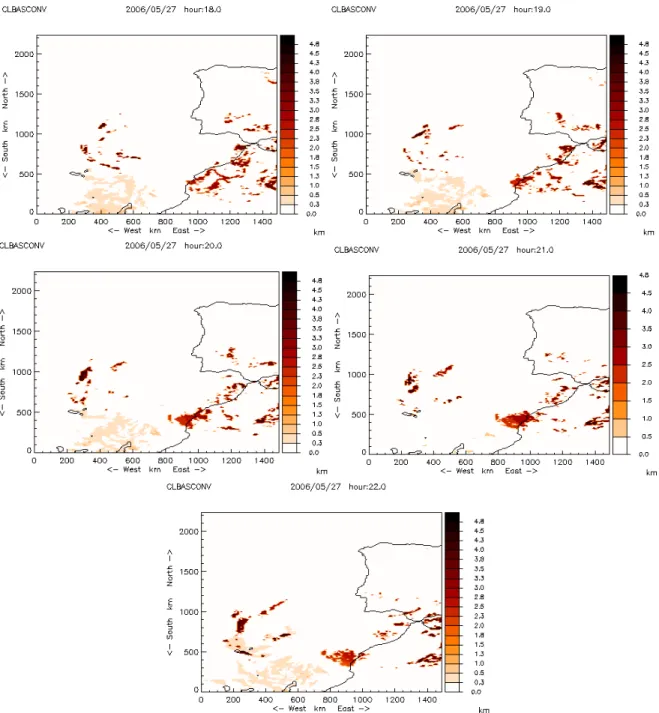
Concerning convective clouds MesoNH provides two important parameters: the base height of convective clouds (CLBASCONV) and the top height of convective clouds (CLTOPCONV). Figs 4 and 5 show the hourly CLBASCONV
(a) (b)
simulated results obtained for 27 and 28 May, respectively, between 18:00 and 22:00 UTC. The MesoNH simulated results correspond to the smallest innermost domain (10km resolution).
Fig. 4. Simulated base height of convective clouds, over Portugal and nearby Atlantic Ocean, for 27 May 2006, between 18:00 and 22:00 UTC.
According to Fig. 4, it is possible to observe that the model simulates the development of convective clouds over different regions, namely over the Atlantic Ocean, the Atlas region in North Africa and the south of Iberian Peninsula. The convective clouds that are formed over the ocean region are more persistent in the same geographical area, than over
land, particularly over Iberian Peninsula where the formation, development and dissipation of clouds occur in a shorter time interval.
On 28 May 2006, according to Fig.5, it is possible to observe that, for both continental and oceanic regions, the convective clouds are more confined to the same geographical regions as compared to the previous day and the convective clouds are more confined to the same geographical regions as compared to the previous day and their occurrence, particularly over the Iberian Peninsula and North Africa, seem to reduce from 18:00 to 22:00 UTC.
One can notice that the modeled convective clouds are not positioned over Évora. On 27 May (Fig. 4) the convective clouds are located east of the Évora area, and on 28 May (Fig. 5) the clouds are situated in the Center/North of Portugal. Therefore, in order to compare the CLBASCONV modeled height with the ceilometer measured cloud base, the height of CLBASCONV, averaged over the closest area from Évora geographical site, was considered.
Tables 1 and 2 present the CLBASCONV simulated height values and the ceilometer measured cloud base height values for 27 and 28 May 2006, respectively. The ceilometer measurements were averaged over time, considering the closest 15 minutes to the time of simulated data. The correspondent standard deviation values are also presented in both Tables. For 28May (Table 2), around 21:00 UTC, the ceilometer did not detect any cloud, although the corresponding simulated value height of CLBASCONV is presented.
Table. 1. CL31 ceilometer measured cloud base height and simulated convective cloud base height for 27 May 2006.
27 May 2006 Ceilometer Cloud Base Height (km) Cloud Base Height (km) Simulated Convective 18:00 UTC
3.5
±
0.5
3.3
±
0.3
19:00 UTC3.5
±
0.5
3.3
±
0.5
20:00 UTC3.8
±
0.5
3.4
±
0.2
21:00 UTC4.0
±
0.9
3.5
±
0.2
22:00 UTC4.0
±
0.2
3.6
±
0.2
From the comparison of results, shown in tables 1 and 2, it is possible to observe that although the model slightly dislocates geographically the locations of the convective clouds (Figs. 4 and 5), the modeled cloud base height values seem to be in good agreement with the correspondent VAISALA Ceilometer measurements. These results encourage analyzing other situations and more days are already planned to be investigated.
Table. 2. CL31 ceilometer measured cloud base height and simulated convective cloud base height for 27 May 2006.
28 May 2006 Ceilometer Cloud Base Height (km)
Simulated Convective Cloud Base Height (km) 18:00 UTC
3.4
±
0.6
3.6
±
0.4
19:00 UTC3.4
±
0.6
3.5
±
0.7
20:00 UTC3.6
±
1.6
3.4
±
0.8
21:00 UTC -
3.5
±
0.8
22:00 UTC
4.7
±
0.2
3.5
±
0.8
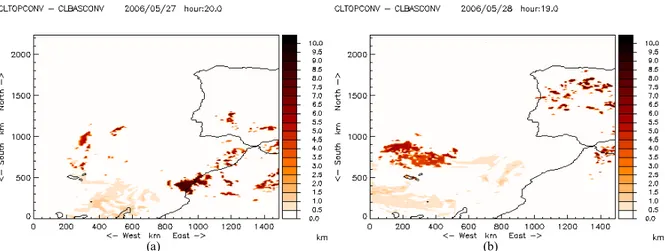
Another important parameter for cloud studies, especially for cloud precipitation studies15, is the cloud depth of convective clouds. In this study the simulated cloud depth was estimated as the difference between the height of top of convective clouds (CLTOPCONV) and the height of base of convective clouds (CLBASCONV).
Figs. 6a and 6b show an example of the cloud depth estimated results obtained for 27 and 28 May, respectively. To note that, in continental regions (Iberian Peninsula and Northern Africa) the cloud depth values found are greater than the cloud depth values found over the Atlantic Ocean region.
Fig. 6. Simulated cloud depth of convective clouds over Portugal and nearby Atlantic Ocean for 27 May 2006 (a) and 28 May 2006 (b).
Table 3 shows the results obtained for the estimation of cloud depth values, averaged over the closest area from Évora geographical site, between 18:00 and 22:00 UTC. The model predicts the development of very deep convective clouds at late afternoon (18::00) and that its thickness decreases as night approaches. Further investigation is needed and comparisons with satellite date may be of great value.
Table. 3. Cloud depth estimated results for 27 and 28 May 2006.
27 May 2006 Simulated Convective Cloud Depth (km) 28 May 2006 Simulated Convective Cloud Depth (km) 18:00 UTC
7.0
±
1.0
18:00 UTC6.7
±
1.3
19:00 UTC6.9
±
1.0
19:00 UTC6.8
±
1.2
20:00 UTC6.5
±
0.8
20:00 UTC6.7
±
1.3
21:00 UTC6.1
±
0.8
21:00 UTC6.5
±
1.3
22:00 UTC5.8
±
0.7
22:00 UTC6.0
±
1.2
3. CONCLUSIONS
The aim of this study is the comparison between the cloud base height values obtained from ceilometer measurements and the results obtained from atmospheric modelling, over Évora in the South of Portugal. In addition, the cloud depth values are also estimated by means of the model for the area considered.
From the results it is possible to conclude that, although the simulated results of the cloud locations are slightly spatially dislocated from the observation site, the simulated values of the base height of convective clouds agree fairly well with the ones obtained from measurements.
It is planned to proceed with this work and extend the comparisons between measurements and modeling for longer periods and various cloud types, in order to quantify the model error.
ACKNOWLEDGEMENTS
The work was funded by the Portuguese FCT through grant SFRH/BD/27870/2006 and through project PTDC/CTE-ATM/65307/2006.
REFERENCES
[1] Forster, P., Ramaswamy, V., Artaxo,P., Berntsen, T., Betts, P. R., Fahey, D.W. , Haywood, J. , Lean, J. , Lowe, D.C. Myhre, G. , Nganga, J., Prinn, R. , Raga, G. ,Schulz M. and Van Dorland, R., Changes in Atmospheric Constituents and in Radiative Forcing. In: “Climate Change 2007: The Physical Science Basis. Contribution of Working Group I to the Fourth Assessment Report of the Intergovernmental Panel on Climate Change” [Solomon, S., D. Qin, M. Manning, Z. Chen, M. Marquis, K.B. Averyt, M.Tignor and H.L. Miller (eds.)]. Cambridge University Press, Cambridge, United Kingdom and New York, NY, USA (2007).
[2] Heintzenberg, J., and Charlson, R. J. “Clouds in the Perturbed Climate System: Their Relationship to Energy Balance”, Atmospheric Dynamics, and Precipitation (Strüngmann Forum Reports), 0262012871, The MIT Press (2009).
[3] Liou, K. N., “An Introduction to Atmospheric Radiation”, 2 nd. Ed.,. 583 pp., Academic press, San Diego, CA (2002).
[4] Costa, M. J., D. Bortoli, V. Costa, A. M. Silva, F. Wagner, S. Pereira, J. L. Guerrero-Rascado and L. Alados-Arboledas, “Analysis of the measurements taken by a Ceilometer installed in the south of Portugal”. In Remote Sensing of Clouds and the Atmosphere XII, edited by Adolfo Camerón, Klaus Schäfer, James R. Slusser, Richard H. Picard, Also Amodeo, Proceedings of SPIE, (SPIE Bellingham, WA, 2007) Vol. 6745, 674523-1 - 674523-12, (2007).
[5] Randall, D. A., Wood, R. A., Bony, S., Colman, R. , Fichefet, T., Fyfe, J., Kattsov, V. , Pitman, A., Shukla, J., Srinivasan, J., Stouffer, R. J., Sumi, A. and Taylor, K. E.: Climate Models and Their Evaluation, In: “Climate Change 2007: The Physical Science Basis. Contribution of Working Group I to the Fourth Assessment Report of the Intergovernmental Panel on Climate Change” [Solomon, S., D. Qin, M. Manning, Z. Chen, M. Marquis, K.B. Averyt, M.Tignor and H.L. Miller (eds.)]. Cambridge University Press, Cambridge, United Kingdom and New York, NY, USA.
[6] Lafore, J.-P., J. Stein, N. Asencio, P. Bougeault, V. Ducrocq, J. Duron, C. Fischer, P. Héreil, P. Mascart, V. Masson, J.-P. Pinty, J.-L. Redelsperger, E. Richard, and J. Vilà-Guerau de Arellano, "The Meso-NH Atmospheric Simulation System. Part I: adiabatic formulation and control simulations, Scientific objectives and experimental design,” Ann. Geophys., 16, 90-109 (1998).
[7] Bougeault, P., and P. Lacarrére, “Parameterization of orography-induced turbulence in a meso-beta model”. Mon. Weather Rev., 117: 1872-1890 (1989).
[8] Bechtold, P., E. Bazile, F. Guichard, P. Mascart, and E. Richard, “A mass-flux convection scheme for regional and global models”. Q. J. R. Meteorol. Soc.127: 869-886 (2001).
[9] Cohard, J., and J. Pinty, “A comprehensive two-moment warm microphysical bulk scheme. II: 2D experiments with a non-hydrostatic model.” Q. J. R. Meteorol. Soc., 126: 1843-1859 (2000).
[10] Noilhan, J., and J. Mahfouf , “The ISBA land surface parameterization scheme,” Global Planet. Change 13: 145–159 (1996).
[11] Morcrette, J.-J. and Fouquart, Y., “The overlapping of cloud layers in shortwave radiation parameterizations.” J. Atmos. Sci.43:321-328 (1986).
[12] Morcrette, J.-J., Smith, L. and Fouquart, Y., “Pressure and temperature dependence of the absorption in longwave radiation parametrizations.” Beitr. Phys. Atmos. 59 : 455-469 (1986).
[13] Joseph, J., W. Wiscombe, and J. A. Weinman, “The Delta-Eddington approximation for radiative flux transfer, J. Atmos. Sci.”, 33, 2452–2459 (1976).
[14] Zender, C., H. Bian, and D. Newman, “The mineral dust entrainment and deposition (DEAD) model: Description and global dust distribution.” J. Geophys. Res. 108 (D14):4416 (2003).
[15] K. A. Browning and Robert J. Gurney, “Global Energy and Water Cycles,” pp. 304. ISBN 0521560578. Cambridge, UK: Cambridge University Press (1999).