Universidade Nova de Lisboa
Instituto de Higiene e Medicina Tropical
Infrastructure, WASH Practices, and Health: A Study of Rural
Communities in São Tomé e Príncipe
Author: Alexander Goggins
Advisor: Professor Luzia Gonçalves
Thesis presented to fulfill the necessary requirements to obtain the degree of Master of Science of Public Health and Development
ii Resumo:
Introdução:
Melhorar os comportamentos de higiene e o saneamento (WASH) é uma maneira económica de reduzir os problemas que as doenças da pobreza e das doenças tropicais trazem, especialmente em comunidades pobres. Em setembro de 2016, um surto de infeções de pele foi acompanhado pela Organização Mundial da Saúde e os questionários aplicados evidenciaram que as questões de higiene em São Tomé e Príncipe merecem mais atenção, principalmente nas comunidades rurais da ilha. Assim, este estudo teve como objetivo caracterizar o comportamento de WASH e as infraestruturas relacionadas com três comunidades rurais, a fim de identificar áreas com maiores necessidades, explorando como os comportamentos em termos de WASH e outros fatores relacionam com alguns problemas de saúde relatados no último mês.
Material e Métodos:
Este estudo transversal ocorreu entre fevereiro e abril de 2019, no distrito de Lobata, em São Tomé e Príncipe, tendo-se recolhido uma amostra aleatória de dimensão n=162. Para a seleção aleatória usou-se a aplicação Random UX. Os dados foram recolhidos através de um questionário digitalizado no programa Qualtrics e aplicado a residentes adultos em três comunidades rurais: C - Canavial (n=56), P - Plancas (n=49) e I - Ilheu (n=57). Após uma análise exploratória de dados e testes de hipóteses (paramétricos e não-paramétricos), utilizaram-se modelos Log-lineares e de regressão logística simples e múltipla.
Resultados:
Encontramos diferenças significativas no uso de fontes naturais de água e na melhoria dos locais de lavagem de roupas entre as três comunidades. Relativamente as latrinas nota-se que faltam nas três comunidades. Canavial e Plancas parecem ter practices menos adequadas. Apenas 8.0% dos participantes no estudo relataram que têm acesso a caso de banho, com diferenças significativas por comunidade (8.9% C; 0.0% P e 14.0% I, p=0.015). Em termos de acesso a uma latrina há diferenças muito significativas entre as três comunidades (7.1% C; 22.3% P e 40.4% I, p<0.001). Em termos de água canalizada, as percentagens são também reduzidas (5.4% C; 0.0% P e 19.3% I, p=0.001). Também identificamos associações entre o uso de fontes naturais de água para beber e outros usos, e o uso de fontes naturais de água para limpar roupas e mais problemas de saúde no mês anterior à recolha de dados. O uso de recipientes fechados para o armazenamento de água foi associado a menos problemas de saúde, sendo um possível fator de proteção de reduzido custo que pode ser útil para intervir nessas comunidades.
Conclusões: Neste estudo registou-se a falta de casas de banho, latrinas e água apropriadas em todas as comunidades e registam-se práticas menos adequadas de WASH, principalmente, em Canavial e Plancas. São necessárias mais pesquisas sobre a qualidade das fontes naturais de água, para entender melhor os riscos que esse tipo de armazenamento de água pode trazer a estas comunidades.
iii Abstract:
Introduction:
Improving hygiene and sanitation (WASH) behaviors is an cost effective and sustainable way to reduce the problems that diseases of poverty and tropical diseases bring, especially in poor communities. In September 2016, an outbreak of necrotizing fasciitis was reported and monitored by the World Health Organization and subsequent inquiries suggested hygiene issues in Sao Tome and Principe that merit further attention, especially in the rural communities of the island. Thus, the aim of the study is to characterize the WASH behavior and related infrastructure of the three rural communities in order to identify areas of greatest need, exploring how WASH behaviors and other factors relate to some reported health problems.
Materials and Methods:
This cross-sectional study took place between February and April 2019, in the Lobata district of São Tomé and Príncipe, and a random sample size n = 162 was collected. For random selection the Random UX application was used. Data were collected through a digitized Qualtrics questionnaire and applied to adult residents in three rural communities: C - Canavial (n = 56), P - Plancas (n = 49) and I - Ilheu (n = 57). After an exploratory data analysis and hypothesis tests (parametric and non-parametric), a log-linear analysis and simple and multiple logistic regression models were developed and run.
Results:
We found significant differences in the use of natural sources of water and improved washing facilities between the three communities. Furthermore, a serious lack of appropriate latrines in all communities and sub-optimal WASH practices in Canavial and Plancas. Only 8.0% of study participants reported having access to bathrooms, with significant differences by community (8.9% C; 0.0% P and 14.0% I, p = 0.015). there were significant differences between the three communities in terms of latrine access (7.1% C; 22.3% P and 40.4% I, p <0.001). Regarding indoor plumbing, the percentages are also low (5.4% C; 0.0% P and 19.3% I, p = 0.001). We also identified associations between the use of natural sources of water (for both drinking and other uses) and the use of natural water sources to clean clothes with more health problems in the month prior to data collection. Finally, the use of closed bottles for water storage has been associated with fewer health problems, a possible low-cost protection factor that may be useful for intervening in these communities.
Conclusions:
In this study, a lack of adequate bathrooms, latrines and sources of clean water in all communities was identified, as well as less than adequate WASH practices, mainly in Canavial and Plancas. Further research on the quality of natural water sources is needed to better understand the risks that such types of water storage may bring to these communities.
iv Dedication: I would like to dedicate this work to my mentor and Professor, Fernando Arenas. His passion for Portuguese and the Lusophone world was instrumental in developing my interest in Portugal, and none of this would be possible without him. May I honor his legacy through this work and all that follow.
v Acknowledgements: I wish to extend a heartfelt thank you to Professor Gonçalves for the support and guidance throughout this project, without whom this work would not have been possible. Furthermore, I wish to thank Catia Gonçalves and her family for hosting me and offering logistical support during my time in country, as well as aid in the pre-testing and application of the questionnaire. Many thanks to Almeida Carvalho for the support in gaining access to these rural communities, applying the questionnaire, and his endless patience during my time in country. I also would like to sincerely thank the community members of Ilheu, Plancas, Canavial, Guadalupe for their kindness and hospitality as they welcomed me into their community’s. Finally, thank you to Popuxo for his vigilance and protection during my nights in country.
vi
Contents
1. Introduction ... 1
1.1 Diseases of Poverty ... 1
1.2 Neglected Tropical Diseases ... 2
1.3 Impact of Neglected Tropical Diseases ... 3
1.4 NTD Treatment ... 5
1.5 WASH practices ... 5
1.6 São Tomé e Príncipe... 6
2. Objectives ... 9
3. Materials and Methods ...10
3.1 Target population and criteria ...12
3.2 Questionnaire and variables ...12
3.3 Statistical analysis ...15
3.4 Ethical aspects ...15
4. Results ...17
4.1 Sociodemographic variables by community ...17
4.2 Results by at least one reported health problem in the past month ...35
4.3 Binary logistic regression model ...45
4.4 Log Linear analysis ...51
5. Discussion ...53
5.1 Discussion of community differences ...54
5.1.1 Sociodemographic variables ...54
5.1.2. Household and community infrastructure ...55
5.1.3 WASH behaviors of respondents ...57
5.1.4 Health indicators by community ...59
5.2 Discussion of health outcome by other variables ...61
5.3 Discussion of Logistic Regression Model ...63
5.4 Influencing factors...66
5.5 Discussing results in terms of objectives ...67
6. Study limitations ...69
7. Conclusions ...70
1
1. Introduction
1.1 Diseases of Poverty
Diseases of poverty is a broad categorization of diseases that in general have a higher prevalence among low income populations. For most diseases of poverty, poverty is not only a large risk factor for disease, but is also a consequence of long-term infection (Singh and Singh 2008). The complex interplay between health and poverty underscores the importance of understanding the impact of poverty on an individual’s health, as well as the influence of poor health on future economic prospects. Poverty is one of the largest risk factors for acquiring diseases, and ultimately for an early death (Alsan et al. 2011). There exists a clear relationship between poverty and shorter life expectancy, wherein countries with lower gross domestic product (GDP) have higher rates of infectious diseases and shorter life expectancy, especially when compared to countries with higher GDP (Alsan et al. 2011). This interplay can have far reaching effects, impacting the lives of many over generations. In Development as Freedom, economist Amartya Sen illustrates the importance of a healthy and educated population for democracy. Thus social development is dependent on health, has an impact on economic development, the existence of poverty, and subsequently causes more health problems (Amartya Sen 1999).
This relationship is constantly being studied, and many groups actively work towards reducing these diseases of poverty (Wang et al. 2017). Yet within this broad category exists a smaller group of diseases that receive much less attention. These diseases are known as Neglected Tropical Diseases (NTDs), and they include a wide range of diseases that primarily exist in the tropical, underdeveloped regions of the world (Hotez and Kamath 2009). What sets these diseases apart from the other diseases of poverty is the notable lack of resources committed to research on them (Hotez 2013). While the three largest diseases of poverty: Tuberculosis, Malaria, HIV/AIDS, are responsible for 18% of the diseases in underdeveloped countries and receive significant global attention and research funding, the collective group of neglected tropical diseases are relatively ignored (Luchetti 2014; Kilama 2009).
2 According to Weng et al., from 2000 to 2010, only 66 novel drugs directed to treating NTDs entered phase I trials, just 1.65% of all phase I trials (Weng, Chen, and Wang 2018).
1.2 Neglected Tropical Diseases
The problem of the 10/90 gap and the lack of focus on NTDs is accentuated by scale of the problem: data accumulated by the World Health Organization suggests that over 1 billion people worldwide are infected with one or more NTDs, including nearly 200 Million children (Hotez et al. 2018; Rees et al. 2019).
These neglected tropical diseases have a wide variety of transmission pathways, including contact with exposed skin, through a vector, or through fecal-oral transmission(“Soil-Transmitted Helminth Infections” 2019) (Loukas et al. 2016). The most common NTDs include Schistosomiasis, Lymphatic filariasis, Trypanosomiasis, and Soil Transmitted Helminths (STH). The following includes a brief description of each:
• Schistosomiasis is a parasitic infection caused by flatworms known as blood flukes that infect nearly 250 million humans globally, primarily in poor agricultural and fishing communities (GBD 2015 Disease and Injury Incidence and Prevalence Collaborators 2016). Infection is caused by contact with contaminated fresh water, where the parasites enter the blood stream, mate, and begin producing eggs. The eggs are then excreted to the bladder or intestines, where they re-enter the environment to complete the lifecycle (“‘Parasites - Schistosomiasis, Disease’. Www.Cdc.Gov. Archived from the Original on 2 December 2016. Retrieved 4 December 2016.,” n.d.). Despite a nearly 24% decrease in prevalence from 2000 to 2015, nearly 700 million people still live in areas of elevated risk for Schistosomiasis, and it is considered one of the parasitic infections with the highest economic impact, second only to malaria. While the WHO maintains a 0.2% disability-adjusted life-year (DALY) weight, the more recent studies estimate the weight of Schistosoma infections at 2-15% (King, Dickman, and Tisch 2005).
3 • Lymphatic filariasis is an infection caused by filarial worms, transmitted by mosquitoes. With nearly 36 million people infected globally, and 950 million at risk, the diseases cause damage to the lymph nodes, kidneys, and alter the immune system. The disease formerly known as elephantiasis is attributed to these diseases (“Lymphatic Filariasis” 2019). The infection is also associated with increased burden and mental health strains on the part of the caregivers, linked with nearly 229,537 DALYs on the part of the caregivers (Ton, Mackenzie, and Molyneux 2015).
• Trypanosomiasis, commonly known as African Sleeping Sickness, is a parasitic disease transmitted by the tsetse fly (Büscher et al. 2017). While sustained control efforts have shown success in reducing the number of infected, the animal variant still has a large economic impact on the regions were it persists (Swallow 1999; “Trypanosomiasis, Human African (Sleeping Sickness)” 2019).
• Soil Transmitted Helminths is a term that encompasses various helminths that parasitize humans and contain a free-living stage. These include hookworms, ascariasis, and other roundworm parasites. Infection occurs through contact with contaminated soil, these diseases impact nearly 1.5 billion people globally, with cognitive and physical impairment a result of chronic infection (Loukas et al. 2016; Jourdan et al. 2018).
While the transmission, symptoms, and effects of these NTDs vary, the conditions in which these diseases thrive are similar. Poor housing conditions, inadequate sanitation, contaminated water, lack of education, poor nutrition, and a lack of access to health services are all strongly associated with the prevalence of NTDs. The co-endemicity of many of these parasites implies that polyparasitism is common, compounding the effects of sickness on the hosts (Hotez et al. 2018).
1.3 Impact of Neglected Tropical Diseases
While infection with any one of these diseases rarely is fatal (with the notable exception of trypanosomiasis), these diseases can have significant morbidities, especially when infection is chronic (Hotez 2008). Long term infection with Schistosomiasis increases the risk for bladder cancer, cancer of the gastrointestinal tract, renal failure, and in rare cases can
4 cross the blood brain barrier to infect the central nervous system (CNS). CNS infections lead to more frequent seizures and other cerebral infections (Ross et al. 2002). Infection with Schistosoma, soil transmitted helminths, and other NTDs can also cause anemia, stunting, and loss of appetite (Ross et al. 2002). Soil transmitted helminths can impair the nutritional status of individuals by robbing nutrients or feeding on host tissues (Loukas et al. 2016). Chronic intestinal blood loss due to STH infection worsens these effects and can also reduce physical and cognitive performance, primarily in adolescents. Studies have affirmed the association between NTD infections and poorer scores in memory, learning, reaction time and intelligence tests in school-aged children (Pabalan et al. 2018). In adults over many years, these effects contribute to a loss of economic productivity of infected individuals and play a role in the economic suppression of rural impoverished communities (Hotez 2009). For example, studies found that hookworm anemia causes on average a productivity loss of 6%, raising the economic burden of such diseases into the billions of dollars (Lenk et al. 2016). The impacts of the NTDs are compounded by coinfection between them and other diseases (such as malaria), resulting in more severe infections and worse health outcomes.
These economic effects, whether it be loss of productivity, loss of earning potential, slowed economic growth, or others can be profound, particularly on lower income populations. Studies have illustrated that with such macro-parasitic diseases, the parasite aggregates to a smaller subpopulation, meaning that a small group of hosts carry the vast majority of disease burden (Poulin 2013; Galvani 2003). The high disease burden, with its negative social, economic, and health effects, may lead to long term decline of whole communities. Already vulnerable populations begin to fall into a cycle of poverty, where their poverty is characterized by chronic infections of these diseases that harm their biological development, and the ensuing loss of productivity and economic capital ensures that infected individuals and their subsequent generations remain impoverished. Further studies have shown that infection with these diseases is enough to naturally form a poverty trap, where medium income communities can decline into poverty as a result of these infections (Garchitorena et al. 2017; Bonds et al. 2010).
5
1.4 NTD Treatment
While the long-term effects of these NTDs are well known, the silver lining is that treatments are generally affordable and easily accessible. To treat schistosomiasis, a single dose of Praziquantel administered by mouth can be given annually to reduce the chronic effects (Danso-Appiah et al. 2013). For soil-transmitted helminths, Albendazole and Mebendazole are inexpensive, effective, and easy to administer (Fitzpatrick et al. 2016). These drugs can also be used in combination with one another to improve effectiveness without increasing toxicity (Speich et al. 2015). The most common strategy involves yearly school based deworming programs (Mwinzi et al. 2012). To treat lymphatic filariasis, yearly deworming campaigns of Albendazole with Ivermectin prevent further spread of microfilaria until the adult worms die (“Lymphatic Filariasis” 2019). While these mass drug administration (MDA) campaigns have shown success in some communities, they still have significant limitations. Firstly, these school-based deworming programs have received criticism for not effectively targeting all stages of the infection (Anderson et al. 2013). Secondly, they fail to reach most at risk community members, such as farmers who work in irrigation schemes, pregnant women, and fishermen (Mwinzi et al. 2012). An intervention that is dependent on school attendance fails to recognize the economic reality of these communities, where often children are required to work and support their family. Furthermore, both schistosomiasis and the soil-transmitted helminths have a free-living larval stage in the environment. This infective stage means that reinfection can occur just days after a deworming campaign has taken place (Strunz et al. 2014).
1.5 WASH practices
With the limitations of MDAs known, the most promising paths to eliminating NTDs include a combination of these deworming campaigns along with work to reducing the conditions that promote transmission of NTDs. Improving water supply, sanitation and hygiene conditions, known collectively as WASH practices, has been a focus for the World Health Organization and a key part of the Millennial Development Goals (“About WASH”
6 2016). WASH practices include ensuring access to clean and safe drinking water, safe storage systems for water, proper improved sources to urinate and defecate, such that feces do not contaminate the water supply, and ensuring consistent hygiene practices such as handwashing (“About WASH” 2016). Targeting these conditions, a determinant of NTDs, helps contribute to the prevention and management of NTDs, promote economic growth, and reduce diarrheal diseases (another category of diseases of poverty) (Boisson et al. 2016; Woode et al. 2018). Furthermore, by eliminating the conditions in which these diseases thrive, the collective health expenditures related to treating these illnesses would be reduced, furthering the economic growth of these communities (Fitzpatrick et al. 2017).
In Ghana, WASH interventions, such as the Community-Led Total Sanitation (CLTS) and Hygiene Promotion Interventions (HPI) have been shown as cost-effective ways to improve hygiene behavior and therefore lower risk for NTDs (Boisson et al. 2016). The interventions focused on augmenting latrine use, handwashing with soap, and improved water management as improvements that cost as little as $183 per household ($37 per capita) (Woode et al. 2018). This type of intervention, paired with novel distribution strategy for MDAs such as the community directed interventions, shows great promise not only in reducing the NTD burden but also promoting development of these communities (Oswald et al. 2017).
1.6 São Tomé e Príncipe
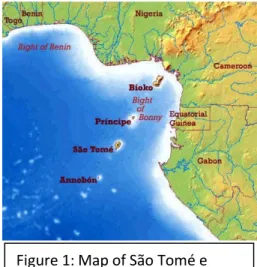
São Tomé e Príncipe is a small central African island nation situated in the Gulf of Guinea. Consisting of two islands and a population of just under 200,000, it is the second smallest nation in Africa (after Seychelles) (Cardoso 2016). Figure 1 illustrates the country’s location within central Africa and the Gulf of Guinea (“São Tomé e Principe - Geography” 2016). Until 1974 the country was a Portuguese colony built around plantations, known as roças. These privately owned roças were the center of life on the colony, with
Figure 1: Map of São Tomé e Príncipe in the Gulf of Guinea
7 each one having its own school, health center, infrastructure(Pape 2016). Following independence, much of the infrastructure of the roças, including the health system, collapsed and were followed by years of poor conditions. In 2002, the WHO noted São Tomé e Príncipe as one of the countries with the worst rates of iron deficiency anemia (“Sao Tome and Principe” 2015a) (“GHO | By Country | Sao Tome and Principe - Statistics Summary (2002 - Present)” 2019). Currently, the country continues to face elevated levels of schistosomiasis, giardiasis, lymphatic filariasis, and various soil transmitted helminths (“GHO | By Country | Sao Tome and Principe - Statistics Summary (2002 - Present)” 2019). Furthermore, recent epidemiological reported to the WHO suggests there has been a resurgence of malaria in recent years, both on the island of São Tomé and on Príncipe(Global Malaria Programme and World Health Organization 2010).
Increased aid and investment in health and nutrition has helped improve the health indicators of the nation, with the prevalence of malnutrition in children under 5 years old dropping steadily since 2008, from over 30% to nearly 16% in 2014 (“Prevalence of Underweight, Weight for Age (% of Children under 5) | Data” n.d.). These and other health indicators, when considered with economic growth and improving education rates, has led the United Nation committee for development policy to recommend the country graduate from its category of a least developed country (“Making Progress on Sustainable Development, Four Least Developed Countries Tapped to Graduate from Ranks of Poorest” 2018).
Yet despite these improvements, a recent outbreak of Necrotizing Cellulite in the country, which has infected nearly 2,000 individuals, has called into question the countries sanitation system(“Weekly Bulletin on Outbreaks and Other Emergencies” 2018). A case-control study being conducted in the country has identified poor hygiene and water use as a significant problem for many interviewed individuals (Gonçalves 2017). This suggests that despite improvements, behaviors and practices- with regards to hygiene and sanitation practices- are not improving to sufficiently eliminate the risk for many of these NTDs. Furthermore, the high proportion of cases occurring in rural communities may suggest a possible uneven
8 distribution of improvements across the country, condemning rural communities to continue in poorer conditions.
9
2. Objectives
The aim of the study was to characterize and compare the rural communities of São Tomé e Príncipe, with respect to the hygiene, sanitation infrastructure, WASH practices, and health indicators of the adult community members, as well as to identify areas of greatest need for improvement. In comparing communities of different levels of development, we aim to determine if the existing infrastructure was associated with different hygiene related behaviors of the community members, and to identify the relationship between any behaviors and health problems. The specific objectives were as follows:
1. To characterize the Hygiene and Sanitation (WASH) behavior of the members of each community.
2. To characterize the hygiene, sanitation, and other related infrastructure in each community, both at the community and household level.
3. To explore difference in WASH behaviors in function of community and household improvements, as well as other influencing factors.
4. To compare the health status of the members of each community, particularly with regards to hygiene and water sanitation related illnesses.
5. To evaluate the association of WASH practices and household or community infrastructure on the studied health indicators.
It was hypothesized that if existing sanitation improvements were being appropriately utilized, there would be both a significant difference in the WASH behavior of the community members, as well as a positive difference in some parasitosis associated health indicators, and other diseases of poverty. We further hypothesized that factors such as positive community association and cohesion, as well as distance to certain infrastructures, would be positively associated with improved WASH behaviors.
10
3. Materials and Methods
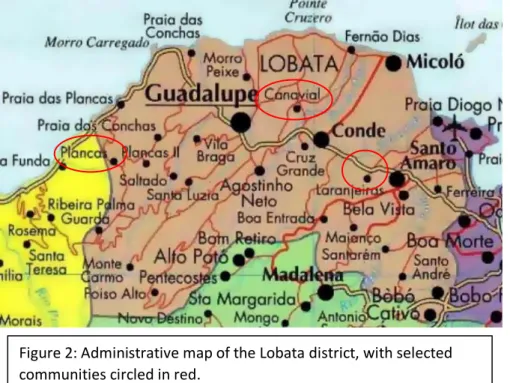
The designed study was an analytical transversal study of three rural communities on the island of São Tomé, in the Lobata district. The study included both quantitative and qualitative elements and involved the application of a questionnaire to individuals in each community, as well as documentation and photographing of each community. The communities were selected based on size, presence of infrastructure, and distance from the main highway. Figure 2 illustrates a map of the Lobata district, with red circles around each selected community (“Political and Administrative Map of Sao Tome and Principe” 2019). Note that Ilheu is not labeled, it exists West of Santo Amaro at the circled crossroads. Below is a short description of each community:
Canavial: A former roça (plantation) located 5-10 minutes by motorcycle from the principle
highway. According to the National Census in 2012, there were 407 people living in 104 houses in the community (Cardoso 2016). Upon visiting the community and speaking with the local community health agent as well as the community president, it was estimated that
Figure 2: Administrative map of the Lobata district, with selected communities circled in red.
11 the current population is closer to 360 people, with an approximately 100 houses. Of the 100 houses, the president reported approximately 80 of them were currently occupied. The village has access to a public latrine, public clothes washing station, and has one fountain connected to the public water system that services the community. In addition to this infrastructure, there is a stream along the side of the village, and a small river 10 minutes walking from the center. There is also one small convenience store that sells bottled water.
Plancas: Formally known as Plancas 1 (Plancas Primeira), the community is located nearly
15 minutes by motorcycle from the principle highway, inland and towards the top of the island’s mountainous center. Plancas is a former roça in the interior of the district. The census data reported 182 residents and 52
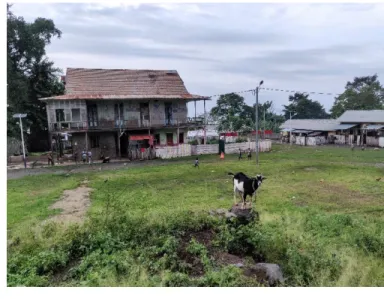
houses, upon speaking with the community leaders, the current estimated population is closer to 450 residents, with 95 houses, of which 70 are occupied. The community has access to public latrines, clothes washing stations, and three public fountains that service the community with treated spring water. Figure 3 is a photo taken in Plancas of the old “casa do patrão”, where the ground
floor is occupied by homes and an unfinished kindergarten. Beyond this infrastructure, there are no other natural sources of water. The nearest source of water is a river off the main highway. The community has 1 convenience stores and 2 bars throughout the community, all of which sell bottled water.
Ilheu: Ilheu is located along the major highways connecting the regional capital of
Guadalupe with the city of São Tomé. It is a newer community that began to grow in the 1970’s following the island’s independence. Census data reports 372 residents with 94 houses and community members suggests a current population of 400, with 100 houses, of which
Figure 3: the community of Plancas, as seen from the old hospital.
12 approximately 85 are occupied. The community has access to a public washing station, and four fountains that service the community with treated water. There are numerous convenience stores, bars, and restaurants in the community that sell bottled water. There are two rivers flowing around the community, and a third further down the principle highway.
3.1 Target population and criteria
The determined target population was adults aged 18 and above, who had been living in the community for at least one month. The exclusion criteria were as follows: adults who spend more than half their time living in a different community, and participants who had lived in the community for less than one month. The homes in the communities were divided into sections of 15-20 homes, to be surveyed on certain days. The objective was to randomly select one individual who fulfilled the criteria from each home and have them to respond to the questionnaire. Randomization of eligible members of the household was done using the Random UX application: each eligible person was assigned a number, and once a number was randomly selected, the selected person would be asked to participate. If the selected participant was not present or unavailable, another time was be scheduled to return to the home and interview the applicant. Only after three attempts to interview was a different individual in the household chosen. This ensured a random or at least nearly random sample in each community.
3.2 Questionnaire and variables
The questionnaire contained between 70 to 100 questions, depending on how the participants responded, and took approximately 20 minutes to conduct. As an initial step, the questionnaire was informally tested on collaborators from São Tomé for language, vocabulary, and understanding. Upon arriving in São Tomé, the questionnaire was further pre-tested on locals from a nearby village (Morro Peixe), for both language, vocabulary, and relevance. Certain changes were then made to adapt the questionnaire to the local context and to facilitate understanding.
13 In its final form, the questionnaire contained 5 subsections: socio-demographic, health outcomes, community association, characterization and perception of infrastructure, and behavior. The variables of interest for each subsection were as follows:
Socio-demographic variables: 1. Gender 2. Age 3. Education level 4. Profession 5. Civil Status 6. Family size
7. Number of children in household Health outcomes variable:
1. Use of anti-parasitic drugs 2. Episodes of diarrhea 3. Episodes of fever
4. Unexpected visits to the clinic 5. Injuries sustained
6. Weight change 7. Diet change
8. Stomach pain and bloating 9. Hematuria
10. Blood in stool Community association variables:
1. Community leader approval and election frequency 2. Community events
3. Community cleaning 4. Community meetings
14 6. Community support
7. Community rules Infrastructure variables:
1. Perception and distance of public water system 2. Perception and distance of public latrine
3. Perception and distance of public washing station 4. Organized garbage collection
5. Private latrine 6. Private water storage 7. Other improvements Behavior and practices
1. Primary source of drinking water
2. Primary source of water for other purposes 3. Preparing food before consuming
4. Treating water before consuming 5. Reutilization of washbasin water 6. Handwashing
7. Walking barefoot
8. Primary location of clothes washing 9. Garbage disposal location and treatment 10. Defecating in latrine, open air
11. Urinating in latrine, open air
The questionnaire was digitized and applied using Qualtrics survey software, on two Amazon Kindle Fire Tablets, via a trained local research assistant in Portuguese and crioulo (a local Portuguese-based creole language). Annex A contains a copy of the questionnaire in its entirety.
15
3.3 Statistical analysis
The responses, once collected, were then formatted and analyzed using SPSS version 25. An initial exploratory analysis was performed to each variable. For quantitative symmetric variables, mean and standard deviation were obtained. Instead, for asymmetric variables, median and interquartile range were calculated. Qualitative variables were summarized through absolute and relative frequencies. One-way analysis of variance (abbreviated one-way ANOVA) was used to compare means of the three communities, in case of the quantitative variable meet the assumptions (normality - tested by Kolmogorov-Smirnov and Shapiro-Wilk tests - and homogeneity of variances - tested by Levene test). As an alternative, the non-parametric test of Kruskal-Wallis was used.
Based on expected frequencies, Chi Squared or and Fisher Exact tests were used to compare different proportions or test associations variables between qualitative variables (e.g., three communities and each by health outcome). Statistically significant variables with p<0.05 or relevant variables in epidemiological terms (e.g., sex and age) were then included in a multiple binary logistic regression models, to evaluate the significance of the association between these variables and reported health problems, while controlling for other variables. Hosmer and Lemeshow test was used to assess the goodness of fit of models (p>0.05), and the Nagelkerke R squared value was used to show the capability of the variables to explain the health outcomes (a larger value corresponds to the variables more accurately explaining the results). Thus, adjusted odds ratio values and their correspondent 95% confidence interval (95%CI) were obtained. The models were also split by gender and run to explore the different risk factors associated with each gender. Furthermore, Log-linear models were used to examine the relationship between these significantly associated qualitative variables and several selected factors to explore their potential association simultaneously in three-way or higher contingency tables.
16 The study was reviewed and approved by the São Tomé e Príncipe ministry of health, as well as the national ethics committee, on 02/21/2019 – Ref: no149 Proc no.38/GMS/19. The information regarding this study, and the conditions to participate were given verbally. Written informed consent documents with two copies were obtained from each participant. One copy was left to the participant, which included pertinent contact information of the researchers, and the second was held by the researcher. Annex B contains an example form of the Informed consent used. All copies of the obtained informed consent will be held in storage for a period of five years at the Institute of Hygiene and Tropical Medicine. There is no conflict of interest to declare.
17
4. Results
The questionnaire was applied in the communities between February 28, 2019 and April 1, 2019. A total of 162 individuals were interviewed across the 3 communities; 56 from Canavial, 49 from Plancas, and 57 from Ilheu. These numbers equate to nearly 70% of the reported occupied homes in each community, and approximately 29% of the total estimated population of the three communities. In four instances we were unable to reach the randomly selected participants, two in Ilheu, one in Plancas, and one Canavial, and after the third attempt another member of the household was chosen. The minimum and maximum age of respondents was 18 and 85, respectively, with a mean of 40.1 years old (s= 16.1). A total of 71 males and 91 females were interviewed, 43.8% and 56.2% respectively.
4.1 Sociodemographic variables by community
Table 1 describes the sociodemographic breakdown of the sample by community. There were slightly more female than male respondents across all three communities, without significant differences (56.2%, p=0.297). In Plancas, more respondents (53.1%) were male. The 25 to 34-year-old age group was the most common across Canavial and Plancas, while the 35 to 44-year-old age group was most represented in Ilheu (p=0.377). Most respondents (54.0%) reported their civil status as single, followed by those who are married or in a domestic union (42.2%) (p=0.265). The mean and median age of respondents in Canavial was 39.1 and 37 years, respectively. In Plancas, the mean and median age was 41.8 and 40 years, and in Ilheu it was 39.7 and 36 years, respectively. Despite the large number of reported single individuals, most respondents across all communities reported living with at least one other person (84.6%, p=0.450), and with at least one child in the home (71.4%, p=0.498).
The respondents from the community of Ilheu reported the highest levels of education, with 15.8% studying above a secondary education, and with 56.1% of respondents studying through secondary education. These values are higher than the education levels of Canavial and Plancas, with reported levels of higher education to be 7.1% and 0.0% respectively and reported levels of secondary education at 41.1% and 32.7% respectively
18 (p=0.001). With regards to profession, respondents from Ilheu reported highest levels of employment in the tertiary sector (21.4%), followed by the secondary sector (17.9%). In comparison, most respondents in Plancas and Canavial work in the primary (agricultural) sector, 77.6% and 56.4% respectively (p<0.001). Interestingly, Ilheu also reported the highest percentage of unemployed respondents of the three communities, with 12.5%, compared with 0.0% in Plancas and 5.5% in Canavial.
With regards to existing community wide infrastructure, all three communities (Canavial, Plancas, Ilheu) had access to a public water system and public clothes washing tanks. For the purpose of this comparison, the source of the water (spring water in Plancas and treated water in Canavial and Ilheu) will be regarded as the same. Furthermore, both Canavial and Plancas have public latrines installed for all at use.
At the household level, information was gathered on five household variables: existence of a bathroom, a latrine, indoor plumbing, type of flooring, and water storage. Table 2 illustrates the presence of each improvement divided by community. Across all communities, bathrooms with indoor plumbing were rare. Only, 8.9% of homes in Canavial and 14% of homes in Ilheu had access to such a bathroom, with no reported bathrooms in Plancas. Overall, only 8% of homes had a bathroom with internal plumbing (p=0.015). With regards to outdoor latrines, the prevalence varied significantly, with 7.1% of homes in Canavial, 22.5% in Plancas, and 40.4% of homes in Ilheu had access to outdoor latrines (p<0.001). When considering bathrooms and latrines together, 31.5% of respondents had access to a private location defecate or urinate.
Table 1. Sociodemographic results by community Canavial n=56 (%) Plancas n=49 (%) Ilheu n=57 (%) Total n=162 (%) P-value Gender 0.297 Male 23 (41.1) 26 (53.1) 22 (38.6) 71 (43.8) Female 33 (58.9) 23 (46.9) 35 (61.4) 91 (56.2) Civil Status 0.265
19 married/domestic union 21 (37.5) 20 (40.8) 27 (48.2) 68
(42.2)
Single 34 (60.7) 25 (51.0) 28 (50.0) 87
(54.0) other (divorced, widowed) 1 (1.8) 4 (8.2) 1 (1.8) 6 (3.7)
Age group 0.377 18-24 7 (12.5) 4 (8.2) 10 (17.9) 21 (13.0) 25-34 19 (33.9) 16 (32.7) 15 (26.8) 50 (31.1) 35-44 13 (23.2) 10 (20.4) 16 (28.6) 39 (24.2) 45-54 11 (19.6) 10 (20.4) 4 (7.1) 25 (15.5) 55+ 6 (10.7) 9 (18.4) 11 (19.6) 26 (16.1) Household size 0.450* 1 person 6 (10.7) 10 (20.4) 9 (15.8) 25 (15.4) 2-4 people 23 (41.1) 20 (40.8) 26 (45.6) 69 (42.6) 5-7 people 20 (35.7) 18 (36.7) 18 (31.6) 56 (34.6) 8+ people 7 (12.5) 1 (2.0) 4 (7.0) 12 (7.4) Children in home 0.498* 0 kids in house 11 (19.6) 18 (36.7) 17 (30.4) 46 (28.6) 1-2 kids in house 23 (41.1) 18 (36.7) 22 (39.3) 63 (39.1) 3-5 kids in house 21 (37.5) 13 (26.5) 16 (28.6) 50 (31.1) 6+ kids in house 1 (1.8) 0 (0.0) 1 (1.8) 2 (1.2) Education level 0.001* no education 6 (10.7) 7 (14.3) 4 (7.0) 17 (10.5) primary 23 (41.1) 26 (53.1) 12 (21.1) 61 (37.7) secondary 23 (41.1) 16 (32.7) 32 (56.1) 71 (43.8) superior and above 4 (7.1) 0 (0.0) 9 (15.8) 13 (8.0)
Profession <0.001*
Primary sector (Agriculture) 31 (56.4) 38 (77.6) 7 (12.5) 76 (47.5) Secondary sector 4 (7.3) 2 (4.1) 10 (17.9) 16 (10)
20 Tertiary sector 5 (9.1) 1 (2.0) 12 (21.4) 18 (11.3) domestic 12 (21.8) 8 (16.3) 20 (35.7) 40 (25.0) unemployed 3 (5.5) 0 (0.0) 7 (12.5) 10 (6.3) *Fisher Exact Test
Table 2 also describes other characteristics of the household, such as the existence of internal plumbing, the type of flooring, and type of water storage. Internal plumbing was rare and limited to a few newly built homes. Only, 5.4% of homes in Canavial reported internal plumbing, compared to no homes in Plancas and 19.3% of homes in Ilheu (p=0.001). Types of flooring were dividing into three categories: wood, cement, and other. In Canavial, the primary floor type was cement (83.9%), followed by wood (14.3%). In Plancas, cement was most common with 62.5%, followed by 35.4% of homes with wood floors. Lastly, Ilheu had primarily wood flooring (75.4%), followed by cement (21%). These difference in floor type (p<0.001) illustrate the historic and social context of each community. Nearly all homes surveyed across all communities had some form of water storage (97.5%, p=0.842). The types of water storage present in each household are divided into three categories: drums – large (50-100L) barrels closed with a lid, small (1.5-5L) containers with lids, and open bucket containers. Water drums were rare in Canavial and Plancas, reported in only 1.8% and 2.0% of homes, and more common in Ilheu, reported in 15.8% of homes (p=0.004). Containers with closable lids were found in 30.4% of homes in Canavial, 51% of homes in Plancas, and 63.2% of homes in Ilheu (p=0.002). Open containers (such as buckets), were ubiquitous through all communities, present in 96.4%, 95.9%, and 98.2% of homes in Canavial, Plancas, and Ilheu respectively (p=0.742).
Table 2. Household infrastructure and water storage by community Canavial n=56 (%) Plancas n=49 (%) Ilheu n=57 (%) Total n=162 (%) p-value Access to a bathroom 0.015* no 51 (91.1) 49 (100) 49 (86.0) 149 (92.0) yes 5 (8.9) 0 (0.0) 8 (14.0) 13 (8.0) Access to a latrine <0.001 no 52 (92.9) 38 (77.6) 34 (59.7) 124 (76.5)
21
yes 4 (7.1) 11 (22.4) 23 (40.4) 38 (23.5)
Water pipes in house 0.001*
no 53 (94.6) 49 (100) 46 (80.7) 148 (91.4) yes 3 (5.4) 0 (0.0) 11 (19.3) 14 (8.6) Home flooring <0.001* Wood 8 (14.3) 17 (35.4) 43 (75.4) 68 (42.2) Cement 47 (83.9) 30 (62.5) 12 (21.1) 89 (55.3) other 1 (1.8) 1 (2.1) 2 (3.5) 4 (2.5) Water storage 0.842* no 2 (3.6) 1 (2.0) 1 (1.8) 4 (2.5) yes 54 (96.4) 48 (98.0) 56 (98.2) 158 (97.5) Water drum 0.004* no 55 (98.2) 48 (98) 48 (84.2) 151 (93.2) yes 1 (1.8) 1 (2) 9 (15.8) 11 (6.8) Closable container 0.002 no 39 (69.6) 24 (49) 21 (36.8) 84 (51.9) yes 17 (30.4) 25 (51) 36 (63.2) 78 (48.1)
Open water containers 0.742*
no 2 (3.6) 2 (4.1) 1 (1.8) 5 (3.1)
yes 54 (96.4) 47 (95.9) 56 (98.2) 157 (96.9) *Fisher exact test
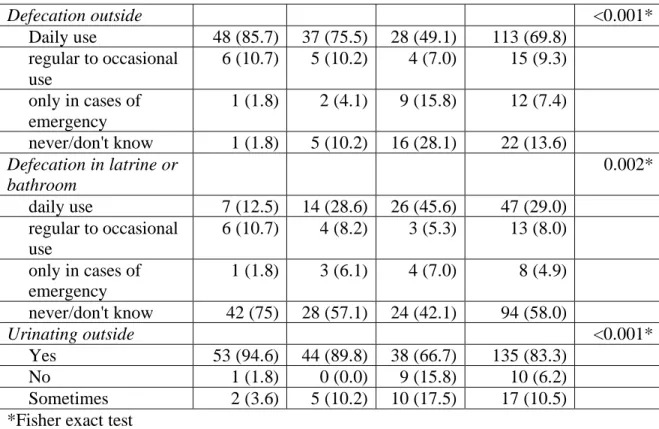
With regards to how the infrastructure is utilized, the results may be divided into two groups: general hygiene behavior, and water usage. Table 3 depicts the defecation and urination habits of participants by community. Rates of daily outdoor defecation rates were elevated in both Canavial (85.7%) and Plancas (75.5%), with only Ilheu reporting daily outdoor defecation of less than 50% of the participants in the community (49.1%, p<0.001). Accordingly, Ilheu reported the highest levels of daily latrine use (45.6%), followed by Plancas (28.6%) and Canavial (12.5% p=0.002). Cumulatively, over half (58.0%) of the respondents reported never using an improved latrine in their day to day life. Urinating outside was also a pervasive behavior, done regularly by 94.5% of respondents from Canavial, 89.9% from Plancas, and 66.7% from Ilheu (p<0.001). These values correspond to the number of private latrines in each community.
Table 3. Defecation and urination habits by community Canavial n=56 (%) Plancas n=49 (%) Ilheu n=57 (%) Total n=162 (%) P-value
22 Defecation outside <0.001* Daily use 48 (85.7) 37 (75.5) 28 (49.1) 113 (69.8) regular to occasional use 6 (10.7) 5 (10.2) 4 (7.0) 15 (9.3) only in cases of emergency 1 (1.8) 2 (4.1) 9 (15.8) 12 (7.4) never/don't know 1 (1.8) 5 (10.2) 16 (28.1) 22 (13.6) Defecation in latrine or bathroom 0.002* daily use 7 (12.5) 14 (28.6) 26 (45.6) 47 (29.0) regular to occasional use 6 (10.7) 4 (8.2) 3 (5.3) 13 (8.0) only in cases of emergency 1 (1.8) 3 (6.1) 4 (7.0) 8 (4.9) never/don't know 42 (75) 28 (57.1) 24 (42.1) 94 (58.0) Urinating outside <0.001* Yes 53 (94.6) 44 (89.8) 38 (66.7) 135 (83.3) No 1 (1.8) 0 (0.0) 9 (15.8) 10 (6.2) Sometimes 2 (3.6) 5 (10.2) 10 (17.5) 17 (10.5) *Fisher exact test
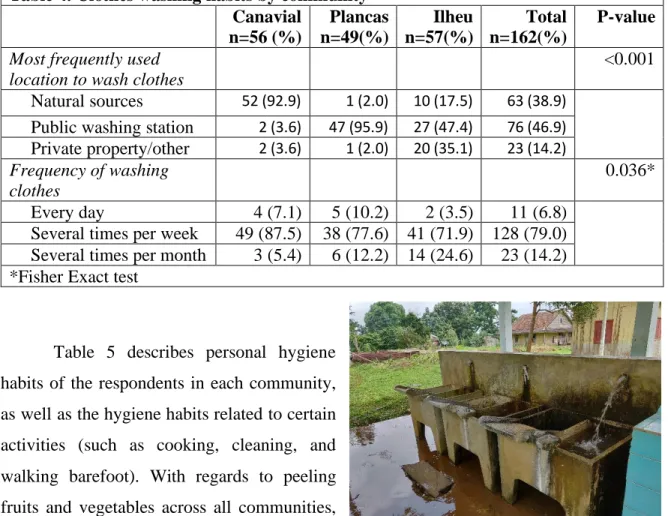
Table 4 outlines clothes washing habits. With regards to clothes washing, the primary location varied significantly (p<0.001) between the communities. In Canavial, the vast majority (92.9%) of respondents named the nearby natural source of water as the primary source, with very few using the public washing station (3.6%) or their own property (3.6%). In Plancas, the nearly all members of the community washed their clothes in the public washing station (95.9%), with only 2% using either a nearby river or their property. Finally, Ilheu’s usage was distributed across all three options, with most using the public washing station (47.4%), followed by their own property (26.3%) and a nearby river (17.5%). Figure 4 illustrates an example of these public washing stations. We also found that clothes washing frequency varied by community (p=0.036). In Canavial, 87.5% of respondents washed clothes several times per week, followed by 7.1% who responded doing so daily. In Plancas, 77.6% of respondents washed clothes weekly, followed by 12.2% who washed monthly and 10.2% who washed clothes daily. In Ilheu, 71.9% washed clothes weekly, 24.6% monthly and 3.5% washed daily.
23
Table 4. Clothes washing habits by community Canavial n=56 (%) Plancas n=49(%) Ilheu n=57(%) Total n=162(%) P-value
Most frequently used location to wash clothes
<0.001 Natural sources 52 (92.9) 1 (2.0) 10 (17.5) 63 (38.9)
Public washing station 2 (3.6) 47 (95.9) 27 (47.4) 76 (46.9) Private property/other 2 (3.6) 1 (2.0) 20 (35.1) 23 (14.2) Frequency of washing
clothes
0.036* Every day 4 (7.1) 5 (10.2) 2 (3.5) 11 (6.8)
Several times per week 49 (87.5) 38 (77.6) 41 (71.9) 128 (79.0) Several times per month 3 (5.4) 6 (12.2) 14 (24.6) 23 (14.2) *Fisher Exact test
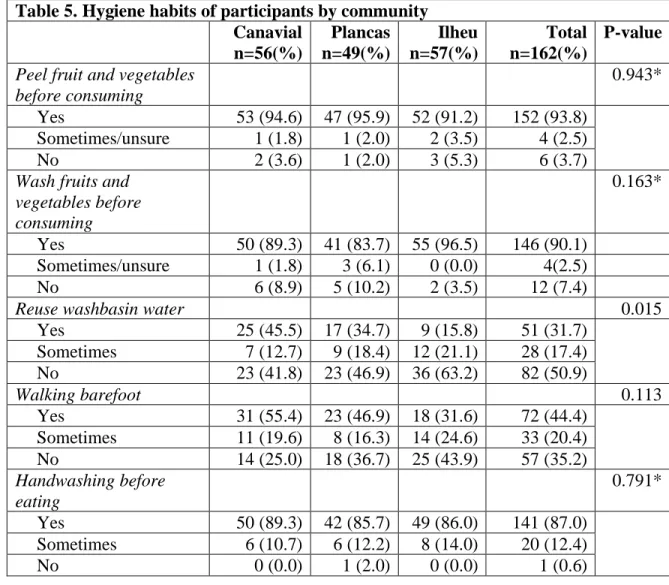
Table 5 describes personal hygiene habits of the respondents in each community, as well as the hygiene habits related to certain activities (such as cooking, cleaning, and walking barefoot). With regards to peeling fruits and vegetables across all communities, 93.8% reported do so regularly, 2.5% reported sometimes doing so, and only 3.7% reported not regularly peeling fruit and vegetables
(p=0.943). With washing fruits and vegetables before consuming, there was no significant difference between communities (p=0.163), while 90.1% of respondents reported regularly washing their fruits and vegetables, followed by 2.5% who sometimes washed or were unsure, and another 7.4% reported not washing their fruit and vegetables before consuming. We found that the reutilization of washbasin water varied significantly between communities (p=0.015). In Canavial, 45.5% of the respondents reported regularly reusing washbasin water, 12.7% sometimes did, and 50.9% reported never doing so. In Plancas, 34.7% regularly reused water, 18.4% reported sometimes doing so, and 46.9% reported never reusing washbasin water. Ilheu reported the least amount of reuse of washbasin water, 15.8% reported
Figure 4: Public washing station used to clean clothes.
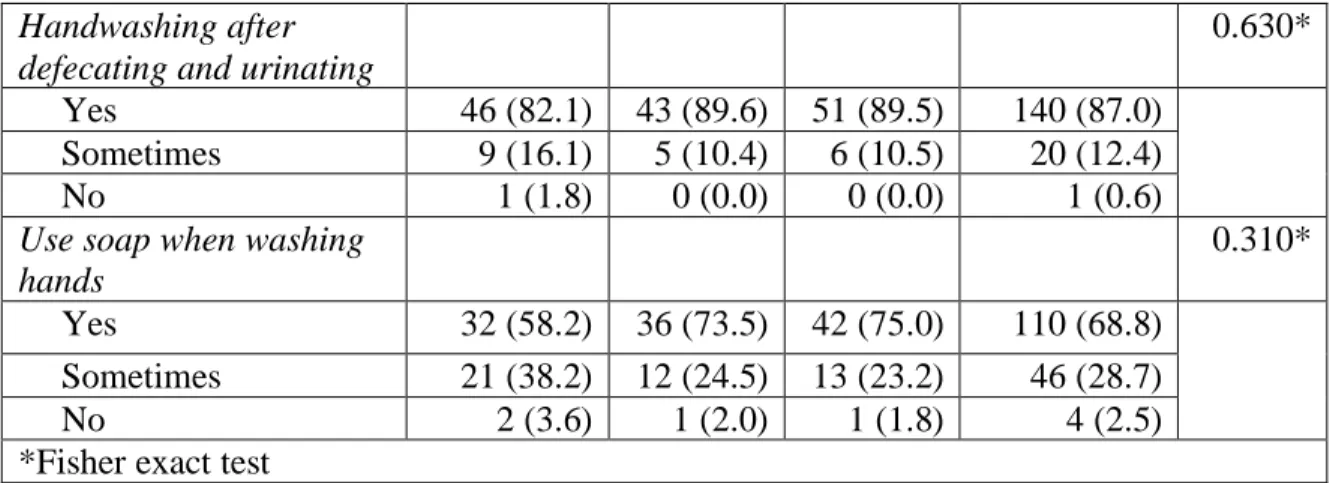
24 regularly doing so, followed by 21.1% doing so occasionally, and 63.2% never doing so. Over half of respondents in Canavial (55.4%) reported walking barefoot outside their home, more than those in Plancas (46.9%) and in Ilheu (31.6%) while there is a decreasing trend across communities, it was not statistically significant (p=0.113). Most respondents reported washing their hands before eating (87.0%, p=0.791) and after defecating (82.1%, p=0.630. While more variation was found in the use of soap with handwashing, results were still not statistically significant (p=0.310). In Canavial, 58.2% used soap, while 41.8% only sometimes or never used soap. In Plancas, 73.5% used compared to 26.5% who only sometimes or never used soap. Lastly, three quarters of participants in Ilheu reported using soap, and 25.0% sometimes or never did.
Table 5. Hygiene habits of participants by community Canavial n=56(%) Plancas n=49(%) Ilheu n=57(%) Total n=162(%) P-value
Peel fruit and vegetables before consuming
0.943* Yes 53 (94.6) 47 (95.9) 52 (91.2) 152 (93.8)
Sometimes/unsure 1 (1.8) 1 (2.0) 2 (3.5) 4 (2.5)
No 2 (3.6) 1 (2.0) 3 (5.3) 6 (3.7)
Wash fruits and vegetables before consuming 0.163* Yes 50 (89.3) 41 (83.7) 55 (96.5) 146 (90.1) Sometimes/unsure 1 (1.8) 3 (6.1) 0 (0.0) 4(2.5) No 6 (8.9) 5 (10.2) 2 (3.5) 12 (7.4)
Reuse washbasin water 0.015
Yes 25 (45.5) 17 (34.7) 9 (15.8) 51 (31.7) Sometimes 7 (12.7) 9 (18.4) 12 (21.1) 28 (17.4) No 23 (41.8) 23 (46.9) 36 (63.2) 82 (50.9) Walking barefoot 0.113 Yes 31 (55.4) 23 (46.9) 18 (31.6) 72 (44.4) Sometimes 11 (19.6) 8 (16.3) 14 (24.6) 33 (20.4) No 14 (25.0) 18 (36.7) 25 (43.9) 57 (35.2) Handwashing before eating 0.791* Yes 50 (89.3) 42 (85.7) 49 (86.0) 141 (87.0) Sometimes 6 (10.7) 6 (12.2) 8 (14.0) 20 (12.4) No 0 (0.0) 1 (2.0) 0 (0.0) 1 (0.6)
25 Handwashing after
defecating and urinating
0.630* Yes 46 (82.1) 43 (89.6) 51 (89.5) 140 (87.0)
Sometimes 9 (16.1) 5 (10.4) 6 (10.5) 20 (12.4)
No 1 (1.8) 0 (0.0) 0 (0.0) 1 (0.6)
Use soap when washing hands
0.310* Yes 32 (58.2) 36 (73.5) 42 (75.0) 110 (68.8)
Sometimes 21 (38.2) 12 (24.5) 13 (23.2) 46 (28.7)
No 2 (3.6) 1 (2.0) 1 (1.8) 4 (2.5)
*Fisher exact test
Table 6 shows the water utilization for different purposes by community. With regards to using the public system for drinking water, respondents from Ilheu and Plancas both reported it being their sole source of drinking water, with almost 98.0% of each community reported it being their daily source of water. While most respondents in Canavial (82.1%) reported using the public system for drinking water daily, a significant number (17.9%) reported using only on a regular to occasional basis (p<0.001). Conversely, the use of natural sources (rivers, streams, valleys) for drinking water was most pronounced in Canavial, with 69.6% of respondents reporting regular to occasional use. Most participants in Plancas (98.0%) reported never using river water, and 73.7% of respondents from Ilheu reported drinking water from the river only in cases of emergency, and a minority (21%) using it regularly to occasionally (p<0.001).
For using the public water system for other uses, such as cooking and cleaning, most respondents from both Plancas (95.5%) and Ilheu (93.0%) reported using it daily. In Canavial, only 57.1% of respondents reported using public water supply for other purposes daily. 35.7% only used it on a regular to occasional basis. For using water from natural sources to cook and clean, 23.2% of respondents from Canavial reported using water from the river daily, and 58.9% reported regular to occasional use. In Plancas, most respondents (98.0%) reported never using water from natural sources for other purposes. Finally, in Ilheu, while a plurality (47.4%) reported never using it cook and clean, one-third (33.3%) reported using it in cases of emergency, and another 19.3% using it on a regular to occasional basis.
26
Table 6. Water usage by community Canavial n=56(%) Plancas n=49(%) Ilheu n=57 (%) Total n=162 (%) P-value
With what frequency do you use public system for drinking water
<0.001*
daily use 46 (82.1) 48 (98.0) 56
(98.3)
150 (92.6) regular to occasional use 10 (17.9) 0 (0.0) 1 (1.8) 11 (6.8) Only in cases of emergency 0 (0.0) 0 (0.0) 0 (0.0) 0 (0.0) never/don't know 0 (0.0) 1 (2.0) 0 (0.0) 1 (0.6) With what frequency do you use
natural sources (river, streams) for drinking water
<0.001*
daily use 3 (5.4) 1 (2.0) 0 (0.0) 4 (2.5)
Regular to occasional use 39 (69.6) 0 (0.0) 12 (21.1)
51 (31.5) Only in cases of emergency 12 (21.4) 0 (0.0) 42
(73.7)
54 (33.3) never/don't know 2 (3.6) 48 (98.0) 3 (5.3) 53 (32.7) With what frequency do you use
treated water for other uses (cooking, cleaning) <0.001* daily use 32 (57.1) 47 (95.9) 53 (93.0) 132 (81.5) regular to occasional use 20 (35.7) 1 (2.0) 3 (5.3) 24 (14.8) Only in cases of emergency 0 (0.0) 0 (0.0) 0 (0.0) 0 (0.0) never/don't know 4 (7.1) 1 (2.0) 1 (1.8) 6 (3.7) With what frequency do you use
natural sources (river, streams) for other uses (cooking,
cleaning)
<0.001*
Daily use 13 (23.2) 1 (2.0) 0 (0.0) 14 (8.6) regular to occasional use 33 (58.9) 0 (0.0) 11
(19.3)
44 (27.2) Only in cases of emergency 5 (8.9) 0 (0.0) 19
(33.3) 24 (14.8) never/don't know 5 (8.9) 48 (98.0) 27 (47.4) 80 (49.4) *Fisher exact test
27 Other factors explored were variables that may influence or relate to the usage of the public infrastructure. These included factors such as perception of quality of the public infrastructure, distance from the respondent’s home to the facilities, and factors related to community association. Table 7 describes the respondent’s perception of this infrastructure by community. In Ilheu, 86.0% of respondents viewed the public water system as positive, while only 7% viewed the system negatively. In contrast, just 44.6% of respondents in Canavial held a positive view of the water system, while 41.1% held a negative perception and 14.3% thought the system adequate. In Plancas, 46.8% held a positive perception, 36.2% thought the system was adequate, and 17% held a negative perception. These differences were found to be statistically significant (p<0.001). In Canavial, 41.1% of respondents reported holding a negative view of the clothes washing tanks, followed by 29.1% of respondents holding a positive view, and 27.3% reporting the tanks were adequate. Similarly, in Plancas, 44.7% held a negative perception of the tanks, 38.3% thought them adequate, and only 17% held a positive view. Conversely, 49.1% of respondents in Ilheu viewed the washing tanks positively, followed by 26.3% who viewed them as adequate, and only 24.6% with negative views of the tanks (p=0.008). With regards to the public latrines in Canavial and Plancas, public perception was decidedly negative. 67.3% respondents in Canavial and 84.8% in Plancas held negative views of the public latrine. Only 5.8% in Canavial and 4.4% in Plancas viewed the latrines positively, and 26.9% and 10.9% of respondents thought the system was adequate, respectively.
Table 7. Perception of public infrastructure by community Canavial n=56(%) Plancas n=49(%) Ilheu n=57(%) Total n=162(%) P-value
Public water system <0.001
negative 23 (41.1) 8 (17.0) 4 (7.0) 35 (21.9) adequate 8 (14.3) 17 (36.2) 4 (7.0) 29 (18.1) positive 25 (44.6) 22 (46.8) 49 (86.0) 96 (60.0)
clothes washing tanks 0.008
negative 24 (43.6) 21 (44.7) 14 (24.6) 59 (37.1) adequate 15 (27.3) 18 (38.3) 15 (26.3) 48 (30.2) positive 16 (29.1) 8 (17.0) 28 (49.1) 52 (32.7)
28
public latrines 0.055*
negative 35 (67.3) 39 (84.8) 1 (50.0) 75 (75.0) adequate 14 (26.9) 5 (10.9) 0 (0.0) 19 (19.0)
positive 3 (5.8) 2 (4.4) 1 (50.0) 6 (6.0)
*Fisher exact test
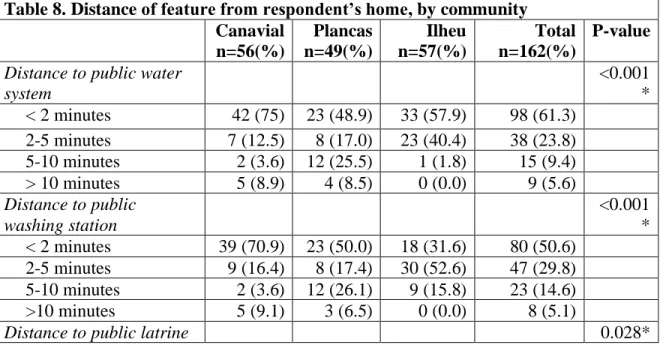
Table 8 outlines the distance from each respondents’ home to infrastructure improvements. To summarize, the respondents from Canavial most reported be close to all infrastructure (over 70% for each improvement), and conversely being the furthest from the natural source of water (nearly 80% over a 10-minute walk). About half of respondents in Plancas reported being less than a two-minute walk from each surveyed improvement, with no natural source of water a reasonable distance away. Lastly, Ilheu had the largest distribution of improvements, with over half of respondents (57.9%) reporting being within a two-minute walk of a source of improved water. Similarly, half reported being within a five-minute walk from the public washing station. The differences by community, with regards to the distance from each improvement to the respondents’ home, was found to be significant for each variable (distance to public water source p<0.001, distance to public washing station p<0.001, distance to public latrine p=0.028, distance to natural source of water p<0.001).
Table 8. Distance of feature from respondent’s home, by community Canavial n=56(%) Plancas n=49(%) Ilheu n=57(%) Total n=162(%) P-value
Distance to public water system <0.001 * < 2 minutes 42 (75) 23 (48.9) 33 (57.9) 98 (61.3) 2-5 minutes 7 (12.5) 8 (17.0) 23 (40.4) 38 (23.8) 5-10 minutes 2 (3.6) 12 (25.5) 1 (1.8) 15 (9.4) > 10 minutes 5 (8.9) 4 (8.5) 0 (0.0) 9 (5.6) Distance to public washing station <0.001 * < 2 minutes 39 (70.9) 23 (50.0) 18 (31.6) 80 (50.6) 2-5 minutes 9 (16.4) 8 (17.4) 30 (52.6) 47 (29.8) 5-10 minutes 2 (3.6) 12 (26.1) 9 (15.8) 23 (14.6) >10 minutes 5 (9.1) 3 (6.5) 0 (0.0) 8 (5.1)
29 < 2 minutes 37 (71.2) 24 (53.3) 2 (100.0) 63 (63.6)
2-5 minutes 8 (15.4) 16 (35.6) 0 (0.0) 24 (24.2) 5-10 minutes 2 (3.9) 5 (11.1) 0 (0.0) 7 (7.1) >10 minutes 5 (9.6) 0 (0.0) 0 (0.0) 5 (5.1) Distance to natural source
of water <0.001 < 2 minutes 2 (3.7) 0 (0.0) 5 (9.3) 7 (6.4) 2-5 minutes 1 (1.9) 0 (0.0) 17 (31.5) 18 (16.5) 5-10 minutes 8 (14.8) 1 (100) 21 (38.9) 30 (27.5) >10 minutes 43 (79.6) 0 (0.0) 11 (20.40) 54 (49.5) *Fisher Exact Test
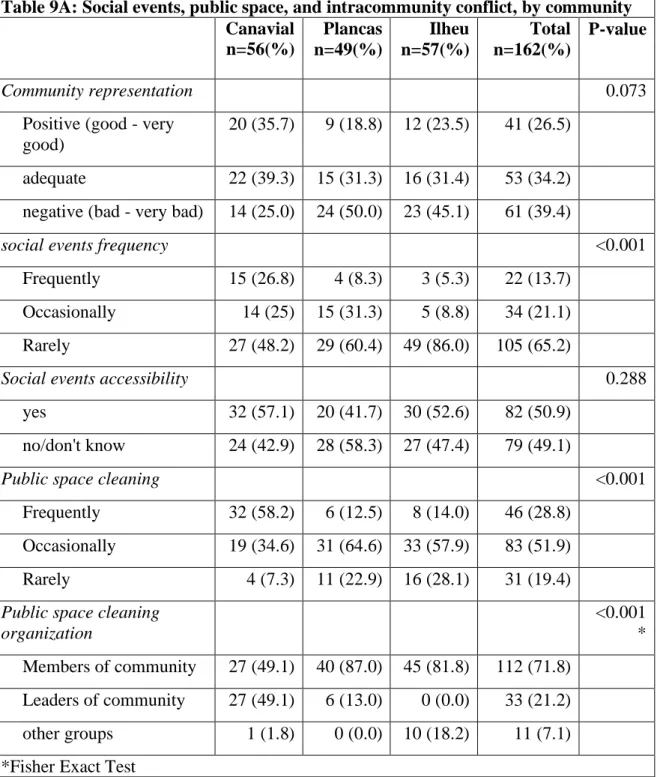
The questions regarding community association (shown in table 9A) include how well respondents feel the community is represented, the frequency and accessibility of community events, the frequency of public cleaning, community wide meetings, and problems between neighbors. Regarding their perception on how well their community is represented, those in Canavial felt the community was either adequately (39.3%) or positively (35.7%) represented. Only one quarter felt the community was poorly represented. In Plancas, 50% felt the community is poorly represented, followed by 31.3% and 18.8% who thought the community was adequately and positively represented, respectively. In Ilheu, a similar trend was seen: 45.1% held negative views, followed by 31.4% with adequate views, and 23.5% with positive views of how their community is represented (p=0.073). Canavial also hosted the most community wide events, with 26.8% of respondents saying such events occur frequently, compared to 25% who report these events as occasional, and the remaining 48.2% saying such events are rare. In Plancas, 60.4% reported such events as very rare, and 31.3% reported events as occasional. In Ilheu, such community events were reported as very infrequent, with 86.0% reporting they rarely occur.
The frequency of community wide cleaning also varied by community. Only in Canavial did most respondents report frequent cleaning (58.2%). In Plancas and Ilheu, just 12.5% and 28.8% reported frequent cleanings. When asked about the organization of these cleanings, the participants from Canavial were split evenly in reporting the members organized the cleaning and the leaders of the community (49.1% each). In Plancas and Ilheu,
30 87.0% and 81.2% of respondents reported cleanings organized by other community members. Only 18.2% of respondents reported cleanings organized by outside groups.
With regards to community wide meetings to discuss problems or questions in the community, such meetings were generally quite rare. Only 8.9% of respondents in Canavial reported such meetings occurring frequently, while close to none reported these meeting in Ilheu (1.8%) and Plancas (0.0%) Such differences were found to be statistically significant (p<0.001). Regarding the efficacy of these meeting, over half of the respondents from Canavial felt the meetings sometimes or rarely resolved the problems at hand (35.7% and 25.0% respectively). Half of respondents in Plancas and Ilheu reported the meetings hardly ever/never work (47.9% and 48.2% respectively). These results were not found to be statistically significant (p=0.060).
When asked about the frequency of problems between community members, Canavial reported them most frequent (37.5%). Respondents from Plancas and Ilheu found such problems to be rare, with 41.7% and 52.6% reporting as such, respectively. These differences were considered statistically significant (p=0.015). Most respondents found the likelihood of receiving support from others in the community to be rare, with 51.8% of respondents in Canavial, 54.2% of respondents in Plancas, and 56.1% of those in Ilheu reported such aid to is unlikely (p=0.596). In keeping with these results, most respondents reported never receiving such aid from others in the community. In Canavial 83.9% reported never receiving aid, compared to 16.1% who received aid at least once. In Plancas 79.2% reported never receiving such aid, compared to 20.8% who did at least once. In Ilheu, 75.4% reported never receiving such aid, and 24.6% who did at least once. These differences were not statistically different (p=0.534).
With regards to how well the community rules were followed, 42.9% of respondents in Canavial reported the rules were well followed, compared to 57.1% who felt they were not followed. In Plancas, 66.7% reported the rules were generally followed, compared to 33.3% who felt they were not. In Ilheu, 63.2% thought the rules were generally followed, and 36.8% thought they were not followed p=0.026).
31
Table 9A: Social events, public space, and intracommunity conflict, by community Canavial n=56(%) Plancas n=49(%) Ilheu n=57(%) Total n=162(%) P-value Community representation 0.073
Positive (good - very good)
20 (35.7) 9 (18.8) 12 (23.5) 41 (26.5)
adequate 22 (39.3) 15 (31.3) 16 (31.4) 53 (34.2) negative (bad - very bad) 14 (25.0) 24 (50.0) 23 (45.1) 61 (39.4)
social events frequency <0.001
Frequently 15 (26.8) 4 (8.3) 3 (5.3) 22 (13.7) Occasionally 14 (25) 15 (31.3) 5 (8.8) 34 (21.1) Rarely 27 (48.2) 29 (60.4) 49 (86.0) 105 (65.2)
Social events accessibility 0.288
yes 32 (57.1) 20 (41.7) 30 (52.6) 82 (50.9)
no/don't know 24 (42.9) 28 (58.3) 27 (47.4) 79 (49.1)
Public space cleaning <0.001
Frequently 32 (58.2) 6 (12.5) 8 (14.0) 46 (28.8) Occasionally 19 (34.6) 31 (64.6) 33 (57.9) 83 (51.9) Rarely 4 (7.3) 11 (22.9) 16 (28.1) 31 (19.4) Public space cleaning
organization <0.001 * Members of community 27 (49.1) 40 (87.0) 45 (81.8) 112 (71.8) Leaders of community 27 (49.1) 6 (13.0) 0 (0.0) 33 (21.2) other groups 1 (1.8) 0 (0.0) 10 (18.2) 11 (7.1) *Fisher Exact Test
Table 9B: Social events, public space, and intracommunity conflict, by community (continued)
32 Canavial n=56(%) Ilheu n=49(%) Plancas n=57(%) Total n=162(%) P-value Frequency of community meetings 0.00* Frequently 5 (8.9) 0 (0.0) 1 (1.8) 6 (3.8) Occasionall y 25 (44.6) 5 (10.4) 6 (10.7) 36 (22.5) Rarely 26 (46.4) 43 (89.6) 49 (87.5) 118 (73.8) Efficacy of community meetings 0.06* Always 7 (12.5) 2 (4.2) 2 (3.6) 11 (6.9) Usually 15 (26.8) 6 (12.5) 8 (14.3) 29 (18.1) Sometimes 20 (35.7) 17 (35.4) 19 (33.9) 56 (35.0) hardly ever/never 14 (25) 23 (47.9) 27 (48.2) 64 (40.0) Frequency of problems in community 0.015 Frequently 21 (37.5) 7 (14.6) 12 (21.1) 40 (24.8) Occasionall y 19 (33.9) 21 (43.8) 15 (26.3) 55 (34.2) Rarely 16 (28.6) 20 (41.7) 30 (52.6) 66 (41.0) Probability of receiving aid from community 0.596 Likely 18 (32.1) 19 (39.6) 18 (31.6) 55 (34.2) Neither likely nor unlikely 9 (16.1) 3 (6.3) 7 (12.3) 19 (11.8) unlikely 29 (51.8) 26 (54.2) 32 (56.1) 87 (54.0) Received aid from community 0.534 At least once 9 (16.1) 10 (20.8) 14 (24.6) 33 (20.5) Never 47 (83.9) 38 (79.2) 43 (75.4) 128 (79.5) Adherence to community rules 0.026 Yes 24 (42.9) 32 (66.7) 36 (63.2) 92 (57.1)
33
No 32 (57.1) 16 (33.3) 21 (36.8) 69 (42.9)
*Fisher Exact Test
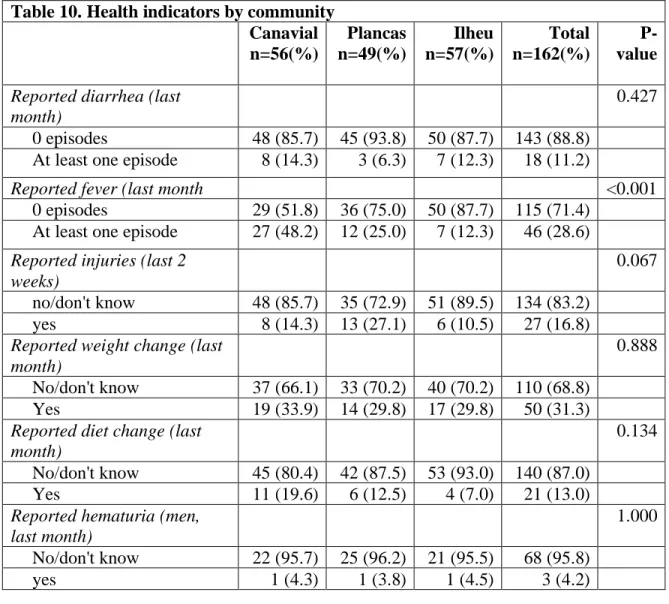
Table 10 shows the results of some related-indicators to parasitosis and hygiene related health outcomes among the participants. The responses were grouped as not occurring in last month (or two weeks) or occurring at least once. No differences were found between communities for self-reported diarrhea in the past month (p=0.427), with 11.2% of all respondents reported having at least one episode of diarrhea. Diarrhea was defined as three or more loose stools in the period of one day(Shane et al. 2017). Episodes of fever in the last month were found to be statistically significant across the three communities (p<0.001), with 48.2% of the respondents in Canavial reporting suffering from at least one episode of fever in the past month. This value was found to be much higher than in Plancas or Ilheu, where 25.0% and 12.3% respectively reported at least one episode of fever. With regards to reported injuries in the past two weeks, Plancas had the largest proportion of reported injuries, at 27.1%. Canavial and Ilheu had fewer reported injuries, with 14.3% and 10.5% respectively. However, these differences were not determined to be statistically significant (p=0.067). There was no difference in reported weight change by community in the past month (p=0.888), where 31.3% of the total sample reported some weight change, and only 13.0% of all respondents reported some change in their diet. Of all male respondents, 3 (4.2%) reported having at least one instance of hematuria in the past month. Regarding instances of seeing blood in the feces, 5.6% of all respondents reported at least one instance in the past month, with no differences between communities (p=0.353). 25.0% of respondents reported some stomach pain or bloating in the last month, without much differences between communities (p=0.292). The total health variable notes the aggregated reported health outcomes of the participants. Most respondents from all communities reported at least one health problem in the past month. In Canavial, 78.3% reported at least one of the problems outlined in the study. In Plancas and Ilheu, 69.2% and 63.3% of respondents reported at least one problem, respectively. While there is a downward trend between by community, these differences were not found to be significant (p=0.554).