UNIVERSIDADE DE LISBOA
FACULDADE DE CIÊNCIAS
DEPARTAMENTO DE BIOLOGIA ANIMAL
Shifting baselines in Mediterranean artisanal fisheries
Pedro Cardoso Leitão
Mestrado em Ecologia Marinha
Dissertação orientada por:
Doutora Rita Pina Vasconcelos
Doutor José António García-Charton
ACKNOWLEDGMENTS
Acknowledgments
To Rita Vasconcelos, Sofia Henriques and José Charton for all the effort, work and friendship in believing in me and helping me during this workJ
A special thanks to my mother and my brother for always believing and supporting me in this work and throughout the lifetime and who I thank for shaping the person that I am todayJ
To Catarina Gil for her love, patience and help in the development of my thesis and for always believing in me although it kept us a part (706.200 km to be precise) for a few monthsJ
To all my dearest friends that I could not spend more time due to the development of this work but are always in my heartJ
Research was funded by project BIOCHRONOLOGY (PTDC/AAGGLO/5849/2014). Host institution MARE was funded with project UID/MAR/04292/2013, S. Henriques was funded with a Post-Doc grant (SFRH/BPD/94320/2013) and R.P. Vasconcelos with Investigador FCT Programme (IF/00058/2013) all from Fundação para a Ciência e a Tecnologia, supported by national fundsJ
RESUMO
Resumo
A sobre-exploração dos recursos marinhos em conjunto com uma insuficiente gestão costeira e pesqueira levou à degradação dos ecossistemas marinhos, à perda de biodiversidade e serviços ecossistémicos a nível global. Especificamente, a intensificação da atividade pesqueira levou ao decréscimo de abundância de espécies ao longo do tempo e com o surgimento de novos pescadores, a perceção da abundância local alterou-se originando uma perceção de quantidade comparativamente a décadas passadas, isto é conhecido com a síndrome de alterações de linhas de base. Este trabalho investiga, através de questionários a pescadores, como a perceção da abundância de pescado se alterou no tempo (1970 até 2016) e espaço (quatro diferentes portos) na pesca artesanal de Múrcia, Espanha. Através dos resultados de 40 questionários, identificou-se um decréscimo de abundância entre 1970-1990 e 2000-2016, e que a maioria das espécies reportadas decresceu (79.7%) tendo algumas como Octopus vulgaris, Merluccius merluccius e Polyprion americanus decrescido de forma mais acentuada o que poderá ser atribuído à sobrepesca e degradação do habitat. Também foi identificado o decréscimo da maioria das características funcionais (92%) durante este período e algumas categorias decresceram de forma mais acentuada como espécies de elevadas profundidades, que se encontram no ambiente bentónico, migradoras de curtas distâncias e que se alimentam de invertebrados. O decréscimo mais acentuado destas características funcionais poderá ser atribuído à falta de plasticidade das espécies a alguns impactos como degradação do habitat e eutrofização ou à pesca de níveis tróficos inferiores. Algumas características funcionais (espécies com comprimento máximo muito elevado, que habitam profundidades muito elevadas, de comportamento solitário, que migram anualmente elevadas distâncias, apresentam elevada mobilidade diária e compreendem uma dieta macrocarnívora), eram mais elevadas nos portos a norte do que a sul. Apesar de algumas categorias funcionais covariarem, este resultado sugere uma influência da reserva marinha de Cabo de Palos – Islas Hormigas (através de transbordamento) nos portos a norte que também têm maior complexidade de habitat. Os resultados do presente estudo, apesar de dependerem da perceção de pescadores e respetivas limitações, demonstram como o conhecimento ecológico local pode ser usado para recolher informação do passado e presente sobre espécies comercialmente exploradas aplicando-a a um nível funcional.
ABSTRACT
Abstract
The overexploitation of marine resources combined with insufficient coastal and fisheries management have led to the degradation of marine ecosystems throughout the world leading to loss of biodiversity and ecosystem services. Increase in fishing activity led to a decrease in species abundance over time. As new fishers arise, the perception of local abundance changes resulting in a different perception of quantity compared to past decades which is known as “shifting baselines syndrome”. This study investigates, through questionnaires, how the perception of fish abundance by fishers changed through time (1970 to 2016) and space (four different ports) in the artisanal fisheries of Murcia, Spain. From the results of the 40 questionnaires made, we identified a decrease between the 1970-1990 and 2000-2016 and that most reported species decreased in abundance (76.7%), more severely the Octopus vulgaris, Merluccius merluccius and Polyprion americanus which may be due to overfishing and habitat degradation. We also identified the decrease of most functional traits (92%) in this period, and especialy trait categories (very deep depths, benthic, yearly migration over small distances and/or invertebrate feeders). These more abrupt decreases may be attributed to lower species plasticity to human impacts such as habitat degradation and eutrophication or to fishing lower trophic levels of the food web. Certain functional traits (very large size, deep maximum depth, solitary behaviour, large distance migratory, very vagile and macrocarnivore diet) were higher in the north ports compared to the southern ports. Although some of this functional trait categories covary, these findings suggest an influence of the Cabo de Palos – Islas Hormigas marine reserve (through spill-over) on the northern ports which also have higher habitat complexity. The results of present study, although dependent on fishers’ perceptions and respective limitations, show how local ecology knowledge can be used to collect past and present information on commercial fish species and applied to an abundance and trait-based approach.
RESUMO ALARGADO
Resumo alargado
O ambiente marinho compreende mais de 70% da superfície terrestre. Este ambiente possui uma vasta diversidade de ecossistemas marinhos que desempenham funções importantes quer a nível ecológico (sequestro de dióxido de carbono atmosférico, reciclagem de nutrientes, regulação da qualidade da água), quer a nível social (transporte, turismo). Apesar de dependermos fortemente destas funções, elas não têm sido devidamente acauteladas na gestão ambiental. As múltiplas pressões a que o ambiente está exposto, e designadamente a biodiversidade do meio marinho (sobrepesca, destruição do habitat, poluição, alterações climáticas), condicionavam a elaboração de um tratado internacional, a Convenção sobre a Diversidade Biológica, que entrou em vigor em 1993. A nível do ambiente marinho, tem como objetivo contribuir para a sua proteção, de maneira a gerir de forma sustentável a exploração dos seus recursos vivos, incluindo a redução do decréscimo de espécies ameaçadas, e também para a salvaguarda dos ecossistemas que prestam serviços e as comunidades humanas que deles dependem. Na sequência deste tratado, e para preservar os mananciais de peixes e exploração de recursos vivos, a União Europeia, desenvolveu legislação (como a Diretiva Quadro Estratégia Marinha) e adotou políticas comunitárias (como a Política Comum das Pescas). No contexto destes instrumentos a União Europeia avalia os níveis de exploração do pescado e atribui cotas de captura aos diferentes estados membros. O Mar Mediterrâneo, partilhado por 22 países, constitui um dos ecossistemas marinhos mundiais mais ameaçados. Para tal contribuem a sobrepesca, a degradação do habitat e a poluição de origem terrestre tais como a eutrofização (agricultura e descargas poluentes), e as modificações da costa e a urbanização. As alterações climáticas e a introdução de espécies não indígenas também têm contribuído para o problema. A sobrepesca foi identificada como uma ameaça importante. A maioria dos recursos vivos do Mar Mediterrâneo são sobre-explorados (96%), existindo um elevado número de capturas ilegais. Apesar de 9.5% da área marinha do Mar Mediterrâneo ser protegida, são necessários mais esforços para implementar medidas que regulamentem no sentido da sua conservação, para o que contribuirá o conhecimento da evolução das pescas ao longo do tempo. Conhecer a evolução da abundância de captura de pescado ao longo do tempo não é fácil, dada a dificuldade em obter dados passados, com frequência escassos ou inexistentes, especialmente em países em vias de desenvolvimento. Nestas circunstâncias, pode-se em parte reconstruir capturas e abundâncias de décadas passadas pela perceção intrínseca das pessoas que dependem da pesca, permitindo uma abordagem através do conhecimento ecológico tradicional e local.
O estudo aqui apresentado teve como objetivo avaliar alterações de linhas de base na pesca artesanal no Mar Mediterrâneo, através da perceção que os pescadores têm da abundância local e das suas modificações comparativamente a décadas passadas, de forma a contribuir para uma melhor gestão das pescas e da costa. O estudo foi realizado na região de Múrcia, Espanha (Mediterrâneo Oeste), pertencente à região marinha das Baleares (como definida pela Organização para a Alimentação e Agricultura em 2004). Foi considerada a variação da pesca comercial artesanal de pequena escala no tempo (entre 1970 e 2016) e no espaço (quatro portos). Foram realizados inquéritos a 40 pescadores artesanais, sendo a seleção dos inquiridos feita através do método de amostragem “bola de neve”. Os questionários eram constituídos por seis capítulos, referentes a: informação pessoal, informação sobre o barco, perceção das linhas de base, alterações climáticas, esforço de pesca e captura acidental de aves marinhas. Para a classificação das características funcionais de cada táxon identificado pelos pescadores (n=31) foram utilizadas características funcionais. Foram identificados o comprimento máximo, a profundidade máxima, o habitat, a dieta, o comportamento de agrupamento, a territorialidade, e ainda o movimento das espécies, quer anual, quer diário. Foi também avaliado o valor económico das espécies. Os dados recolhidos foram analisados estatisticamente.
No que se refere ao período de tempo avaliado, os pescadores entrevistados descreveram um decréscimo da abundância de pescado ao longo das décadas (entre as décadas de 1970-1990 e
2000-RESUMO ALARGADO
x
2016). Estes dados confirmam os descritos por outros autores, que sugerem que o aumento do esforço de pesca e a insustentabilidade na exploração de pescado originaram a sobre-exploração dos mananciais do Mediterrâneo Oeste. A nível das espécies verificou-se que 76.7% das espécies reportadas decresceram entre as décadas de 1970-1990 e 2000-2016. Destas espécies, algumas decresceram mais abruptamente (Octopus vulgaris, Merlucius merlucius e Polyprion americanus), sendo que as razões para o decréscimo estão provavelmente relacionadas com a sobre-exploração dos mananciais (nomeadamente a pescada, Merlucius merlucius) e com a importância relativa destas espécies para a economia nacional do pescado. Apesar de alguns autores sugerirem a possibilidade de o grupo dos cefalópodes tender para um aumento global, a escassez de dados no que respeita ao estado das populações de polvos (Octopus vulgaris) sugere que se tenha uma gestão de precaução. Relativamente ao cherne (Polyprion americanus), o estado dos mananciais e impactos da pesca continuam por investigar uma vez que existe escassez de dados relativos ao estado das populações no Mar Mediterrâneo. Recorrendo a análises baseadas nas características funcionais verificou-se uma diminuição significativa ao longo do tempo na maioria das características (92%). A perda mais severa nas categorias funcionais foi verificada nas espécies de elevadas profundidades, nas que se encontram no ambiente bentónico, nas migradoras de curtas distâncias e nas que se alimentam de invertebrados. O decréscimo poderá estar associado à maior (ou menor) plasticidade das espécies para se adaptarem a novas condições do meio face aos impactos antropogénicos. Estes impactos incluem a sobrepesca, a degradação do habitat através da poluição, como a eutrofização, e a modificação costeira devido ao aumento da população e do turismo. Através da análise das características funcionais das espécies entre os diferentes portos verificou-se que os dois portos a norte apresentaram valores mais elevados para as espécies com categorias de comprimento máximo muito elevado, que habitam profundidades muito elevadas, de comportamento solitário, que migram anualmente elevadas distâncias, que apresentam elevada mobilidade diária e que têm uma dieta macrocarnívora. As diferenças geográficas obtidas (maior abundância a nível geral e algumas características funcionais nos portos a norte) poderão dever-se à existência de uma área marinha protegida (Cabo de Palos – Islas Hormigas) estabelecida há mais de 20 anos, que se encontra entre os dois portos a norte, admitindo-se transbordo de biomassa para as áreas adjacentes, como verificado por outros autores. Para as diferenças geográficas admite-se ainda ter contribuído a complexidade do habitat do tipo de recife rochoso na região a norte, que amplia a área de superfície e favorece ecossistemas mais ricos e abundantes em espécies. O presente estudo possibilitou observar as alterações do decréscimo generalizado e a nível das espécies de pescado ao longo dos últimos 50 anos e quais as espécies mais afetadas. A nível das funcionalidades desta fração da comunidade de peixes, foi possível verificar a diminuição de capturas de várias características funcionais a nível temporal e diferenças a nível espacial. Apesar dos resultados terem sido obtidos de acordo com as boas práticas recomendadas, devem ser interpretados cautelosamente, atendendo a que os dados foram obtidos através de questionários e focalizaram-se apenas numa parte da comunidade de peixes. No entanto, devido à escassez de informação nesta área, e para estabelecimento de linhas de base para a conservação de ecossistemas marinhos, devem ser consideradas a importância deste tipo de recolha e a sua interpretação.
As comunidades de peixes e invertebrados são fundamentais para o ecossistema marinho (controlo populacional, reciclagem de alimento) sugerindo-se estudos no sentido de avaliar qual o impacto da sua exploração sobre os ecossistemas, de forma a melhor adequar as artes e técnicas de pesca. As áreas marinhas protegidas estabelecem importantes abrigos para várias espécies, sugerindo-se estudos no sentido de compreender o efeito do transbordo de biomassa e a sua importância ecossistémica. Devido ao aumento de novas ameaças no Mar Mediterrâneo, designadamente alterações climáticas e introdução de espécies não indígenas, mais estudos devem ser realizados de forma a avaliar se os outros impactos interferem com a abundância de espécies pescadas, no sentido de melhorar a gestão das pescas.
RESUMO ALARGADO
Através da investigação dos impactos crescentes sobre o Mar Mediterrâneo e das suas relações, poder-se-ão desenvolver medidas mais consistentes para a proteção da sua biodiversidade, e dos serviços de ecossistema que este Mar providencia.
CONFERENCES
Conferences
Leitão P, Henriques S, García-Charton JA, Lorenzi M, Vasconcelos RP (2017) Shifting
baselines of artisanal fisheries in the west Mediterranean (Murcia, Spain). In: Oceans Past VI
international conference. Sesimbra, (oral presentation)
INDEX
Acknowledgments ... iii
Resumo ... v
Abstract ... vii
Resumo alargado ... ix
List of figures ... xvii
List of tables... xix
General Introduction ... 1
Introduction ... 5
Material and Methods ... 7
Study area ... 7
Sampling method ... 8
Functional trait classification ... 8
Data analysis ... 11
Results ... 13
Discussion ... 27
Final Remarks ... 33
References ... 37
APPENDICES ... xxi
LIST OF FIGURES
List of figures
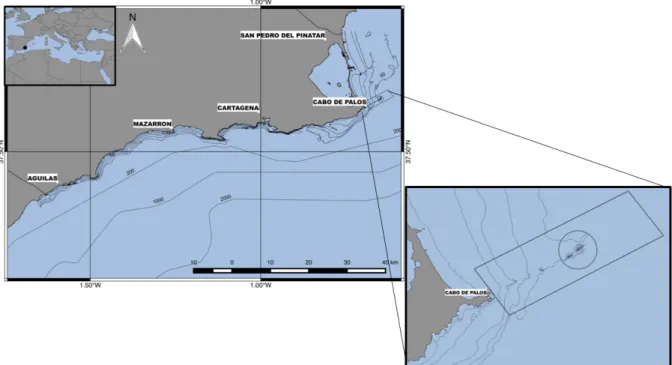
Figure 1. Map of the coast of the Murcia region with sampling ports (North to South: San Pedro del Pinatar, Cartagena, Mazarron, Águilas) in the context of the Mediterranean Sea (upper left corner) and the zoom section of the Cabo de Palos – Islas Hormigas marine reserve (lower right corner). ... 8
Figure 2. Boxplot of fishers scores to taxa catches in the Mediterranean throughout the last decades (1970 to 2016) and the respective sample size (n is the number of times a species is referred by a fisher in a total of 40 interviews) of each year. Different letters represent significantly different decades (for P < 0.05). ... 13
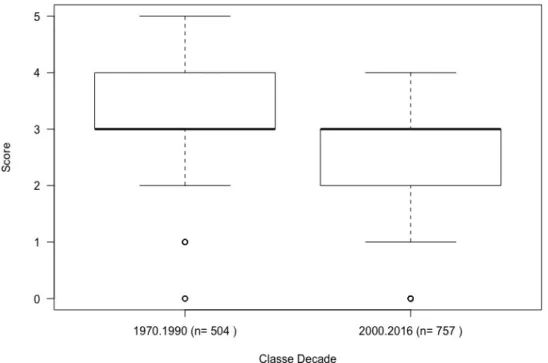
Figure 3. Boxplot of fishers scores to taxa catches in the Mediterranean between the two class decades (1970 to 1990 and 2000 to 2016) and the respective sample size (n is the number of times a species is referred by a fisher in a total of 40 interviews) of each class. Different letters represent significantly different decades (for P < 0.05). ... 13
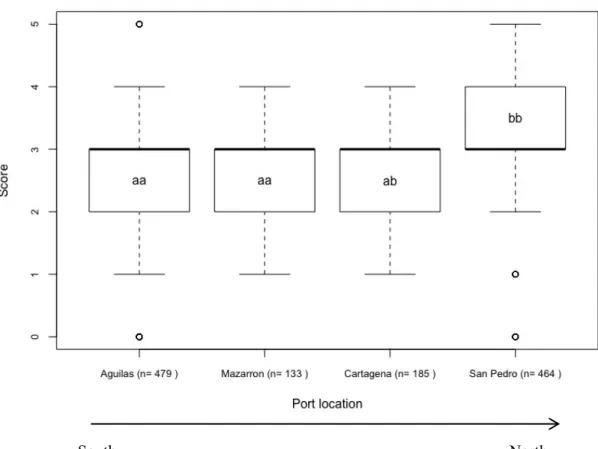
Figure 4. Boxplot of fishers’ abundance scores for abundance according to each port (Águilas, Mazarrón, Cartagena and San Pedro del Pinatar) of the Mediterranean region and the respective sample size (n is the number of times a species is referred by a fisher in a total of 40 interviews). The locations are ordered geographically (from South to North). Different letters represent the groups formed by the post-hoc pairwise comparison (for P < 0.05). ... 15
Figure 5. Boxplot of fishers scores between port (Águilas, Mazarrón, Cartagena and San Pedro del Pinatar) in each class decade (1970 to 1990 and 2000 to 2016). ... 17
Figure 6. Boxplots of Zeus faber fishers scores over the two classes of time (1970 to 1990 and 2000 to 2016) of increase abundance and the respective sample size (n is the number of times a species is referred by a fisher in a total of 40 interviews). ... 19
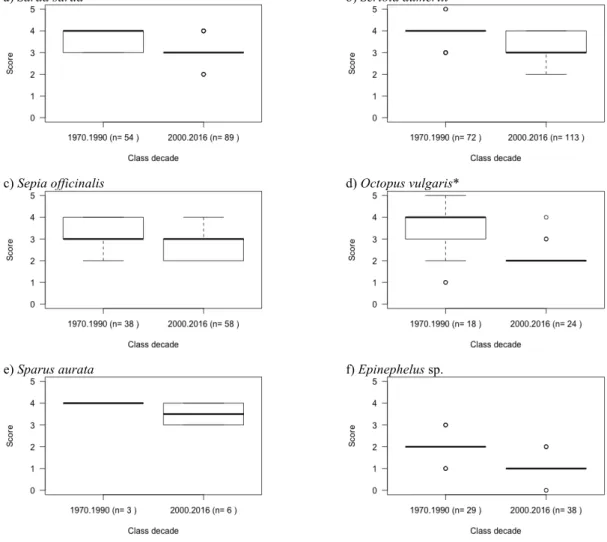
Figure 7. Boxplots of fishers’ abundance scores during the two classes of time (1970 to 1990 and 2000 to 2016) for species that decreased in abundance and the respective sample size (n is the number of times a species is referred by a fisher in a total of 40 interviews). * species that have a strong decrease (change in 2 or more score points for species with n > 5). ... 19
Figure 8. Boxplots of fishers’ abundance scores during two classes of time (1970 to 1990 and 2000 to 2016) for species stable in abundance and the respective sample size (n is the number of times a species is referred by a fisher in a total of 40 interviews) for each class. ... 22
LIST OF TABLES
List of tables
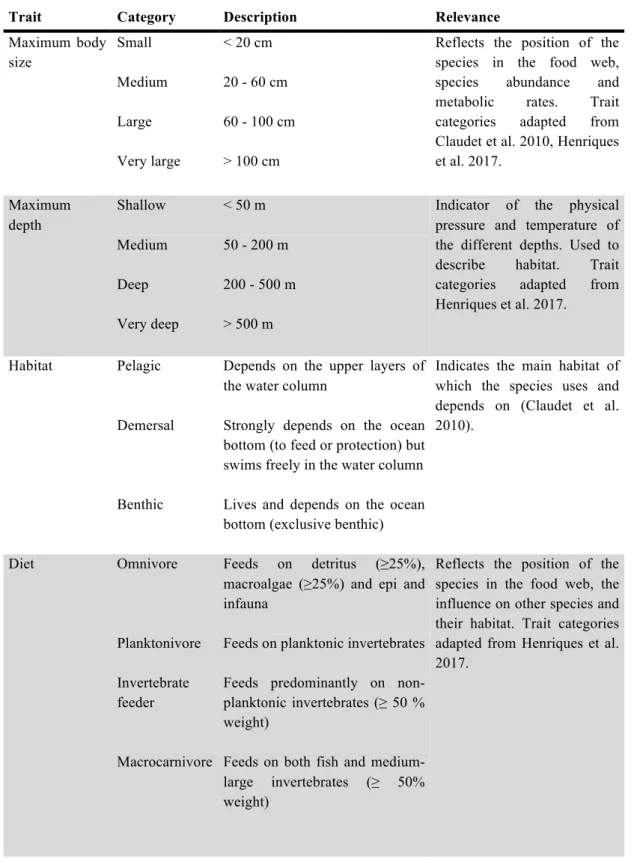
Table 1. Functional traits, respective categories, description and specific relevance. ... 9
Table 2. Results of PERMANOVA analysis of the Euclidean dissimilarities of the fisher’s abundance score in decade capture (1970 to 2016) and class decade (1970 to 1990 and 2000 to 2016); Df = degrees of freedom; Pseudo-F = F value by permutation. Bold indicates statistical significance (P < 0.05); P - values are based on 9999 permutations. ... 14
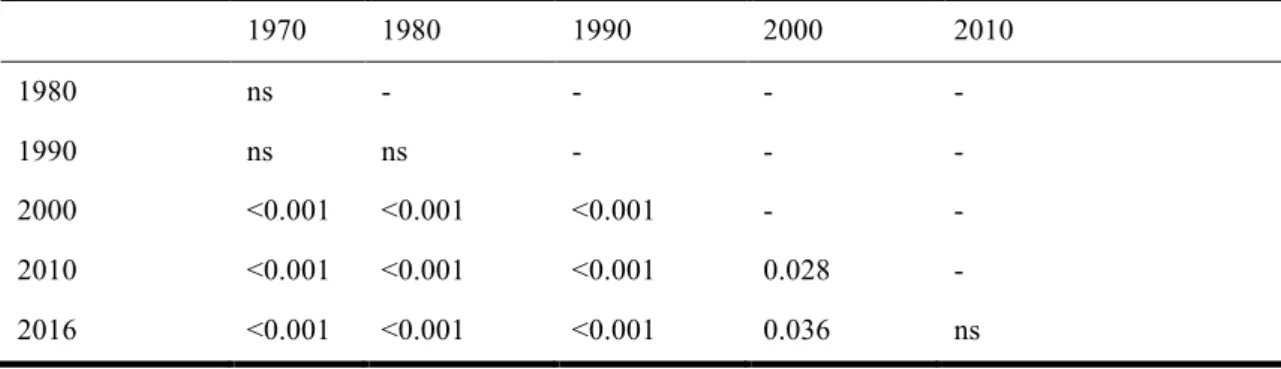
Table 3. Results of pairwise tests of the fisher’s abundance score between year captures from 1970 to 2016 of the Mediterranean. Table shows P-values for the different tests; ns = non-significant P-values at P < 0.05. ... 14
Table 4. Results of pairwise tests of fisher’s abundance scores between the Mediterranean ports of Águilas, Mazarrón, Cartagena and San Pedro del Pinatar. Table shows P-values for the different tests; ns = non- significant P-values at P < 0.05. ... 15
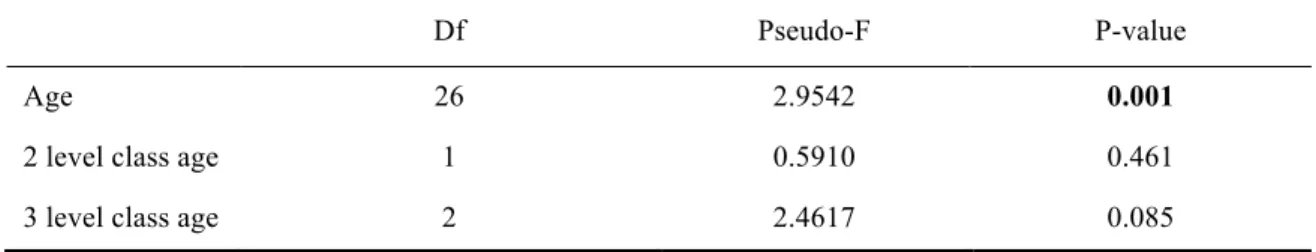
Table 5. Results of PERMANOVA analysis of dissimilarities (Euclidean) of fisher’s abundance score for age, and 2 (young and old) and 3 level (young, adult and old) class age; Df = degrees of freedom; Pseudo-F = F value by permutation. Bold indicates statistical significance (P < 0.05); P-values are based on 9999 permutations. ... 16
Table 6. Results of two-way PERMANOVA analysis of the Euclidean dissimilarities for the fishers’ abundance scores between each variable (decade, class decade, age, 2 and 3 level class age, and port). Df = degrees of freedom; Pseudo-F = F value by permutation; ns = non-significant. Statistical significance (P < 0.05); P-values are based on 9999 permutations. ... 16
Table 7. Respective sample sizes (n) for the boxplots of class decade (1970 to 1990 and 2000 to 2016) and port (Águilas, Cartagena, Mazarrón and San Pedro del Pinatar). ... 18
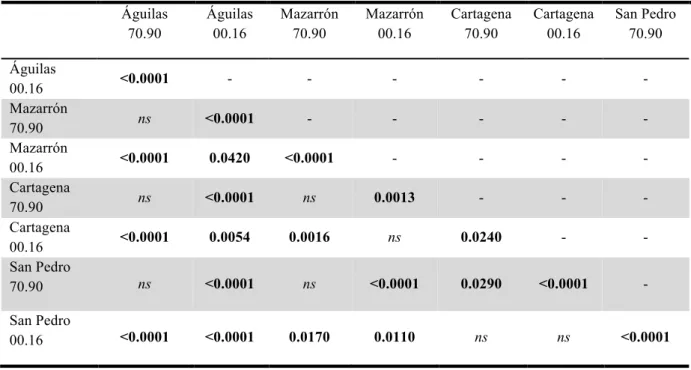
Table 8. Pairwise tests of the different interactions between ports (Águilas, Mazarrón, Cartagena and San Pedro del Pinatar) and class decade (1970 to 1990 and 2000 to 2016). Statistical significance (P < 0.05). ... 18
LIST OF TABLES
xx
Table 9. SIMPER analysis of species that explain the dissimilarity of presence/absence between the class decade 1970 – 1990 and 2000 – 2016. The average dissimilarity of each species and the cumulative dissimilarity are represented in percentages. ... 23
Table 10. Results of PERMANOVA analysis of fishers’ abundance score of each trait between class decades (1970-1990 and 2000-2016) and the respectively average score trend (- = slight decrease [-0.409; -0.584], -- = moderate decrease [-0.584: - 0.759], --- = severe decrease [-0.759: -0.935]) and variation. Df = degrees of freedom; Pseudo-F = F value by permutation. Bold indicates statistical significance (P < 0.05); P-values are based on 9999 permutations. ... 24
Table 11. Results of PERMANOVA analysis of the Euclidean dissimilarities of the fisher’s abundance score of each trait and category between the different ports (San Pedro del Pinatar, Cartagena, Mazarrón and Águilas) and the respectively average score and pairwise dissimilarity represented with letters (i.e. (a) is statistical different to (b) or (c) but not (a) or (ab)). Df = degrees of freedom; Pseudo-F = F value by permutation. Bold indicates statistical significance (P < 0.05); P-values are based on 9999 permutations. ... 25
Table 12. Summary of the dissimilarity pairwise test results between the different traits (size, maximum depth, habitat, schooling behaviour, yearly displacement, territorial behaviour, mobility, diet) and ports (Águilas Cartagena, Mazarrón and San Pedro). Percentages represent overall dissimilarity and respective the sample size (n). ... 26
GENERAL INTRODUCTION
General Introduction
Marine ecosystems comprehend approximately 71% of the surface of the planet and contain about 97% of water on Earth. Marine ecosystems support 25% of all known species, but it is estimated that another 91% still remain undiscovered (Mora et al. 2011), and play crucial ecological functions, such as sequestration of CO2 in larger amounts than the terrestrial biosphere (Sabine 2004), nutrients cycling
and the regulation of their availability for marine species (Attiwill 1983), as well as providing crucial services such as maintaining water quality (Worm et al. 2006) and food supply for a world human demand of 20 kg per capita (FAO 2016a). Socially, marine ecosystems provide the means of maritime transportation and ensure recreational use of certain areas for leisure (e.g. coastal tourism; Worm et al. 2006). Although some of these ecological functions are well studied, many of the processes that influence the provision of ecosystem services to Humankind are not accounted for when managing the marine environment (Costanza 1999, Liquete et al. 2016).
Marine ecosystems are currently at risk worldwide (Worm et al. 2006, Selig et al. 2013). Multiple impacts such as overfishing, habitat degradation, pollution and climate change (Jackson et al. 2001, Halpern et al. 2008) are influencing marine biodiversity and the ecosystems capacity to perform the important, above mentioned, ecological processes (Hawkins et al. 2003, Worm et al. 2006). In the effort to limit biodiversity loss, in 1993 the Convention for Conservation of Biodiversity came into force, and later the Aichi Biodiversity targets were proposed to be achieved by 2015 and 2020. Among other targets, they include to (i) sustainably manage and harvest fish and invertebrates, and (ii) identify and reduce the observed decline of threatened species and safeguard ecosystems that provide essential services and their local communities (CBD 2013).
The Mediterranean Sea is one of the most threatened marine ecosystems worldwide (Coll et al. 2010). Overfishing of fish stocks like hake, red mullet and sardine (Fernandes et al. 2017), habitat degradation and land-based pollution have been the major impacts in Mediterranean Sea (Coll et al. 2010). While eutrophication due to agriculture and sewage discharges may cause episodes of harmful algal blooms that disrupt food webs (Heisler et al. 2008), coastal modification and urbanization degrade productive near-shore ecosystems (e.g. wetlands, seagrass meadows, coastal lagoons; Beck & Airoldi, 2007). In addition, climate change (Coll et al. 2010) and the invasion of alien species throughout the Suez Canal (Galil et al. 2014) are emerging and urgent issues that could modify marine ecosystems (Cheung et al. 2009). In the Mediterranean Sea, the dependency for food is evident since 22 countries in three different continents share this sea. Because of this, overfishing is a major issue in local ecosystems and fish stocks of the Mediterranean, where increasing landings of commercially exploited species, since the 1990, have been reported (Vasilakopoulos et al. 2014) and all assessed stocks are being unsustainably exploited (Fernandes et al. 2017). Overfishing is a major threat in marine ecosystems and arises when the exploration of fish stocks is faster than their ability to replenish (Jackson et al. 2001). The world population has been growing exponentially since the industrial era and with it food demand grows, with fish products being one of the main protein sources (FAO 2016a). From a simple, artisanal, subsistence and near shore activity, fisheries evolved to a commercial, complex and more profitable activity with larger catches and new, deeper, fishing grounds being exploited due to technological and preservation storage innovations (Sahrhage & Lundbeck 1992). Commercial fisheries worldwide can be divided into two major categories: scale and commercial fisheries. While small-scale artisanal fisheries consist of small capital investments, technologically simple gear and vessels with small catches for subsistence or local markets (Kurien & Willmann 2009), large-scale commercial fisheries focus on profiting from fisheries with more complex and specialized gear, larger autonomy and coastal distance and higher catches when compared to small-scale (Carvalho et al. 2011). In the Mediterranean, small-scale fisheries represent 80% of total fisheries, employ 55% of fishers but only accounts for 12% of all landings (FAO 2016b). While strict regulations for pollution, coastal
GENERAL INTRODUCTION
2
management and fishing exists (Cacaud 2005), it is necessary to minimize these impacts on ecosystems, for example through the implementation of marine protected areas (Gabrié et al. 2012, Bastari et al. 2016) and the identification of eutrophic areas as well as their respective trends (Karydis & Kitsiou 2012).
In order to protect the marine environment across Europe, the European Union set a series of steps by implementing the Marine Strategy Framework Directive (The European Parliament and the Council of the European Union 2008) in order to achieve a good environmental status of marine waters by 2020. Its objective is to maintain ecosystems function and resilience (capacity to absorb human impacts), to prevent the decline of biodiversity, and to control substance, energy and noise pollution (The European Parliament and the Council of the European Union 2008). This is achieved through a series of procedures that start by the assessment of the marine environmental status, followed by setting up proper monitoring protocols, and establishing and implementing adequate management measures. Related to the fisheries descriptor, EU member states should assess mortality rates, biomass of spawning stock and the age and size structure of fish populations of commercially exploited fish and shellfish stocks (European Commission 2017a). In the fisheries sector, the Common Fisheries Policy was firstly established in 1970 although designed primarily to give equal access to European waters and fishing grounds, its aims is also to seek for an environmentally, economically and socially sustainable fisheries (European Commission 2017b). Since fisheries need to be sustainable and ensure their availability for future generations, fisheries management regulates both the input (access to waters, fishing effort and technical measures) and the output (total allowable catches and quotas) of fishing fleets (European Commission 2017b).
To evolve towards sustainable fisheries, management actions need to decrease fisheries impacts on species and habitats. Ideally, fisheries should be highly selective for the targeted species to reduce bycatch, unaccounted mortality or ghost fishing (FAO 1995). Management tools for fisheries sustainability include reducing catches of non-targeted species (through for examples sorting nets in trawlers), area restrictions (protected areas, including no-take zones) or time restrictions (closed seasons) to ensure productive capacity of stocks, minimal landing sizes to protect certain life stages and fishing quotas controlling landings (Kurien & Willmann 2009).
Fisheries management relies on key information including species official catches (i.e. landings) and stock assessment data (i.e. spawning stock biomass). In the European context, the assessment of fish stocks is transmitted from the Scientific, Technical and Economic Committee for Fisheries (STECF), International Council for the Exploration of the Seas (Atlantic Ocean and Baltic Sea) and General Fisheries Commission for the Mediterranean (Mediterranean and Black Seas) to the European Commission (European Commission 2017c). While the STECF is the only advisory body that reports directly to the European Commission, the ICES and GFCM are secondary sources that the EU might reach to complement their fisheries management advice in implementing the Common Fisheries Policy (European Commission 2017c). While stock assessment can be complicated by insufficient or inexistent biological data (Oliver 2002), official landings reported by each member state sometimes lack significant catches that are not accounted for (illegal unreported and unregulated; IUU; Agnew et al. 2009, Coll et al. 2015) which may lead to underestimation of stocks exploitation rates and could result in overfishing. This is of particular concern in the Mediterranean Seas, as overexploitation of assessed fish stocks is concerning (93%; WWF 2016) and IUU comprehend significant catches, especially in the western Mediterranean area like Spain (Pauly et al. 2014).
The objective of this study is to identify changes in fishers' perception in artisanal fisheries at a local scale (Region of Murcia, Spain, SW Mediterranean), and to investigate if fisher’s questionaries’ can be used as a tool for fisheries and coastal management.
Shifting baselines in artisanal fisheries
Leitão P1, García-Charton JA2, Henriques S1, Vasconcelos RP1
1 MARE - Marine and Environmental Sciences Centre & FCUL - Faculdade de Ciências da
Universidade de Lisboa, Campo Grande, 1749-016 Lisboa, Portugal;
2 Departamento de Ecología e Hidrología, Universidad de Murcia, Campus de Espinardo, 30100 Murcia,
INTRODUCTION
Introduction
The overexploitation of marine fisheries resources together with an unsustainable use of coastal areas have led to the degradation of marine ecosystems worldwide leading to loss of biodiversity and ecosystem functioning and services (Worm et al. 2006, Halpern et al. 2008). The Mediterranean sea is no exception, with a coastal population of 250 million people, over 96% of assessed fish stocks over-exploited (European Comission 2015) and intense human activities and impacts on marine biodiversity and habitats (Coll et al. 2012). Currently, the major pressures on marine ecosystems of the Mediterranean are habitat loss and degradation, overexploitation of fish stocks, pollution and more recently introduction of non-indigenous species mainly through the Suez Canal (Coll et al. 2010, Galil et al. 2014). Today, the Mediterranean Sea is one of the most human impacted marine ecosystems in the world (high to very high levels; Halpern et al. 2008).
Assessing the status of marine ecosystems and implementing effective management and conservation strategies (e.g. marine protected areas - MPAs) is essential for protecting biodiversity (García-Charton & Pérez-Ruzafa 1999). Finding the balance between a sufficient exploitation of natural resources to meet demands and a sustainable use of marine ecosystems is an immense challenge (FAO 2016a). It is increasingly accepted that to accurately assess this relationship an ecosystem-based management (EBM) should be taken into account (Christensen et al. 1996), but EBM is in an early stage due to its complexity. For many decades management was made on a species- or sector-level (e.g. fisheries) without relating to other ecosystems processes or services (Zerhouni 2004). In contrast, ecosystem-based management can consider species according to their functions in the ecosystem and their relationships with other organisms and physical processes, whilst also taking into account human interactions (Long et al. 2015).
Meaningful assessments of marine ecosystems (including EBM) require identifying baselines (i.e. pristine/undisturbed state of marine ecosystems without or with minimal anthropic impacts) to establish reference conditions. These baseline/reference conditions guide management and conservation actions aiming at reducing anthropogenic impacts, while protecting, preserving and restoring marine ecosystems (The European Parliament and the Council of the European Union 2008). In the case of fisheries, these baselines are used to meet the EU objectives of ensuring the availability for present and future generations of fish stocks and fisheries sector (Council of the European Union 2002, European Union 2014). The assessment of stock changes is done by comparing observed values with these baseline/reference points (Markham & Browne 2007, Knowles et al. 2015), to understand how the environment evolved through time and which human activities influenced them (Edgar et al. 2004).
In addition, recent European directives call for the integrated assessment of marine ecosystems, such the Marine Strategy Framework Directive which aims to achieve “good environmental status” (GES) in marine ecosystems by 2020 (The European Parliament and the Council of the European Union 2008). However, defining how ecosystems were in a previous pristine/undisturbed state (i.e. in good environmental status) is difficult in many countries/regions due to low data availability (Honey et al. 2010). Without knowledge on previous conditions, our understanding of current conditions is compromised, especially through a "shifting baselines syndrome": as each generation of scientists/managers/users tends to accept as a baseline the ecosystem state at the beginning of their careers and use it to evaluate changes, through generations there is a gradual shift of the baseline leading to use of inappropriate reference points (Pauly 1995). This phenomenon leads to false perceptions about fish communities’ status (e.g. composition, assemblage structure) namely underestimated or unrecorded changes (Lozano-Montes et al. 2008), leading to insufficient and/or inadequate management targets (Pauly 1995). Countries from the European Union (EU) have been assessing Mediterranean fish stocks in the last 40 years (Colloca et al. 2013), and a more continuous and improved fisheries management started in the 1990s through the General Fisheries Commission for the Mediterranean (GFCM; Oliver,
INTRODUCTION
6
2002). However, reference points in the Mediterranean countries are almost inexistent and non-consensual (Cardinale et al. 2013, Boyes et al. 2015), due to short time data series (20 years), to the establishment of references after overfishing of stocks, and to inconsistent techniques (Fromentin & Powers 2005).
Assessment of fish populations can use fisheries-dependent data (such as landings and logbooks information) or fisheries-independent data (like research surveys) on species catch per unit effort (CPUE), size, age distribution (Cooper 2006). With this information, stock assessment models can be used to estimate for instance catch, size and age composition, and other techniques can be used to estimate changes in populations and ecosystems (Abaunza et al. 2003, Sondre 2003, Cadrin & Dickey-Collas 2015). But in many countries, especially developing ones, there are important data deficiencies (Hoggarth et al. 2006). In these cases, local ecology knowledge (LEK) or traditional ecology knowledge (TEL) especially from fishers (Rasalato et al. 2010) can be useful for assessments (Bunce et al. 2008, Bender et al. 2013). Fishers' empirical knowledge of the environment and fish ecology can provide crucial information about the status of fishing stocks and ecosystems conditions in past decades (Ferguson et al. 1998, Huntington 2000, Moller & Berkes 2004, Johannes et al. 2008). Additionally, historical ecology uses past records such as fishers logbooks, catches or exportations to estimate previous distribution or abundance of fish stocks, although these data can be sporadic and not representative of the ocean in the past (Lotze & Worm 2009).
In this study, fishers’ interviews were done in an artisanal fishing community in the region of Murcia to explore shifting baselines phenomenon and understand how fishers perceive the changes of fish since 1970 on the south-western Mediterranean Sea where long-time series are scarce. This work aims to assess the trends of fish populations and fishing effort in a long data series period (1970 to 2016), by reconstructing past decades based on fishers’ perception, while identifying if a shifting baseline phenomenon is occurring in the coast of Murcia. This approach will improve the understanding and establishment of baselines for fish populations, especially in data-poor contexts.
MATERIAL AND METHODS
Material and Methods
Study area
The present study was conducted in South-eastern Spain in the Murcia region (Fig. 1), i.e. Balearic marine region of the Food and Agriculture Organisation (FAO 2004) and south-western Mediterranean and Alboran Sea of the marine ecoregions of the world (Spalding et al. 2007). This area is characterized by a short continental shelf except for the Cabo de Palos – San Pedro del Pinatar coast that comprehends 10 km of shelf. This coast line is influenced by the large scale deep water current, parallel to the coastline from North towards South and intense mesoscale phenomenon’s like gyres and mid-sea eddies (Robinson et al. 2001). As a Mediterranean temperate realm, this habitat is characterized by rocky or detritus bottoms and Posidonia oceanica beds, harbouring a high biodiversity and habitat variety (García-Charton et al. 2015).
In 1995, Cabo de Palos – Islas Hormigas marine reserve was established with the goal of protecting the marine communities and human populations that depend on local fisheries (Consejero de Agricultura Ganadería y Pesca 1995). In this area, shallower bottoms harbour rocky boulders of various sizes interspersed with Posidonia oceanica meadows forming a narrow belt following the coast, while at deepest portions (>20 m), detritic formations predominate, after which a series of steep rocky shoals and small islands are aligned seawards from the cape to the north-east, where photophilous, pre-coralligenous and pre-coralligenous (mainly gorgonians) present a very good development (García-Charton et al. 2010). The area (1831 ha) is established between San Pedro del Pinatar and Cartagena and has a no-take zone (where all activities are forbidden except scientific research and monitoring) and a buffer area, where some artisanal fisheries and commercial SCUBA diving are regulated (García-Charton et al. 2010).
The fishing activity in the Murcia region is mainly composed of artisanal fisheries, bottom trawlers and purse seine that predominantly target large pelagic species (Coll et al. 2015). In 2015, the number of fishing vessels in Murcia was 188 with an average power of 109 kW and 70% of the boats have less then 10 meters length (Ministerio de agricultura y pesca 2016). The local fishing activity has been decreasing through the last decades and fish landings have reduced from 2.000.000 tons in 1985 to below 1.500.000 tons in 2010 (Coll et al. 2015).
MATERIAL AND METHODS
8
Figure 1. Map of the coast of the Murcia region with sampling ports (North to South: San Pedro del Pinatar, Cartagena, Mazarron, Águilas) in the context of the Mediterranean Sea (upper left corner) and the zoom section of the Cabo de Palos – Islas Hormigas marine reserve (lower right corner).
Sampling method
Sampling was made in the main fishing ports in the region: San Pedro del Pinatar, Cartagena, Mazarrón and Águilas. We interviewed artisanal fishers with no regard to their age through a snowball sampling procedure which consists of asking the last interviewed person where to find the next person to survey (Goodman 1961). The questionnaire was subdivided into six chapters, namely on: personal information, boat information, perception of baselines, climate change, fishing effort and by-catch of seabirds (Appendix I).
Regarding the perception of baselines, we asked fishers: to rate how did fish abundance change from the 1970s to present (2016) throughout decades (with abundance of each taxon from 5 – always caught in large amounts to 0 – never caught). We also asked what was the main fishing gear used, the largest total catch (in kg) in a fishing day, and the largest single specimen caught for each taxon (in m). We also asked where are their main fishing grounds and if they changed through time (Appendix I).
All information given by the fishers was treated anonymously and is protected under the organic law 15/1999 from 13 December about Personal Data Protection in Spain. No question in the questionnaire was mandatory and all the participants had to sign a form to validate the data.
Functional trait classification
For each taxon (n=31) reported by the fishers in the interviews, we characterized a set of nine traits, to describe their features that determine the way they use the habitats aiming at identifying relations to local fisheries practices (Table 1; Appendix II). We retrieved traits from online databases (e.g. Fishbase, Food and Agriculture Organization - FAO - worksheets) complemented with published scientific literature.
We characterized the maximum reported length (i.e. small, medium, large and very large), the depth range occupied (i.e. shallow, medium, deep, broad), habitat (i.e. pelagic, demersal, benthic) and diet (i.e. omnivore, planktonivore, invertebrate feeder, macrocarnivore; Table 1). We also characterized traits describing behaviour, namely schooling behaviour (i.e. solitary, facultative schooler, schooler; where mating pairs were considered solitary) and territoriality (i.e. territorial and non-territorial). In addition,
MATERIAL AND METHODS
we characterized traits related to species movement, namely their yearly displacement (i.e. small, medium, large) and daily mobility (i.e. sedentary, vagile and very vagile). All species traits were characterized in an adult stage (Table 1).
Finally, we described whether the species had direct economic value in fisheries in that region (i.e. commercial and non-commercial). Although this is not a functional trait, targeted species are more subjected to fishing activity and thus to being reported by fishers.
Table 1. Functional traits and respective categories, description and specific relevance.
Trait Category Description Relevance
Maximum body size
Small < 20 cm Reflects the position of the species in the food web, species abundance and metabolic rates. Trait categories adapted from Claudet et al. 2010, Henriques et al. 2017. Medium 20 - 60 cm Large 60 - 100 cm Very large > 100 cm Maximum depth
Shallow < 50 m Indicator of the physical pressure and temperature of the different depths. Used to describe habitat. Trait categories adapted from Henriques et al. 2017.
Medium 50 - 200 m Deep 200 - 500 m Very deep > 500 m
Habitat Pelagic Depends on the upper layers of the water column
Indicates the main habitat of which the species uses and depends on (Claudet et al. 2010).
Demersal Strongly depends on the ocean bottom (to feed or protection) but swims freely in the water column Benthic Lives and depends on the ocean
bottom (exclusive benthic) Diet Omnivore Feeds on detritus (≥25%),
macroalgae (≥25%) and epi and infauna
Reflects the position of the species in the food web, the influence on other species and their habitat. Trait categories adapted from Henriques et al. 2017.
Planktonivore Feeds on planktonic invertebrates Invertebrate
feeder
Feeds predominantly on non-planktonic invertebrates (≥ 50 % weight)
Macrocarnivore Feeds on both fish and medium-large invertebrates (≥ 50% weight)
MATERIAL AND METHODS
10
Table. 1 (continued)
Trait Category Description Relevance
Schooling behaviour (> 2 individuals)
Solitary Fish that are nearly always solitary
Reflects the species density per area in response to protection, food search efficiency (Pitcher 1986) and likelihood for fishing in large quantities. Trait categories adapted from Claudet et al. 2010.
Facultative schooler
Fish that can be seen in school aggregations
Obligate schoolers
Fish that are always in schools
Territoriality Territorial Territorial species Indicates the protection range of the species, aggressiveness and small scale mobility. Trait categories adapted from Claudet et al. 2010.
Non-territorial Non-territorial species
Yearly displacement
Small < 100 m Relates to the mesoscale
distribution of the species and their large-scale mobility capacity. Trait categories adapted from Claudet et al. 2010.
Medium 100 - 10000 m Large > 10000 m
Mobility Sedentary Swims <50% of the time Reflects the behaviour and agility of the species in the water column. Trait categories adapted from Claudet et al. 2010.
Vagile Swims ≥50% of the time Very vagile Almost always swimming Commercial or
bycatch value
Commercial Commercial species Reflects the commercial value of the species and evaluates the importance of each species to fisheries. Trait categories adapted from Claudet et al. 2010.
Non-commercial
Non-commercial species
Fishers reported mostly fish, but also identified other species/groups of species of crustaceans and molluscs (Sepia officinalis, Octopus vulgaris, Palinurus sp., Hommarus gammarus, Teuthida and Palaemon sp.) which were treated in the same manner in our study. Some of the taxa could not be resolved at species-level (Scorpaenidae, Teuthida, Epinephilinae, Palinurus sp., Thunnus sp. and Palaemon sp.).
The further identification of some groups (Scorpaenidae, Teuthida, Epinephelus sp., Palinurus sp., Thunnus sp. and Palaemon sp.) was not possible. Missing information for the diet of Scorpaenidae family was complemented with information of Scorpaena porcus and Scorpaena notata since they are a common species of this family in the Mediterranean (Morte et al. 2001). The same procedure was done for the Teuthida order which was complemented with information of Loligo vulgaris, the genus Epinephelus sp. with the Epinephelus marginatus, Palinurus sp. with Palinurus elephas, Thunnus sp. with Thunnus thynnus and Palaemon sp. with Palaemon serratus. The species used to complete the traits were chosen because of their abundant in the Mediterranean and/or commercial value for fisheries.
MATERIAL AND METHODS
Data analysis
We ran one-way and two-way PERMANOVA tests, using raw data of abundance scores (with all specimens together), testing the null hypothesis of no difference between groups (Anderson 2001). We considered the factors: decades, class decades (1970-1990 and 2000-2016; since these two periods were significantly different according to the PERMANOVA test), port, age [through raw age, 2 level (23-55; 56-82) and 3 level (23-44; 45-57; 58-82) class age]. In the two-way PERMANOVA, the factors used were: ports; age, 2 level class age, 3 level class age; decades, class decades; and all interactions between them. We used confidence interval of 95% (P < 0.05), Euclidean distances and 9999 permutations. Subsequently we used pairwise tests (P < 0.05) with no P-value adjustment to explore the identified differences. As PERMANOVA is sensitive to differences in multivariate dispersion, we first test the homogeneity of multivariate dispersion of the data using a PERMDISP routine (Anderson et al. 2008). The PERMANOVA procedure between class decades was repeated to analyze differences of individual species and functional traits between class decades and ports.
To evaluate the taxa which contributed most to differentiate class decades we implemented a similarity percentage procedure (SIMPER) in a presence/absence matrix - since the raw data had high number of missing values and this procedure was not possible.
For all data analysis, we used R software (R Core Team 2015) version 3.2.3 for restructuring and arrange data (packages tidyr and reshape2; Wickham 2007, 2017) and PERMANOVA analysis (package vegan; Oksanen et al. 2016).
RESULTS
Results
Concerning the catch reported by decades, or dividing the time between two class decades (before 90's and after 2000's), according to most fishers, the abundance of fish declined in time with the most evident change before 1990's and after 2000's (Fig. 2 and 3). PERMANOVA and pair-wise tests showed that decades before 2000 are significantly different from those including and after 2000 (Tables 2 and 3). In addition, the 2000 decade was also significantly different from the subsequent decades. In all, this identifies a breakpoint in abundance between years 1990 and 2000.
Figure 2. Boxplot of fishers scores to taxa catches in the Mediterranean throughout the last decades (1970 to 2016) and the respective sample size (n is the number of times a species is referred by a fisher in a total of 40 interviews) of each year. Different letters represent significantly different decades (for P < 0.05).
Figure 3. Boxplot of fishers scores to taxa catches in the Mediterranean between the two class decades (1970 to 1990 and 2000 to 2016) and the respective sample size (n is the number of times a species is referred by a fisher in a total of 40 interviews) of each class. Different letters represent significantly different decades (for P < 0.05).
RESULTS
14
Table 2. Results of PERMANOVA analysis of the Euclidean dissimilarities of the fisher’s abundance score in decade capture (1970 to 2016) and class decade (1970 to 1990 and 2000 to 2016); Df = degrees of freedom; Pseudo-F = F value by permutation. Bold indicates statistical significance (P < 0.05); P-values are based on 9999 permutations.
Df Pseudo-F P-value
Decade capture 5 26.271 0.001
Class decade 1 124.560 0.001
Table 3. Results of pairwise tests of the fisher’s abundance score between year captures from 1970 to 2016 of the Mediterranean. Table shows P-values for the different tests; ns = non-significant P-values at P < 0.05.
1970 1980 1990 2000 2010 1980 ns - - - - 1990 ns ns - - - 2000 <0.001 <0.001 <0.001 - - 2010 <0.001 <0.001 <0.001 0.028 - 2016 <0.001 <0.001 <0.001 0.036 ns
Concerning ports, San Pedro del Pinatar has higher scores compared to the rest of the ports (Fig. 4). PERMANOVA analysis shows that fishing ports are statistically different (P-value = 0.0001) and pairwise tests showed that San Pedro is significantly different from Águilas and Mazarrón but not Cartagena (Table 4).
RESULTS
Figure 4. Boxplot of fishers’ abundance scores for abundance according to each port (Águilas, Mazarrón, Cartagena and San Pedro del Pinatar) of the Mediterranean region and the respective sample size (n is the number of times a species is referred by a fisher in a total of 40 interviews). The locations are ordered geographically (from South to North). Different letters represent the groups formed by the post-hoc pairwise comparison (for P < 0.05).
Table 4. Results of pairwise tests of fisher’s abundance scores between the Mediterranean ports of Águilas, Mazarrón, Cartagena and San Pedro del Pinatar. Table shows P-values for the different tests; ns = non-significant P-values at P < 0.05.
Águilas Cartagena Mazarrón
Cartagena ns - -
Mazarrón ns ns -
San Pedro <0.0001 ns 0.0210
The age of fishers had a significant effect on scores of abundances, with no effect of 2 level class age and a marginal effect of 3 level age class (Table 5) observed between classes “young” and “adult” (Pairwise: p = 0.028; p < 0.05).
RESULTS
16
Table 5. Results of PERMANOVA analysis of dissimilarities (Euclidean) of fisher’s abundance score for age, and 2 (young and old) and 3 level (young, adult and old) class age; Df = degrees of freedom; Pseudo-F = F value by permutation. Bold indicates statistical significance (P < 0.05); P-values are based on 9999 permutations.
Df Pseudo-F P-value
Age 26 2.9542 0.001
2 level class age 1 0.5910 0.461
3 level class age 2 2.4617 0.085
Among the two-way PERMANOVA tests performed (Table 6), only three interactions were significant: Class decade x Port, Decade x Port, and Class Decade X Age.
Table. 6 Results of two-way PERMANOVA analysis of the Euclidean dissimilarities for the fishers’ abundance scores between each variable (decade, class decade, age, 2 and 3 level class age, and port). Df = degrees of freedom; Pseudo-F = F value by permutation; ns = non-significant. Statistical significance (P < 0.05); P-values are based on 9999 permutations.
Df Pseudo-F P-value
Decade X age 93 0.6967 0.986
Decade X 2 class age 5 0.1815 0.968
Decade X 3 class age 9 0.5667 0.829
Decade X port 15 2.2393 0.005
Class decade X age 20 2.2841 0.001
Class decade X 2 class age 1 0.9503 0.333
Class decade X 3 class age 2 1.7325 0.175
Class decade X port 3 10.033 0.001
Age X port 6 0.9617 0.447
2 lvl class age X port 3 1.4939 0.213
3 lvl class age X port 5 1.1428 0.339
Although scores decreased significantly through time in each of the four ports, the significant interactions of Class Decade X Port (Fig. 5; Table 7) and Decade X Port (results not shown) indicate that this decrease was more pronounced in Águilas (since abundance scores in Águilas in 2000-2016 is different from any other port; Table 8).
RESULTS
Figure 5. Boxplot of fishers scores between port (Águilas, Mazarrón, Cartagena and San Pedro del Pinatar) in each class decade (1970 to 1990 and 2000 to 2016).
RESULTS
18
Table 7. Respective sample sizes (n) for the boxplots of class decade (1970 to 1990 and 2000 to 2016) and port (Águilas, Cartagena, Mazarrón and San Pedro del Pinatar).
Águilas Cartagena Mazarrón San Pedro
1970 – 1990 212 85 46 161
2000 - 2016 267 100 87 303
Table 8. Pairwise tests of the different interactions between ports (Águilas, Mazarrón, Cartagena and San Pedro del Pinatar) and class decade (1970 to 1990 and 2000 to 2016). Statistical significance (P < 0.05).
Águilas 70.90 Águilas 00.16 Mazarrón 70.90 Mazarrón 00.16 Cartagena 70.90 Cartagena 00.16 San Pedro 70.90 Águilas 00.16 <0.0001 - - - - Mazarrón 70.90 ns <0.0001 - - - - - Mazarrón 00.16 <0.0001 0.0420 <0.0001 - - - - Cartagena 70.90 ns <0.0001 ns 0.0013 - - - Cartagena 00.16 <0.0001 0.0054 0.0016 ns 0.0240 - - San Pedro 70.90 ns <0.0001 ns <0.0001 0.0290 <0.0001 - San Pedro 00.16 <0.0001 <0.0001 0.0170 0.0110 ns ns <0.0001
Abundance scores varied with Age and 3-level Class Age (one-way PERMANOVA), and there was a significant interaction between Class Decade X Age (results not shown) but with no apparent trend observed.
According to the fishers’ abundance scores, between the classes of 1970-1990 and 2000-2016 only Zeus faber (3.3% of all reported taxa) increased (Fig. 6). Most species (23 species, 76.7%) were identified by fishers as decreasing through time (Fig. 7). Some of these species (Octopus vulgaris, Merluccius merluccius and Polyprion americanus) decreased in a more evident manner (decreased in average two score points, and were reported by fishers at least five times per period). Only six species (20%) were reported by fishers as unchanged along the years (Fig. 8). Among these, Diplodus sargus was reported by a higher number of fishers. Hommarus gammarus was removed from this section due to not having entries for the class decade 1970 – 1990 and only 1 sample for the 2000 – 2016 period (n=1).
RESULTS
Figure 6. Boxplots of Zeus faber fishers scores over the two classes of time (1970 to 1990 and 2000 to 2016) of increase abundance and the respective sample size (n is the number of times a species is referred by a fisher in a total of 40 interviews).
a) Sarda sarda b) Seriola dumerili
c) Sepia officinalis d) Octopus vulgaris*
e) Sparus aurata f) Epinephelus sp.
Figure 7. Boxplots of fishers’ abundance scores during the two classes of time (1970 to 1990 and 2000 to 2016) for species that decreased in abundance and the respective sample size (n is the number of times a species is referred by a fisher in a total of 40 interviews). * species that have a strong decrease (change in 2 or more score points for species with n > 5).
RESULTS
20
g) Scorpaenidae h) Sciaena umbra
i) Dentex dentex j) Aphia minuta
k) Loliginidae l) Argyrosomus regius
m) Auxis rochei n) Merluccius merluccius*
o) Thunnus sp. p) Pagellus bogaraveo
RESULTS
q) Pagrus pagrus r) Boops boops
s) Squaliformes t) Palaemon sp.
u) Polyprion americanus* v) Mullus surmuletus
w) Euthynnus alletteratus
RESULTS
22
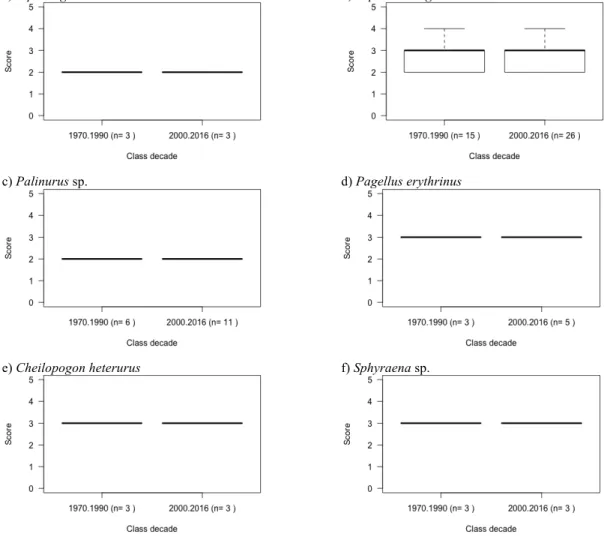
a) Xiphias gladius b) Diplodus sargus
c) Palinurus sp. d) Pagellus erythrinus
e) Cheilopogon heterurus f) Sphyraena sp.
Figure 8. Boxplots of fishers’ abundance scores during two classes of time (1970 to 1990 and 2000 to 2016) for species stable in abundance and the respective sample size (n is the number of times a species is referred by a fisher in a total of 40 interviews) for each class.
The SIMPER analysis shows that four species/groups of species (Sepia officinalis, Auxis rochei, Scorpaenidae and Aphia minuta) explain approximately 30% of the differences between the 1970 – 1990 and 2000 – 2016 decades (Table 9). These species/group of species were highlighted in the analysis because they had larger total sample sizes (n) and larger differences of sample size between class decades. Accordingly, most species of the “unchanged” group have low sample size (n) and the difference of n between class decades barely changes, therefore are in the bottom of the SIMPER analysis.
RESULTS
Table 9. SIMPER analysis of species that explain the dissimilarity of presence/absence between the class decade 1970 – 1990 and 2000 – 2016. The average dissimilarity of each species and the cumulative dissimilarity are represented in percentages.
Species / group of species Average dissimilarity (%) Cumulative dissimilarity (%)
Sepia officinalis 0.07888 0.07888 Auxis rochei 0.07887 0.15775 Scorpaenidae 0.07616 0.23391 Aphia minuta 0.07177 0.30568 Epinephelus sp. 0.06741 0.37309 Mullus surmuletus 0.06670 0.43979 Sarda sarda 0.06378 0.50357 Loliginidae 0.05892 0.56249 Octopus vulgaris 0.05077 0.61326 Diplodus sargus 0.04762 0.66088 Dentex dentex 0.04422 0.70510 Thunnus sp. 0.04391 0.74901 Euthynnus alletteratus 0.04386 0.79287 Merluccius merluccius 0.02521 0.81808 Palinurus sp. 0.02362 0.84170 Zeus faber 0.01716 0.85886 Polyprion americanus 0.01418 0.87304 Seriola dumerili 0.01369 0.88673 Sparus aurata 0.01257 0.89930 Argyrosomus regius 0.01171 0.91101 Pagellus erythrinus 0.01148 0.92249 Palaemon sp. 0.01094 0.93343 Sciaena umbra 0.01090 0.94433 Xiphias gladius 0.01087 0.95520 Cheilopogon heterurus 0.01005 0.96525 Sphyraena sp. 0.00865 0.97390 Pagellus bogaraveo 0.00574 0.97964 Squaliformes 0.00573 0.98537 Pagrus pagrus 0.00574 0.99111 Boops boops 0.00535 0.99646 Homarus gammarus 0.00354 1.00000
RESULTS
24
The PERMANOVA analysis (Table 10: Class decade) showed that the majority (92%) of traits had a significant change between the class decades of 1970 – 1990 and 2000 – 2016. The shallow (depth trait) and omnivore (diet trait) categories showed no significant change between decades. The intensity between the trend of the different traits categories (Table 10: Average Score) also varied, with 21% of slight decrease, 62% moderate decrease and 17% with a severe decrease between decades. According to fishers, fish from very deep waters, benthic habitats, make small yearly migrations or that feed on invertebrate feeders decreased the most between past decades and more recent ones.
Table 10. Results of PERMANOVA analysis of fishers’ abundance score of each trait between class decades (1970-1990 and 20002016) and the respectively average score trend ( = slight decrease [0.409; 0.584], = moderate decrease [0.584: -0.759], --- = severe decrease [-0.759: -0.935]) and variation. Df = degrees of freedom; Pseudo-F = F value by permutation. Bold indicates statistical significance (P < 0.05); P-values are based on 9999 permutations.
Class decade Average score
Trait Category Df Pseudo-F P-Value 1970 - 1990 2000 - 2016
Trend (variation) Size Small 1 15.929 0.001 2.868 2.182 -- (- 0.686) Medium 1 60.747 0.001 3.272 2.674 -- (- 0.598) Large 1 24.651 0.001 3.408 2.910 - (- 0.498) Very large 1 45.345 0.001 3.208 2.480 -- (- 0.728) Depth Shallow 1 0.0059 1.000 ns ns ns Medium 1 71.747 0.001 3.272 2.674 -- (- 0.598) Deep 1 44.109 0.001 3.291 2.573 -- (- 0.718) Very deep 1 24.689 0.001 2.983 2.163 --- (- 0.820) Habitat Pelagic 1 94.622 0.001 3.532 2.910 -- (- 0.622) Demersal 1 46.869 0.001 3.064 2.475 -- (- 0.589) Benthic 1 26.636 0.001 2.472 1.671 --- (- 0.801) Schooling Schooler 1 70.300 0.001 3.372 2.730 -- (- 0.642) Facultative schooler 1 68.339 0.001 2.862 2.453 - (- 0.409) Solitary 1 60.255 0.001 3.225 2.556 -- (- 0.669) Migration Large 1 107.810 0.001 3.409 2.783 -- (- 0.626) Medium 1 24.181 0.001 3.012 2.489 - (- 0.523) Small 1 28.227 0.001 2.532 1.597 --- (- 0.935) Territorial behaviour Territorial 1 38.995 0.001 2.836 2.179 -- (- 0.657) Non-territorial 1 109.380 0.001 3.403 2.792 -- (- 0.611) Mobility Very vagile 1 98.910 0.001 3.550 2.918 -- (- 0.632) Vagile 1 37.416 0.001 2.810 2.226 -- (- 0.584) Sedentary 1 27.574 0.001 3.130 2.429 -- (- 0.701) Diet Omnivore 1 2.910 0.118 ns ns ns Planktonivore 1 16.201 0.001 2.882 2.310 - (- 0.572) Invertebrate feeder 1 17.098 0.001 3.414 2.561 --- (- 0.853) Macrocarnivore 1 103.980 0.001 3.278 2.669 -- (- 0.609)
RESULTS
The overall pairwise test results (Tables 11 and 12) showed a significant dissimilarity (76.47%) of the trait categories between Águilas and San Pedro del Pinatar ports which are the two farthest fishing ports and showed differences in many trait categories. San Pedro del Pinatar and Cartagena showed the highest scores in the following traits: very large size, deep maximum depth, solitary behaviour, large distances yearly displacement, very vagile mobility and macrocarnivore diet.
Table 11. Results of PERMANOVA analysis of the Euclidean dissimilarities of the fisher’s abundance score of each trait and category between the different ports (San Pedro del Pinatar, Cartagena, Mazarrón and Águilas) and the respectively average score and pairwise dissimilarity represented with letters (i.e. (a) is statistical different to (b) or (c) but not (a) or (ab)). Df = degrees of freedom; Pseudo-F = F value by permutation. Bold indicates statistical significance (P < 0.05); P-values are based on 9999 permutations.
Port Average port score
Trait Category Df Pseudo-F P-value
San Pedro
del Pinatar Cartagena Mazarrón Águilas
Size Small 3 1.803 0.149 - - - -
Medium 3 2.796 0.040 3.053 (a) 2.909 (ab) 2.972 (ab) 2.795 (b)
Large 3 2.548 0.058 - - - -
Very large 3 11.283 0.001 3.012 (a) 3.032 (a) 2.712 (ab) 2.416 (b) Depth Shallow 2 7.146 0.002 3.000 (a) 2.500 (b) - 2.000 (b)
Medium 2 0.122 0.943 - - - -
Deep 2 6.819 0.003 3.176 (a) 3.020 (ab) 2.767 (ab) 2.612 (b)
Very deep 2 1.035 0.375 - - - -
Habitat Pelagic 3 0.452 0.725 - - - -
Demersal 3 14.495 0.001 3.036 (a) 2.500 (b) 2.562 (b) 2.441 (b) Benthic 3 2.750 0.043 2.156 (a) 1.500 (a) 1.700 (a) 2.089 (a)
Schooling Schooler 3 0.457 0.720 - - - -
Facultative schooler
3 3.841 0.011 2.798 (a) 2.467 (ab) 2.444 (ab) 2.267 (b)
Solitary 3 7.743 0.002 3.066 (a) 2.873 (ab) 2.667 (ab) 2.609 (b) Migration Small 3 3.31 0.024 2.226 (a) 1.250 (b) 1.700 (ab) 2.089 (a) Medium 3 4.761 0.004 2.734 (a) 2.297 (b) 2.593 (ab) 2.923 (a) Large 3 12.816 0.001 3.210 (a) 3.218 (a) 3.046 (ab) 2.804 (b) Territorial
behaviour
Territorial 3 10.975 0.001 2.774 (a) 1.833 (b) 2.136 (bc) 2.324 (bc)
Non-territorial 3 1.996 0.109 - - - -
Mobility Very vagile 3 5.788 0.001 3.314 (a) 3.297 (a) 3.176 (ab) 3.009 (b) Vagile 3 17.726 0.001 2.829 (a) 2.245 (b) 2.289 (b) 2.089 (b) Sedentary 3 4.429 0.004 2.600 (ab) 2.222 (b) 2.500 (ab) 2.950 (a) Diet Omnivore 3 4.916 0.011 2.689 (a) 2.000 (b) - 2.000 (b)
Planktonivore 3 0.943 0.428 - - - -
Invertebrate feeder
3 2.063 0.113 - - - -
RESULTS
26
Table 12. Summary of the dissimilarity pairwise test results between the different traits (size, maximum depth, habitat, schooling behaviour, yearly displacement, territorial behaviour, mobility, diet) and ports (Águilas Cartagena, Mazarrón and San Pedro). Percentages represent overall dissimilarity and respective the sample size (n).
San Pedro del Pinatar Cartagena Mazarrón Águilas San Pedro del
Pinatar - - - -
Cartagena 41.17% (17) - - -
Mazarón 20.00% (15) 0.00% (17) - -