EXPLAINING DEMAND FOR HIGHER EDUCATION
Manuela Oliveira
1, Carlos Vieira
2, Isabel Vieira
21
CIMA – Universidade de Évora (PORTUGAL)
2CEFAGE – Universidade de Évora (PORTUGAL)
mmo@uevora.pt, cvieira@uevora.pt, impvv@uevora.pt
Abstract
Recognising the crucial role of higher education for the development of nations and individuals, many countries have recently established ambitious targets for the percentage of graduates in their population by 2020. In peripheral European Union countries, however, such objectives may be difficult to attain. In fact, both the current stringent fiscal consolidation processes and the overall depressed economic environment may exert negative effects upon domestic demand for higher education. Such uncertain context increases the need for efficient policies and henceforth the value of obtaining reliable information on the variables that are more likely to influence demand. In this study, we employ the partial least squares methodology, which allows modelling with many variables, even with relatively few observations, to identify the most relevant determinants of demand for higher education. We focus in the case of Portugal, a country where applications for higher education are centralised and thus provides a long and reliable set of data on aggregate demand. The results of our empirical analysis suggest that the most relevant determinants of demand are institutional and/or policy dependent and, therefore, may be controlled by decision makers and managed to support national strategic objectives. These results, obtained for Portugal, are also useful particularly for other southern European Union countries, which share some of the Portuguese economic, social, demographic and cultural characteristics.
Keywords: Demand for higher education, enrolments, partial least squares.
1 INTRODUCTION
Research suggests that high levels of participation in higher education promote economic and social development. At the individual level, more education is also commonly viewed as a source of personal improvement and a means to attaining a better remunerated and more fulfilling professional life. Recognition of the relevance of tertiary education for competitiveness, in the knowledge based global economy, led many countries to establish ambitious goals for 2020. For example, the United States (US) aim at becoming the country with the highest proportion of 25-34 year old university graduates, the European Union (EU) has the objective of increasing the percentage of 30-34 year-olds with complete tertiary education by at least 40% in each member country, and China’s objective is for 20% of its population to have a higher education degree [1].
The peripheral EU countries may find the 2020 goal very difficult, if not impossible, to attain. Notwithstanding the strategic importance of increasing domestic ‘talent pools’, the current context of economic crisis, budgetary contingency and high unemployment may exert conflicting effects upon domestic demands for higher education. The decision to continue studying after secondary school generally postpones entry in the job market for a few years. Therefore, the objective of increasing the number of graduates requires that personal and societal preferences favor tertiary education and that enough resources are available to support such inclination. With constant pressures to reduce government budget deficits and debts and unprecedented cuts on families’ incomes, financing higher education is a challenging task. High rates of youth and graduate unemployment and the recent attempts of regaining competitiveness by cutting salaries are also sending mixed signals to young people of university age. On the one hand, prolonging education may be a good option when it is difficult to find a job. On the other hand, the perspective of spending three or four years in a higher education institution may seem less appealing with a shrinking wage premium.
The current uncertain circumstances increase the utility of studies that investigate demand for higher education, its main determinants and the nature of their impact on the personal decision making process. Such knowledge may help institutions manage scarce resources and may also improve the efficiency of policy measures designed to sustain, or increase, demand for higher education in countries more seriously disturbed by the current economic conditions.
Previous analyses of demand for higher education were mostly focused on individual institutions and assessed groups of students already enrolled in higher education. However, demand for higher education is not well represented by data on institutions’ enrolments. Demand encompasses all individuals wanting to enter an institution, and not solely those that have managed to do so. The reason for the institutional focus of previous studies is probably the lack of nationwide data, as in most countries prospective students apply directly to the institutions of their choice.
In Portugal, for many years now, prospective students have been allocated to higher education by means of a national scale contest. This makes the country especially adequate for studies investigating demand for higher education due to the availability of a large and reliable set of data on applications. The latter provide information on all individuals aiming to enter higher education, allowing a more accurate picture of demand than that obtained with data on enrollments. Furthermore, the use of applications is vital in cases where the supply of university places is smaller than the demand for them, as in such cases enrollments depict supply rather than demand.
In this study, we investigate demand for higher education in Portugal, from 1977 to 2010. We use data from the national centralized system of applications and adopt the concept of aggregate demand as the summing up of all individual applications registered in the system. Modeling aggregate demand is a complex task because it is subject to many macro and micro influences but, unlike other similar assessments, we do not make an a priori choice of the variables apt to be more relevant. Instead, we adopt the partial least squares (PLS) methodology, which is robust in modeling complex scenarios, where many variables are involved, even when there are relatively few observations available. The PLS technique allows an exploratory analysis that identifies the more relevant determinants of demand and then evaluates each variable contribution to explain the behavior of demand.
Our study contributes to the literature on higher education in various ways. Firstly, it allows an effective study of demand, and not only of some of its segments as is the case with studies assessing groups of enrolled students in specific higher education institutions; secondly, it employs a robust methodology, the PLS technique, not previously used in this context, to explore a vast set of economic, social and demographic variables, without making previous assumptions on their importance for the subject under examination; thirdly, though the study focus on Portugal, our results may be useful for decision makers in other European countries, especially those in the EU periphery, who share with Portugal many economic, social and cultural characteristics and currently undergo the same process of budgetary consolidation and economic contraction; finally, this study provides updated information on open questions in this area of research, such as the effect of recession and unemployment in demand for higher education.
The remaining of the analysis is organized as follows: section 2 surveys the relevant literature on demand for higher education; section 3 introduces the adopted methodology and discusses its relevance for the empirical analysis developed in section 4; section 5 concludes and debates the institutional and policy implications of identified determinants of demand for higher education.
2 LITERATURE REVIEW
Demand for higher education has been extensively studied since the publication of Campbell and Siegel’s study of enrolments in the US [2]. From this seminal work, a prolific and diverse literature developed. We briefly survey the most relevant studies, sorting them out in terms of scope, motivation, focus and methodological approaches.
Some studies of demand estimated national or regional demand functions, to address funding issues or the optimal number and geographical dispersion of institutions. Most were focused on the US (for instance, [3]; [4]; or [5]), but other countries have also been examined. Examples are Australia ([6]), Greece ([7]), Belgium ([8]), or Canada ([9]). Other studies assessed demand for a particular institution, investigating what motivates or inhibits students to favor one university, and are useful tools for institutional strategic planning (e.g., on the US, [10]; [11]; and [12]). A few analyses have also identified demand for a specific scientific area (e.g. [13]), either to adjust supply or to induce demand towards key strategic areas.
A number of studies, mainly motivated by particular social concerns, examined equity of access and participation in higher education. Focusing on the US, McPherson and Schapiro [5] and Buss et al. [12] analyzed some aspects of potential economic discrimination, such as household income, student aid, tuition and other costs. Social discrimination, either in class, gender or ethnicity was studied by
evaluated geographical discrimination in the Netherlands, namely due to travel and accommodation costs [16].
A separate distinction may also be drawn between student choice and student demand models. While the latter approach employs aggregate data (examples include [10]; or [8], the former, more frequent, focuses on the individual, using large longitudinal survey data and logistic regression techniques (see [5]; [11]; and [9], among others). The latter approach, adopted in our study, is more adequate to examine effects which can only be picked up over long periods.
Finally, most papers tested hypotheses of demand behavior but very few attempted to go a step further and presented enrolment projections. Some decades ago, Hoenack and Weiler [10] and Ahlburg et al. [17] produced such projections for the US, based on econometric models. More recently, also for the US, Murdoch and Hoque [18] used a simple extrapolation of trends, exclusively focusing on demographic factors, to project enrolments.
The approach in this paper differs in several aspects. We estimate an aggregate model of demand for higher education with the number of applicants divided by the number of 18 year olds as the dependent variable. Though enrolments are typically used in this type of empirical studies, applications avoid some common conceptual and methodological problems. Data on applicants comprise information on all individuals wishing to attend higher education, rather than solely on those having their wishes fulfilled, that is, those who actually enrolled in an institution. This is especially relevant in higher education systems that restrict the number of available places, for in such cases enrolments provide a more clear depiction of supply than of demand. Furthermore, unlike total enrolments, applications are not directly dependent on the duration of study programmes. The reduction of programmes’ length, for instance following the adoption of the Bologna guidelines, may lead to a decrease of total enrolments, even if demand increases or remains unchanged.
The use of applications to proxy demand as the dependent variable in the model is thus an important contribution of this paper to the literature on demand for higher education. A second contribution is the wide range of explanatory variables included in the model, comprising demographic, economic, social and institutional factors. Finally, the model allows the analysis of the initial impact of the Bologna process upon aggregate demand.
3 METHODOLOGY
The theoretical and empirical literature suggests that a large number of demographic, social, economic and institutional variables may exert an influence upon demand for higher education. However, due to degrees of freedom limitations, empirical analyses do not consider a large set of possible demand determinants. Some a priori selection has to be done beforehand, but an ad hoc choice of a small set of variables is probably not the most adequate research option. To avoid such problem, we adopt a methodology that is robust for estimation with a large number of explanatory variables, even when the number of observations is reduced, and is informative on the relative relevance of each independent variable to explain the variation of the variable of interest.
We use the partial least squares regression (PLSR) technique, which generalizes and combines features from principal component analysis and multiple regression and may be used to carry out simultaneous adjustment in situations of high multicollinearity. The PLSR approach was developed by Herman Wold [19] for the modeling of complex data sets in terms of chains of matrices, the so called path models (e.g. Tenenhaus et al. [20]). PLS has been used in various disciplines such as chemistry, economics, medicine, psychology, and pharmaceutical science, where predictive linear modeling, especially with a large number of predictors, is necessary (Wold et al. [21]).
Our assessment of demand for higher education in Portugal is developed using a data set comprising demographic, economic, social and institutional variables. The statistical multivariate data analyses are performed using version 10.0 of SIMCA-P (Umetrics, Umeå, Sweden). The efficiency and reliability of the PLS model was evaluated with respect to the percentage of explained variance (R2Y) and capacity of prediction (Q2). The PLS model is, in addition, evaluated with respect to goodness of fit (R2).
Tenenhaus et al., [22] stated that PLSR is a technique used to summarize two data sets, X and Y, by latent variables, taking into account that the block Y is a set of responses and the block X is a set of predictors. PLS components denoted by are related to X and constrained to be orthogonal,
and PLS components denoted by are related to Y and are not constrained to be orthogonal. Let and be the centralized blocks of X and Y. Hoskuldsson [23] showed that the h-th PLS components and are obtained by maximizing the Tucker criterion [24]:
, subject to the constraints .
The PLS algorithm may be interpreted as the problem of computing weight vectors w and c which maximize the correlation between the score vectors t and u. Hence, we have the problem of maximizing the function with respect to w and c subject to the orthogonal constrains on w and c (e.g.[22]). This algorithm and some of its extensions are described in detail by Tenenhaus [26].
4 EMPIRICAL ANALYSIS
As previously discussed, our empirical analysis considers a large number of explanatory variables to explain the evolution of aggregate demand for higher education in Portugal. We measure demand as the yearly ratio of higher education applicants to the number of individuals that have reached university age (18 years). The evolution of this ratio in the period of analysis is depicted in Fig.1, below.
Figure 1 – Demand for higher education in Portugal (% of 18-year olds)
The potential determinants can be broadly categorized into four main groups: demographic, social, economic and institutional variables. The set considered here includes the total and graduate unemployment rates, the percentage of females in higher education, the percentage of population with a higher education degree, the percentage of adult population with primary, lower secondary and upper secondary education, the real GDP growth rate, the real per capita GDP growth rate, the annual variation of the real personal disposable income, government expenses in education a percentage of GDP, the ratio of tertiary education fees to the minimum wage, the opportunity cost of tertiary education, the wage premium of a tertiary education degree, the number of years in compulsory education. Dummy variables were introduced to take into account the existence in some years of minimum marks to access higher education, the existence of tuition fees, institutional reforms in secondary education and the end of compulsory military service.
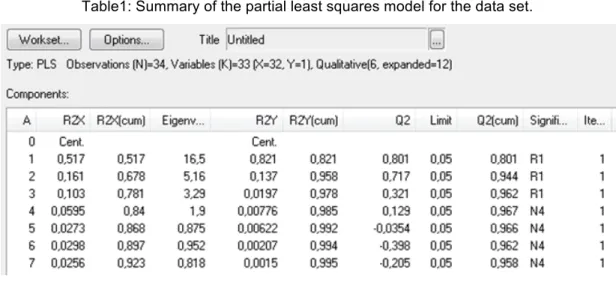
The results obtained for the PLS analysis are summarized in Table 1. The PLS analysis of the data extracted only three significant component according to the cross validation rule 1 (R1), that sets for PLS models a significant limit of 0.05. The first component (A1) with a Q2 >0.05 is the significant component and explains 51.7% of the X-variance and 82.1% of the Y-variance.
0 10 20 30 40 50 1977 1982 1987 1992 1997 2002 2007 2012
Table1: Summary of the partial least squares model for the data set.
The score plot shows (Fig. 2) the possible presence of outliers, similarities and other patterns in the data. With this two-dimensional score plot, draws the tolerance ellipse based on Hotelling's . Loading plot shows which parameters are correlated and responsible for the distribution in the score plot. The position in the loading plot corresponds to the score plot - plots far away from the center have a larger impact than those closer to the center.
The plot of the X scores, t1 vs. t2 presented in Fig. 2, shows the observations grouped according to a gradient in demand which is not homogeneous across the period of time under analysis. There is a clear distinct pattern separating the 80s and the 2000s form the 90s.
Figure 2: Partial least squares scores t1 and t2.
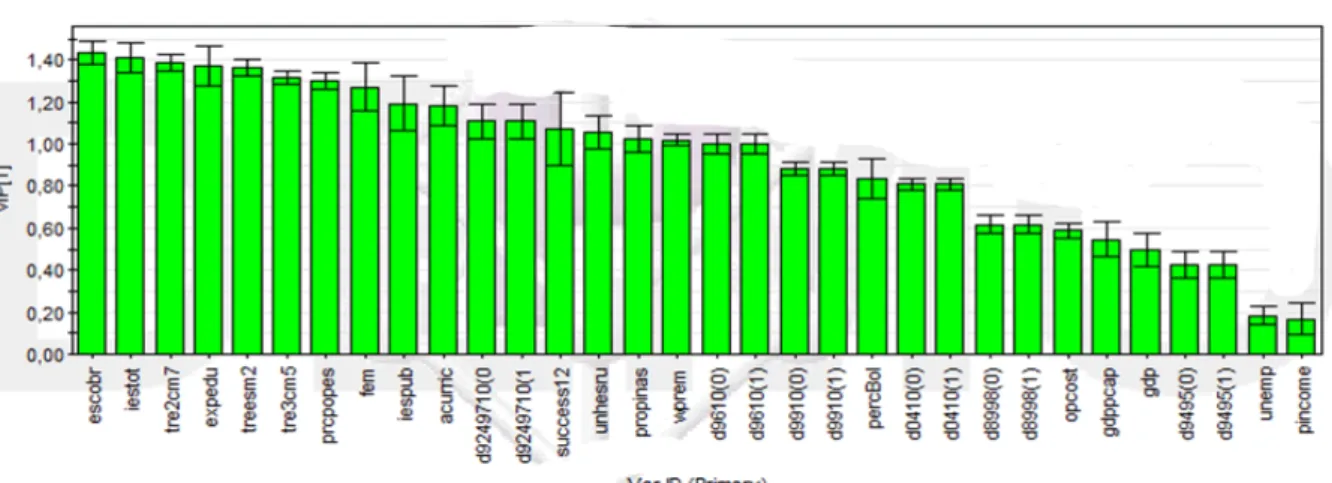
The “variable influence on projection” (VIP) values summarize the overall contribution of each individual X variables for the explanation of the variation of the Y variable. It is assumed that VIP values higher than one, indicate the most relevant variables for explaining the model. Fig. 3 shows the demand determinants by descending VIP values.
Figure 3: Variables influence on projection (VIP), by descending order of significance
The least relevant variables for the entire period are those associated with the economic activity: personal disposable income (pincome), the unemployment rate (unemp), GDP growth rate (gdp) and GDP per capita. All these variables display a VIP value below unity.
The most relevant variables, according to the estimated model, with a VIP above unity are the number of years of compulsory school attendance (escobr) and some variables denoting the public investment in higher education: number of higher education institutions, either public (iespub) or total (iestot) and the public spending with higher education (expedu) in percent of GDP. Other important variables are the real schooling rates at the second (tre2cm7) and third (tre3cm5) cycles of primary education and at secondary education (treesm2).
The intention of applying to a place in higher education is also highly influenced by the share of population with a higher education degree (prcpopes) and, particularly at the beginning of the sample period, by the increase in the female participation rate in higher education (sixteen percentage points in nineteen years).
5 CONCLUSIONS
In this study we analyzed demand for higher education in Portugal, attempting to identify the main determinants that have driven its behavior in the last three decades. This assessment has academic and policy interest because it adds to the empirical literature on demand for higher education and provides information that may be useful for policy makers aiming at increasing demand in a context of fiscal stringency and general economic crisis.
The PLS methodology employed in this paper has the advantage of allowing testing a large number of potential independent variables, even with a relatively short sample of 33 years. More traditional econometric techniques would fail due to a small number of degrees of freedom. The drawback, however, is that we do not get, as usual, a neat estimated equation with precise coefficients. With this methodology, the focus is on identifying which variables are more important to explain the phenomenon under analysis. This allows the selection of a more restrict number of explanatory variables to be employed with more conventional econometric methodologies.
According to the empirical results obtained, most of the more relevant variables explaining the percentage of eighteen year olds applying for a place in higher education are directly dependent on government action: the number of compulsory schooling years, the number of higher education institutions in the country, both public and total, and public spending in higher education, in percent of GDP. The importance of compulsory schooling is reinforced by the other variables identified by the model as most relevant, the real schooling rates in primary and secondary education. Maintaining the students in the education system is obviously crucial to attract them to higher education.
The results also suggest that the economic variables are the least relevant to explain demand for higher education. Personal disposable income, GDP, either per capita or in growth rates, and the unemployment rate are ranked last in order of importance, with a 'variable influence on projection' (VIP) well below unity, the suggested threshold for statistically significant variables. It would be
interesting to assess whether the influence of these economic variables increases in the more recent years, as the economic crisis reduces families' incomes and employment prospects.
The results obtained in this paper can be further explored by employing more traditional econometric techniques with a limited number of the most relevant variables, as identified by PLS. This would allow another useful extension of this research, predicting the future evolution of demand, a critical piece of information for both individual institutions and national public policies.
ACKNOWLEDGEMENT
Isabel Vieira and Carlos Vieira gratefully acknowledge financial support from Fundação para a Ciência e a Tecnologia and FEDER/COMPETE (grant PEst-C/EGE/UI4007/2011).
REFERENCES
[1] OECD (2012) Education Indicators in Focus. 2012/05 (May).
[2] Campbell, R. and Siegel, B. (1967). The demand for higher education in the United States. 1919-1964, American Economic Review 57(3), pp. 482-494.
[3] Galper, H. and Dunn, R. (1969). A short run demand function for higher education in the United States. Journal of Political Economy 77(5), pp. 765-777.
[4] Corazzini, D. and Grabowski, H. (1972). Determinants and distributional aspects of enrolment in U.S. higher education. Journal of Human Resources 7(1), pp. 39-59.
[5] McPherson, M. and Schapiro, M. (1991). Does student aid affect college enrollment? New evidence on a persistent controversy. The American Economic Review 81(1), pp. 309-318. [6] Nicholls, M. (1984). The demand for tertiary education—an Australian study. Higher Education
13(4), pp. 369-377.
[7] Psacharopoulos, G. and Soumelis, C. (1979). A quantitative analysis of the demand for higher education. Higher Education 8(2), pp. 159-177.
[8] Duchesne I. and Nonneman, W. (1998). The demand for higher education in Belgium. Economics of Education Review 17, pp. 211-218.
[9] Christofides, L., Hoy, M. and Yang, L. (2008). The determinants of university participation in Canada (1997-2003). Department of Economics DP 2008-05, University of Cyprus.
[10] Hoenack, S. and Weiler, W. (1979). The demand for higher education and institutional enrolment forecasting. Economic Inquiry 17(1), pp. 89-113.
[11] DesJardins, S., Dundar, H. and Hendel, D. (1999). Modelling the College Application Decision Process in a Land-Grant University. Economics of Education Review 18, pp. 117-132.
[12] Buss, C., Parker, J. and Rivenburg, J. (2004). Cost, quality and enrolment demand at liberal arts colleges. Economics of Education Review 23, pp. 57-65.
[13] Freeman, R. (1971). The Market for College-Trained Manpower: A study in the economics of career choice. Harvard University Press.
[14] Wetzel, J., O’Toole, D. and Peterson, S. (1998). An analysis of student enrolment demand. Economics of Education Review, 17(1), pp. 47-54.
[15] Sissoko, M. and Shiau, L. (2005). Minority enrolment demand for higher education at historically black colleges and universities from 1976 to 1998: an empirical analysis. Journal of Higher Education 76(2), pp. 181-208.
[16] Sá, C, Florax, R. and Rietveld, P. (2004). Determinants of the regional demand for higher education in the Netherlands: a gravity model approach. Regional Studies 38(4), pp. 375-392. [17] Ahlburg, D., Crimmins, E. and Easterlin, R. (1981). The outlook for higher education: a cohort
size model of enrolment of the college age population, 1948-2000. Review of Public Data Use 9, pp. 211-227.
[18] Murdoch, S. and Hoque, M. (1999). Demographic factors affecting higher education in the United States in the twenty-first century. New Directions for Higher Education 108, pp.5-13. [19] Wold, H. (1985). Partial Least Squares. In Samuel Kotz and Norman L. Johnson, eds.,
Encyclopedia of Statistical Sciences 6, pp. 581-591. New York: Wiley.
[20] Tenenhaus, M., Esposito Vinzi, V., Chatelin, Y.M., Lauro, C. (2005). PLS path modeling. Computational Statistical and Data Analysis, 48(1),159-205.
[21] Wold, S., Sjostrom, M. and Erikson, L. 2001. PLS-regression: A basic tool of chemometrics. Chemometrics Intelligent Laboratory Systems, 58 (2), pp. 109-130.
[22] Tenenhaus, A., Giron, A., Viennet, E., Béra, M., Saporta, G. and Fertil, B. (2007). Kernel logistic PLS: A tool for supervised nonlinear dimensionality reduction and binary classification.
Computational Statistical and Data Analysis 51, pp. 4083-4100.
[23] Hoskuldsson, P. (1988). PLS Regression Methods. Journal of Chemometrics 2, pp. 211-228. [24] Tucker, R. (1958). An inter-battery method of factor analysis. Psychometrika 23, pp. 111-136. [25] Tenenhaus, M. (1998). La R\'egression PLS. Paris: Éditions Technip.