2016
UNIVERSIDADE DE LISBOA
FACULDADE DE CIÊNCIAS
DEPARTAMENTO DE BIOLOGIA ANIMAL
Spatial occupancy patterns of carnivores in a
cork oak landscape
João Miguel Amaral Diogo
Mestrado em Biologia da Conservação
Dissertação orientada por:
Professora Doutora Margarida Santos-Reis
Doutor Luís Miguel Rosalino
Este estudo foi realizado no contexto do plano de atividades da:
a) Estação de Campo do Centro de Ecologia, Evolução e Alterações Ambientais (cE3c), Unidade de I&D da Faculdade de Ciências da Universidade de Lisboa (FCUL)
b) Plataforma LTsER Montado (http://www.ltsermontado.pt/), dedicada à investigação sócio ecológica de longo prazo do sistema Montado.
i
AgradecimentosMais uma etapa que agora finda. É estranho, não é? A incerteza que se segue… Mas este não é o momento para preocupações. É momento, isso sim, de celebrar. E se celebro, devo-o a todos os que desde o início me apoiaram.
Assim, o meu muito obrigado à Professora Margarida, que não só não cortou as pernas às minhas ideias, como me permitiu desenvolver um trabalho que me enche as medidas.
Seguindo o raciocínio, deixo aqui a minha gratidão ao Miguel, pela sua eterna paciência, que escutou todas as minhas dúvidas. Nem as mais óbvias e ignorantes ficaram sem respostas.
Ao Gonçalo agradeço pelas dificuldades que me mostrou e pela possibilidade de descobrir como as ultrapassar. Ao Professor Zé Pedro Granadeiro, pela preciosa ajuda a desvendar os mistérios do QGIS. Ao Duarte agradeço pelo conhecimento que me transmitiu sobre a vida no meio da Serra de Grândola. E ao cE3c, claro está, que me deu habitação e uma base de operações durante toda a estadia na Herdade.
E já que estamos a falar da Serra de Grândola, agradeço também aos seus habitantes:
Ao guarda-florestal, cujo nome infelizmente não me recordo, pela sua eterna preocupação com as minhas estimadas e valiosas câmaras;
Ao homem do reboque, excelente profissional que, solidário com a minha causa, conseguiu a proeza de atolar todo um camião reboque no lamaçal. Toda uma noite ao relento, com chuva, ao frio e sem comida. Genial! E o dono do terreno também só perdeu dois chaparros…
Ao dono do trator que rebocou o reboque. Agora já sei a quem pedir ajuda no futuro. E já agora, ao condutor do dito trator, que me tornou famoso da noite pró dia em Cruz de João Mendes.
Ao iluminado que fez questão de me roubar a câmara daquele fatídico ponto. Depois de uma caminhada de 20 Km para o descobrir, era mesmo o que precisava… E já que estamos a falar de iluminados (às tantas até é o mesmo), ao pastor que não foi capaz de me roubar uma 2ª câmara.
Continuando em Grândola, não só agradeço a todas as minhas companhias, mas especialmente: À Joana! Sem ti nunca teria ido parar a Grândola, foste a companhia desde o 1º momento e sofreste comigo todas as incertezas, todas as dúvidas, todas as dores e todos os cansaços que nos assolaram, dois jovens ingénuos e inocentes que nem sabiam o que esperar.
À Ana! Que não tendo razão para tal, ainda se deve achar uma invasora. Foste a resposta a muitas das minhas dúvidas e foste a dúvida de muitas das minhas respostas. E foste a companhia do meio do nada. Não me voltei a perder sozinho.
E se falo destas duas, tenho também de falar da terceira. À Ana! A estatística deu problemas, é certo. Mas sem ti… Se calhar não estaria a escrever isto agora.
Breve pausa para agradecer à miúda mais importante de todo este trabalho: a minha viatura! Muitos nomes já lhe foram atribuídos e muitos problemas já ela sofreu. Mas fosse qual fosse a estrada, fosse qual fosse o clima… Nunca fiquei apeado! (Menos daquela vez na lama mas isso foi culpa do gajo que a conduzia… Sim, eu…)
Voltando à programação habitual, um obrigado aos invasores do meu laboratório, gente vil e desenvergonhada, que no Mac me forçaram à engorda. Mas sofremos todos juntos nos momentos de prosa. Se um chora, todos choram mas no fim ninguém chorou mas também ninguém entregou.
O meu grande agradecimento à revisora não oficial desta tese, Joana Rodrigues, que nada do que leu percebeu e no fim uma só certeza teve: um lanche é-lhe devido.
E àquele grupinho que feitos parvos se juntaram com o propósito de irem bebendo uns copos e agora, juntos ou não, já nada os separa e eu vou parar de escrever isto porque se está a tornarmuitolamechasejáestoumesmoaveralgumaspessoasaverterumaslágrimas. Mas obrigado por sempre terem estado presentes.
ii
E finalmente, com a página quase só para eles, o meu eterno obrigado à minha família.
Se eu poderei ter sofrido com este trabalho (não confirmo nem desminto), alguém sofreu mais do que eu. E eu percebo. A filha sair de casa? Tranquilo. Agora, o filho pródigo? Pobres pais. E pobre Peúga também, que já não tem que aturar o irmão.
Mas com toda a seriedade, se alguém esteve presente desde o início, com todo o apoio e amor incondicional, foram eles. Muito, mas muito obrigado.
iii
ResumoA forma como as espécies coexistem e interagem, bem como os mecanismos subjacentes, têm sido alvo de diversos estudos. No entanto, são mais raros os estudos onde é realizada uma abordagem multiespecífica, nomeadamente envolvendo uma comunidade de mesocarnívoros. Das várias interações interespecíficas possíveis, a competição é um dos principais fatores a moldar a organização das comunidades, incluindo as de carnívoros.
As adaptações comportamentais traduzem-se na segregação e diferenciação de nichos. Esta diferenciação, resultado da utilização de recursos e das interações interespecíficas dentro de uma comunidade, pode ser dividida em três níveis: temporal, trófico e espacial. Assim, em espécies que coexistam, é expectável que, convergindo numa dimensão, divirjam em pelo menos uma das restantes. A organização a nível espacial é o resultado de uma seleção de habitat baseada num trade-off entre os desempenhos dos diferentes habitats de um ecossistema, fruto das características dos mesmos. Entre os vários fatores a ter em conta, podem-se enumerar a capacidade de o habitat providenciar refúgio e alimento bem como a morfologia e fisiologia das espécies que fazem a dita seleção. Esta diferenciação espacial, tal como a temporal e a trófica, pode variar sazonalmente e mesmo entre populações.
Os carnívoros (Ordem Carnivora) exibem uma variedade de tamanhos, estratégias de reprodução, preferências de habitat e outras características que lhes permitem a exploração de diversos nichos ecológicos. Adicionalmente, esta diversidade também lhes confere uma enorme importância no ecossistema, pelas funções que nele podem desempenhar. Uma dessas funções é o controlo de populações de herbívoros e de mesopredadores, esta ultima desempenhada pelos grandes carnívoros, ou predadores de topo.
Uma das principais forças motrizes das alterações dos ecossistemas é a agricultura, uma atividade humana que afeta temporal e espacialmente a estrutura do ecossistema, podendo impactar o seu funcionamento. Dependendo das culturas, as paisagens agrícolas podem representar ecossistemas ricos em termos de alimento, beneficiando diversas comunidades animais, sendo o montado um bom exemplo de um sistema agrícola que providencia diversos e abundantes recursos tróficos.
O montado, bastante heterogéneo, resultou de uma interação entre o Homem e o ecossistema durante centenas de anos, com uma rotação de usos do solo entre pasto, agricultura e pousio, que alterou localmente a fauna portuguesa, favorecendo as espécies mais generalistas. Com o êxodo rural e a industrialização da agricultura, este ecossistema está a degradar-se, impactando igualmente as comunidades que nele residem, nomeadamente a comunidade de mesocarnívoros.
Pela sua função enquanto predadores de topo neste ecossistema, é importante determinar de que forma os mesocarnívoros estão a ser afetados pelo abandono do montado, que resultou na perda de alguma heterogeneidade espacial, o que pode originar uma menor disponibilidade ou acessibilidade dos recursos alimentares bem como de abrigos. Visto que os mesocarnívoros poderão ser forçados a competir mais intensamente pelos recursos do ecossistema, e que terão que arranjar novas formas de se organizarem espacial e temporalmente, este estudo pretende determinar os padrões de ocupação e uso do espaço pela comunidade de mesocarnívoros da Serra de Grândola, uma área em processo de renaturalização, bem como avaliar o efeito de diversas variáveis ambientais e ecológicas (ex. composição da paisagem, competição interespecífica) sobre esses padrões. Adicionalmente, através da comparação dos resultados com os obtidos num estudo realizado na Companhia das Lezírias (Centro-Oeste de Portugal), pretende-se discutir o efeito das diferentes opções de gestão do montado nos padrões de ocupação e estruturação da comunidade de mesocarnívoros. É esperado habitats que possam funcionar como fontes de alimento exerçam um efeito positivo nos padrões de ocupação e que os diferentes estados de desenvolvimento do subcoberto tenham efeitos variados consoante as espécies, i.e. espécies como a raposa, mais ágeis, beneficiem duma cobertura mais densa enquanto o texugo, pela sua morfologia, se adapte melhor a subcoberto mais esparsos. Já relativamente às respostas às diferentes ações de gestão, estas deverão ser
iv
espécie e contexto-dependentes, nomeadamente com o gado a exercer um efeito geralmente negativo e zonas como hortas e pomares, provedoras de alimento, a assumirem uma maior importância na Serra de Grândola, onde o ecossistema é mais homogéneo e onde poderá haver uma menor diversidade e abundância de recursos.
Para tal, foi monitorizada a comunidade de mesocarnívoros da Serra de Grândola, com recurso à foto-armadilhagem. Nesta região a presença e impactos humanos são moderados, com a gestão do montado a ocorrer ainda a pequena escala, fruto do abandono rural cujos efeitos só recentemente começaram a ser mitigados. Esta monitorização baseou-se no estabelecimento de uma grelha de 30 câmaras fotográficas, ativas durante cerca de 4 meses (Dezembro de 2015 a início de Abril de 2016). Adicionalmente, foram recolhidas várias variáveis ambientais nos locais onde as câmaras estavam instaladas, variáveis essas que, pelo conhecimento ecológico que existe das espécies alvo, se pensa que poderão afetar a seleção de habitat por parte dos carnívoros. Estas variáveis foram recolhidas num buffer de 325 m2 em torno de cada câmara, tendo sido agrupadas em três categorias: Habitat, Fonte de Alimento
e Perturbação. Foi considerada ainda uma quarta categoria, Competição Interespecífica, de forma a avaliar se a presença de potenciais competidores influência os padrões de ocupação de cada espécie. Os resultados foram posteriormente analisados recorrendo a modelos de ocupação (single season, single
species).
O período de foto-armadilhagem permitiu registar 922 capturas individuais das cinco espécies alvo, sendo a raposa a mais registada, com 489 capturas. Em sentido inverso, a fuinha foi a espécie menos vezes detetada, com 81. Apesar do reduzido número de capturas, a fuinha não foi a espécie com menor taxa de ocupação naïve (ou seja, proporção de câmaras em que a espécie foi detetada), uma vez que apresenta uma taxa de cerca de 77% contra os 63% do texugo. Por constrangimentos do método estatístico selecionado, não foi possível avaliar os padrões de ocupação da raposa e da geneta, uma vez que estas espécies demonstraram taxas de ocupação naïve bastante elevadas (acima de 80%) e, como tal, o modelo não é capaz de estimar os padrões de ocupação.
Para cada uma das três espécies modeladas (texugo, fuinha e sacarrabos), as combinações de variáveis ambientais que influenciaram os padrões de ocupação foram diferentes, o que suporta a ideia inicial de que existe segregação ao nível do nicho espacial, facilitando a coexistência. No entanto, de todas as variáveis incluídas nos modelos das três espécies, apenas uma apresentou um efeito significativo. Assim, detectou-se que a proximidade a zonas com presença humana, como casas ou aldeias, afeta positivamente a probabilidade de ocupação de uma determinada área pelo texugo. Isto implica que a presença humana parece beneficiar os texugos, possivelmente devido ao facto destas zonas antrópicas poderem representar novas fontes de alimento. Estas fontes de alimento ganham especial importância em épocas como aquela em que o estudo foi realizado (i.e. Inverno 2015-2016), uma vez que durante esse período foi registada uma escassez dos recursos essenciais às espécies de mesocarnívoros. Este estudo providenciou outros resultados inesperados, apesar de não estatisticamente significativos, nomeadamente a relação entre a presença da raposa e a probabilidade de ocupação do texugo e do sacarrabos. Este facto pode ser o resultado de um efeito indireto da presença da raposa e não um impacto efetivamente positivo deste canídeo sobre as duas outras espécies. O caracter generalista da raposa faz com que esta frequente áreas de maior disponibilidade de alimento sendo que a sua presença poderá ser indicativa da capacidade dessas áreas de fornecer alimento pelo que, por isso, são mais utilizadas pelo texugo e sacarrabos. É importante salientar a presença do modelo nulo entre os melhores modelos de ocupação gerados para o sacarrabos, indicando que; 1) algumas variáveis ambientais que poderão ter importantes impactos positivos ou negativos na probabilidade de ocupação das áreas pelo sacarrabos, não foram incluídas como candidatas no processo de modelação; e/ou 2) a distribuição desta espécie é muito generalizada, tendo sido detetada em todas as áreas com características distintas, impossibilitando a identificação dos efeitos das variáveis consideradas.
v
A comparação dos resultados deste estudo com um semelhante, implementado numa área de montado com uma gestão mais ativa, permitiu evidenciar o papel da presença do gado na estruturação das comunidades de mesocarnívoros. Enquanto no presente estudo este fator parece não ter importância, no estudo realizado na Companhia das Lezírias, uma zona de criação de gado bovino, a presença deste tipo de gado tem um efeito essencialmente negativo em várias espécies, nomeadamente na raposa e no texugo. Esta diferença de efeito das actividades antrópicas realça o impacto que uma utilização mais intensiva das áreas de montado pode ter nas comunidades naturais. No entanto, é necessário frisar que as abordagens analíticas usadas em ambos os trabalhos diferem (modelos de ocupação single season
single species do presente estudo vs modelos N-Mixture do estudo realizado na Companhia das Lezírias)
e, por isso, as ilações que se retiram desta comparação devem ter em conta estas diferenças metodológicas.
Este estudo revelou que os padrões de ocupação do espaço de cada espécie são influenciados por diferentes variáveis ambientais. Apesar dos constrangimentos, os resultados apontam para a necessidade de, pelo menos, alguma manutenção do montado, enfatizando a importância das fontes de alimento bem como da camada arbustiva que, exigindo manutenção, deve ser moderada. A realização deste estudo, juntamente com a comparação com dados anteriores, reforçam a ideia de que as ações de conservação do montado devem sempre ter em conta a comunidade, em vez de cada espécie individualmente, bem como a relevância de pensar cada ação caso a caso. Isto é especialmente importante uma vez que apesar do sistema ser essencialmente o mesmo, entre os vários sítios as diferenças locais podem exigir diferentes medidas.
Para o futuro sugere-se uma diferente análise estatística bem como um esforço de amostragem maior, aumentando a grelha de armadilhagem, ponderando-se também a inclusão de novas variáveis.
vii
AbstractCompetition is one of the main driving forces in communities’ structuring and organization. This implies that species have to adapt in order to minimize competition and be able to coexist. Species develop either morphologic adaptations of character displacement or behavioral mechanisms to coexist. These mechanisms translate as different niche selection, which can act at temporal, trophic or spatial scales. Spatial patterns are the outcome of habitat selection mechanisms and inter and intra-specific interactions based on a trade-off in performance between the different habitat types and its characteristics.
Agriculture is one of the main human-induced drivers of ecosystem change. In Southern Portugal the landscape has been changed for the last few thousands of years, originating an agro-silvo-pastoral system known today as the Montado. The mesocarnivores community inhabiting this system evolved to take advantage of the resources it has provided but also to cope with the human associated disturbance. However, the full effect of the decrease of human maintenance activities within the montado on the mesocarnivore community structure and functioning is still unknown. Thus, this study aims to access the patterns of spatial organization of the mesocarnivore community inhabiting Serra de Grândola, and understand how these may differ from areas where montado management is more intensive. We developed a camera-trap approach that, along with a collection of environmental covariates related to habitat, food and disturbance, allowed the construction of single season, single species occupancy models for three mesocarnivores species. For the stone marten and the Egyptian mongoose no significant covariate effects were detected, but a negative influence of the distance to human presence sites on badger occupancy was found. This is probably due to a higher food availability in these anthropic areas, which can become particularly important when resources are scarcer in the wild. We also showed different mesocarnivore occupancy patterns between areas with different types of livestock management, with cattle exerting a stronger negative impact in carnivores’ occupancy. Thus, human management is still important not only for the montado maintenance but also to preserve the carnivore community. From this study and the comparison between areas, two messages can be taken towards conservation. First, conservation strategies must be directed towards the entire community and not be species-specific. Additionally, each case must be considered individually, since the same ecosystem may found variation across different locations. For the future, we suggest a different statistical approach as well as a more intensive habitat characterization and covariates recollection.
ix
IndexAgradecimentos ... i
Resumo ... iii
Abstract ... vii
1.
Introduction ... 1
1.1
Competition, occupancy patterns and niche partitioning ... 1
1.2
Carnivores role in ecosystems functioning and community changes ... 2
1.3
Human intervention in ecosystems and consequences for carnivores – Portuguese
montado as case study ... 3
1.4
Study aims ... 5
2.
Study area ... 7
3.
Methods ... 9
3.1
Sampling design and camera trapping protocol ... 9
3.2
Sampling stations characterization ... 9
3.3 Statistical analysis ... 13
4.
Results ... 15
4.1
Habitat characterization ... 15
4.2
Mesocarnivore capture success ... 15
4.3
Patterns of mesocarnivore habitat use ... 16
4.4
Species naïve and occupancy probabilities ... 17
5.
Discussion ... 21
5.1
Mesocarnivore occupancy patterns at Serra de Grândola ... 21
5.2
Effects of human management on occupancy patterns ... 23
6.
Final remarks ... 25
7.
References ... 27
x
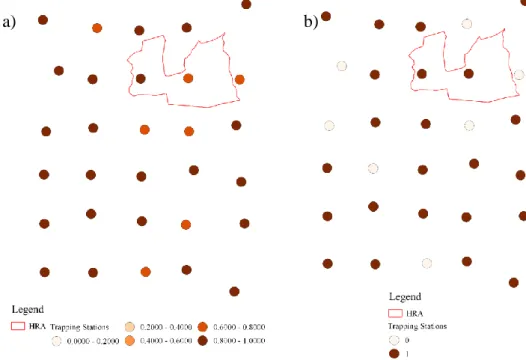
Figures IndexFigure 2.1 - Study area location, “Herdade da Ribeira Abaixo” limits and camera trapping sations with associated buffers. ... 7 Figure 3.1 - Habitat cover in each trapping station buffer... 12 Figure 4.1 - a) Fox and b) Genet distribution across the study area.. ... 18 Figure 4.2 - Mongoose distribution predicted by the best models (a) and actual distribution across all area (b) ... 18 Figure 4.3 - Badger distribution predicted by the best models (a) and actual distribution across all area (b) ... 19 Figure 4.4 - Stone marten distribution predicted by the best model (a) and actual distribution across all area (b) ... 19
xi
Tables IndexTable 3.1 - “Habitat”, “Food resources”, “Disturbance” and “Interspecific Competition” variables used in model construction. ... 10 Table 4.1 - Principal Components Analyses results of the Habitat category. ... 15 Table 4.2 - Camera trap efforts and mesocarnivores captures in Serra de Grândola from December 2015 to April 2016. ... 15 Table 4.3 - Best models (ΔAICc < 2) for the mongoose, badger and stone marten reflecting the variables influencing the patterns of habitat use. ... 16 Table 4.4 - Model averaged beta coefficient estimates, standard error (SE) and 90% confidence interval (CI) for the covariates included in the mongoose, badger and stone marten best models of habitat use. ... 17
1
1. Introduction1.1 Competition, occupancy patterns and niche partitioning
Ecological communities are assemblages of multiple species and organisms, with a high degree of complexity caused by environmental constraints, historical contingencies and species interactions (Levin 2009). The way species coexist and interact, and the underlying mechanisms allowing coexistence, have been widely studied, but only seldom in a multispecies approach, particularly when several predators are involved (e.g., Fedriani et al. 1999, Ritchie & Johnson 2009). Even though there are many types of species interactions, such as mutualism, commensalism and predation, competition is considered to be one of the main drivers influencing communities’ organization (Hairston et al. 1960, Schoener 1983).
Competition can be classified according to the mechanisms promoting interaction, being named exploitative or by interference (Schoener 1983), or, alternatively, indirect or direct competition (Palomares & Caro 1999). When exploitative, or indirect, resource use by competing individuals deprives others of sharing resources while gaining its consumption benefits (Schoener 1983, Levin 2009). As for interference competition, there is a direct clash between competing individuals that actively and aggressively prevents the use of resources by the weaker competitor (Schoener 1983, Levin 2009). Intraguild predation is an extreme case of interference competition and it is recognized as an important factor influencing community organization (Wilson et al. 2010). In this case, a species kills other members of the guild that are potential competitors, resulting in an immediate energetic gain and a decrease in potential exploitation competition (Polis et al. 1989, Palomares & Caro 1999).
Even though the coexistence of two trophic and morphologically similar species affects both counterparts, these interactions are usually asymmetric and therefore tends to lead to the superposition of the stronger species and the local or global extinction of the weaker (Fedriani et al. 2000, Levin 2009). Hardin (1960) stated that “complete competitors cannot coexist”, thus defining the principle of
competitive exclusion. However, despite this early statement (Hardin 1960, MacArthur & Levins 1967),
there are several examples in nature where coexistence occurs although apparently species are similar and even tough competition occurs, it does not endanger species existence.
To make coexistence possible, species have to adapt or evolve, developing either character displacement (Brown & Wilson 1956) or behavioral (Schoener 1974) mechanisms. These mechanisms are regional-specific, thus often different mechanisms shape species responses across its distribution range (e.g. Grant & Grant 2006, Kitchen et al. 2000).
Character displacement hypothesizes that in areas of sympatry, morphologically similar species diverge in one or more characters by force of competition (Brown & Wilson 1956), in opposition to “character release”, where the differentiation occurs when in allopatry, in the absence of competition (Brown & Wilson 1956, Grant 1972, Simberloff et al. 2000). Following Grant (1972) critiques, this widely accepted concept of character displacement became the focus of discussion in the late 1970s and early 1980s, with the role of competition in the morphological characters divergence being questioned (Grant 1972, Dayan & Simberloff 2005). Nevertheless, later research has provided evidence that character displacement may be related to either imposition or release from competition (Simberloff et al. 2000). Carnivores are the group of mammals where character displacement was most studied, owing it to its large geographic ranges and great morphological variation (Simberloff et al. 2000, Dayan & Simberloff 2005), namely body size (Dayan et al. 1989) but also other metrics (e.g. canine strength and size – Jones 1997, Davies et al. 2007 – and cranial variation – Lee & Mill 2004) which influences resource partitioning (Dayan et al. 1989, Dayan & Simberloff 2005).
Comparatively with the morphological divergences, behavioral mechanisms have been relatively less studied. These behavioral mechanisms, translated into niche differentiation and segregation (Hairston et
2
al. 1960, Schoener 1974, Kronfeld-Schor & Dayan 2003), are however a major factor enabling coexistence among competitors (MacArthur & Levins 1967, Kronfeld-Schor & Dayan 2003), benefiting from ecosystems heterogeneity and enforcing an anti-predator behavior in cases where intraguild predation exists (Fedriani et al. 2000).
Taking Hutchinson’s (1957) fundamental niche framework, a niche can be defined as an n-dimensional hypervolume on which each species can exist and where the n dimensions consist on environmental conditions (Hutchinson 1957, Schoener 1974). The niche concept has evolved along the 20th century and even though there are three distinct meanings (Recess/Role niche - Grinnel 1917;
Population-persistence niche - Hutchinson 1957, and Resource-utilization niche - MacArthur & Levins 1967), the basic notion reflects community organization as a result of resource use and interspecific interactions inside a community (Chesson 2000, Levin 2009) or, in other words, reflects the full range of biotic and abiotic conditions in which an organism can survive and reproduce (Monterroso 2013). Thus, niche differentiation can be achieved by segregation of the temporal, trophic and/or spatial niches, in an increasing order of importance (Schoener 1974, Kronfeld-Schor & Dayan 2003). It is therefore expected that co-existing species that share similarity along one niche dimension diverge in at least one of the other (Hairston et al. 1960, Schoener 1974, Chesson 2000), in accordance with the limiting
similarity theory (MacArthur & Levins 1967).
The spatial niche organization is an outcome of a habitat selection based on a trade-off in the performance of the available habitat types referring to the species characteristics and requirements (Jones & Barmuta 2000). Species morphology and physiology, risk of predation and competition, habitat’s ability to provide refuge and trophic resources are, among other, factors that influence habitat performance (Jones & Barmuta 2000, Revilla et al. 2000). As activity patterns and resource partitioning, spatial niche selection may vary seasonally and/or by gender (e.g. Chamberlain et al. 2003), and even cause specialization (Jones & Barmuta 2000).
Since differential habitat selection is a mechanism that can promote coexistence, when an ecosystem has a greater diversity of habitats, species coexistence is favored (Pereira et al. 2012). This is due to the different set of resources that each habitat is capable to provide. However, spatial variation and abundance of a prey may instigate a similar spatial response from its predators. This makes the prey-predator interaction another important factor in niche selection (Fedriani et al. 1999, Wilson et al. 2010), the same with the human induced habitat fragmentation/disturbance (Oehler & Litvaitis 1996).
Interference competition is one of the most common interactions causing a response at a spatial niche level and there are different types of responses that depend on the environment’s characteristics and competition intensity (Schoener 1983). Those responses can involve complete exclusion of the subordinate species from the landscape, or its restriction to suboptimal habitats, or changes in habitat selection both at landscape or fine scales (Fedriani et al. 1999, Scognamillo et al. 2003, Balestrieri et al. 2010, Wilson et al. 2010, Pereira et al. 2012, Broekhuis et al. 2013). Moreover, the same species can have different responses accordingly to the ecological context affecting them (e.g. habitat and guild composition and structure).
1.2 Carnivores role in ecosystems functioning and community changes
Carnivores, i.e. mammals of the Order Carnivora, display a wide array of bio-ecological characteristics, such as body size, reproduction strategy, habitat preferences or home range size and configuration (Gittleman et al. 2001). This variation allows them to explore very different niches and play distinct roles in the ecosystems (Ripple et al. 2014). Carnivores can be indicator species, reflecting the environment’s quality (Gittleman et al. 2001), but also flagship species, being crucial to increase public awareness to environmental problems, due to their high popularity and aesthetic values (Gittleman et al. 2001). As umbrella species, carnivores’ protection enables the protection of other
3
species from lower trophic levels and that explore the landscape at finer scales (Gittleman et al. 2001, Crooks 2002). They may also be considered ecological engineers (Jones et al. 1994, Sinclair 2003), a concept that identifies the organisms that directly or indirectly are capable to modify, maintain and/or create habitats (Jones et al. 1994), by assuming, for example the role of seed dispersers (e.g., Rosalino et al. 2010) or top-down population regulators of both mesopredators and herbivores (Prugh et al. 2009. Ritchie & Johnson 2009, Ripple et al. 2014).
Human demographic growth and expansion resulted in the degradation and destruction of ecosystems, converting natural areas mainly for agriculture (Crooks 2002, Mangas et al. 2008, Verdade et al. 2011), thus reducing carnivore’s suitable habitat. This process, allied with direct persecution have endangered many apex predators, reducing their range or even leading some species to regional or global extinction (Oehler & Litvaitis 1996, Prugh et al. 2009, Carvalho et al. 2011, Ripple et al. 2014).
The loss of apex predators, that function as population regulators, has open the door for population growth of large herbivores and mesopredators, the intermediate elements of the food web (Verdade et al. 2011). Although the terms might be confused with one another, mesopredator doesn’t necessarily mean mesocarnivores. While the former relates to intermediate elements of the food web, a mesocarnivores is generally considered a carnivore of mean proportions (e.g. carnivores with weights under 15 kilograms – Roemer et al. 2009). Thus, a mesocarnivore can be an apex predator in some situations (e.g. absence of large predators, such as the wolf or big cats), while being a mesopredator in others (Roemer et al. 2009).
When benefiting from the lack of intraguild predation (Prugh et al. 2009, Ritchie & Johnson 2009, Roemer et al. 2009) mesopredators see its mortality rate decrease and its natality rate increase, due to lower predation rate and higher food resources available, and these two factors combined increase mesopredators fitness, leading to higher densities (Prugh et al. 2009, Verdade et al. 2011). The high densities of mesopredators can result in an extreme depletion of the system resources or cause its destruction, increasing intraguild competition (Prugh et al. 2009). The unregulated and fast growth of mesopredators populations in the absence of the top predators is known as the mesopredator release
hypothesis (Soulé et al. 1988). This effect can force changes in the structure of the ecosystems and result
in negative cascading effects on the prey populations (Prugh et al. 2009).
Symptomatic of ecosystems imbalances, mesopredator release alters the intraguild relations. No longer under the threat of predation, mesopredators communities are now restricted by competition for the same resources and space (Prugh et al. 2009). This, as stated above, enhances the need for different behavioral strategies, including differential habitat use, to allow coexistence.
1.3 Human intervention in ecosystems and consequences for carnivores – Portuguese montado as case study
One of the main driving forces causing ecosystem changes is agriculture; existing for thousands of years, this activity evolved driven by the increasing need for new and more stable food resources, not only for human consumption but also for raising livestock. The replacement of native habitats by agriculture alters communities composition and consequentially impacts ecosystem structure and functioning (Oehler & Litvaitis 1996, Lyra-Jorge et al. 2008).
In agricultural converted landscapes specialist species, such as the large predators, suffer the worst consequences, since they not only lose their habitat but also their main prey (Carvalho et al. 2011). On the other hand, more generalist species, like the mesocarnivores, may take the agricultural land as a primary food source, more diverse and accessible (Dotta & Verdade 2007, Rosalino & Santos-Reis 2009, Carvalho et al. 2011), exploring the man-made habitat heterogeneity (Gehring & Swihart 2003). In fact, these landscapes have the potential to be among the most rich ecosystems in terms of food availability, depending on the culture type and management: not only it may provide a wide variety of
4
fruit and vegetables, but also host diverse and abundant invertebrate and small mammals communities (Rosalino et al. 2005a, Santos et al. 2007, Rosalino & Santos-Reis 2009, da Silva et al. 2011).
However, not every agricultural practice is able to withstand biodiverse communities. Monocultures are extremely prejudicial to biodiversity, not only due to the inherent habitat destruction, but also because they provide no variety of resources, are often associated with the use of agrochemicals, and limits the spatial and temporal heterogeneity of the ecosystems (Verdade et al. 2011). In fact, for the great majority of species, a heterogeneous ecosystem, with different habitat patches and resources, is beneficial (Gehring & Swihart 2003, Dotta & Verdade 2007).
The Mediterranean basin, characterized by its climate and human-mediated vegetation, has evolved along thousands of years of human presence, and some of the agricultural systems there developed are good examples of temporal and spatially heterogeneous environments (Blondel & Aronson 1999, Blondel 2006).
The montado (and its Spanish equivalent, dehesa) is the agro-silvo-pastoral system dominating in South Portugal, covering over 500.000 hectares. Resulting from the progressive transformation of the original macquis, the montado is a land use system based on the diversity and complementarity of uses, with a soil-level rotation of cultures, grazing and fallow, resulting in spatial and temporal heterogeneity that sustains high biodiversity (Correia 1993, Rosalino et al. 2009a). Traditionally, the montado is characterized by a sparse tree cover, generally cork (Quercus suber) or holm (Quercus rotundifolia) oak, though it can also include other oaks (Quercus pyrenaica and Quercus faginea) or different types of trees patches like olives groves (Olea europaea) or orchards (Correia 1993). The shrub vegetation, even though it can often exist at high densities, is regularly maintained and removed, either by direct human management or by animal grazing (Correia 1993, 2000).
The main economic activities associated with the montado are cork extraction, Portugal being the world market leader, acorns production and livestock raising, namely pigs, cattle, goats and sheep (Correia 1993).
Although the heterogeneity typical of the Iberian agro-forestry systems can be considered a biodiversity promoter by providing complementary resources throughout the year, management options, specifically in the montado, can have a negative impact on mesopredators, due for example to high grazing pressure and human disturbance (Rosalino et al. 2009a).
Another negative impact of agriculture practices in montado, and a direct result of human interference, is the understory removal. Shrub cover presence is an ecological requisite for many species, either because it acts as a food source or a shelter provider (Lozano et al. 2003, Mangas et al. 2008). Shrub removal, either to prevent fires (Mangas et al. 2008) and manage plantations, or due to the effect of livestock or other large herbivores (Dotta & Verdade 2007, Lozano et al. 2007), has a deleterious effect directly over the mesocarnivores, as it limits shelter and food availability (e.g. small mammals and wild rabbits, Oryctolagus cuniculus Linnaeus, 1758) (Lozano et al. 2003, 2007, Gonçalves et al. 2012).
The intensive understory removal along with other human practices stress the need to maintain habitat connectivity, something hard to achieve in agricultural lands (Rosalino et al. 2009a, Verdade et al. 2011). However, water courses and reservoirs with riparian vegetation assume a major role fulfilling this requirement (Virgós 2001). These habitats are valuable not only to carnivores, but to wildlife in general (Virgós 2001, Santos et al 2011). In a semi-arid and largely deforested environment, such as the
montado, their importance is enhanced (Gonçalves et al. 2012). More biodiverse than the surrounding
areas, riparian vegetation patches are able to provide water, food (either fruit, small mammals, birds or even invertebrates), shelter and antipredator cover for mesocarnivores (Virgós 2001, Rosalino et al. 2009a, Verdade et al. 2011). However, other non-matrix habitats can assume high relevance in the
5
guaranteed source of food, due to their high availability in fruits, invertebrates and rodents (Rosalino et al. 2005b, 2009a, 2010, Requena-Mullor et al. 2016, da Silva et al. 2011).
Industrialization and intensification of agriculture practices, coupled with a rural exodus that occurred in the 60’s and 70’s, led to changes in human intervention in montado and some areas of this agro-forestry system have been abandoned, causing the growth of scrubland and loss of habitat heterogeneity (Correia 1993, 2000, Delibes-Mateos et al. 2009, Gonçalves et al. 2012). These recent changes have distinct effects on animal communities. While some species, such as lagomorphs and the partridge (Alectoris rufa Linnaeus, 1758) were negatively impacted (Delibes-Mateos et al. 2009), others benefited, like the wild boar (Sus scrofa Linnaeus, 1758), resulting in growing populations that impact the ecosystem (Massei & Genov 2004, Delibes-Mateos et al. 2009). Thus, resulting from the montado abandonment, mesocarnivores can be prejudiced both by the lower prey diversity and abundance and the increasing densities of wild boars (Massei & Genov 2004, Barrios-Garcia & Ballari 2012).
1.4 Study aims
Considering land abandonment as a potential threat to mesocarnivore communities inhabiting
montado areas, this study aims (i) to assess the occupancy patterns of mesocarnivores in an area subject
to a process of land abandonment over the last years (Serra de Grândola), (ii) to determine what environmental covariates determine the detected patterns, and (iii) to understand if interspecific competition processes may be constraining the way species use the available habitats. Moreover, by comparing our results with data previously obtained in a managed montado area (Companhia das Lezírias – Santos 2014), we will further discuss if management actions influence occupancy patterns, thus weighing human role on mesocarnivores communities structuring.
We hypothesize that responses to land abandonment and management practices are species and context-specific. In fact, the local mesocarnivore fauna is expected to react differently according to the different stages of understory development, with more agile species such as the fox benefiting from denser understories as opposed to the badger that by its morphology is better adapted to more open areas. Additionally, we expect that sites capable of providing constant food sources will enhance the target species occupancy probability, highlighting the capacity of riparian vegetation, orchards and olive groves to fulfill this role, even though covering small areas.
Finally, we expect a management level specific response. However, we predict that higher livestock pressure is prejudicial for most, if not all, mesocarnivores. As for the level of intervention, a moderate approach to shrub clearance should be favorable in contrast to the lack or excessive management, since it is a spatial heterogeneity promotor.
7
2. Study areaThe focal study area (Serra de Grândola), is a coastal mountain located in Grândola municipality, SW Alentejo in Portugal (Figure 3.1). Within this region, we defined a 30km2 area that includes the field
station of the Centre for Ecology, Evolution and Environmental Change (cE3c) - “Herdade da Ribeira Abaixo” (38°07′N, 8°36′W).
The area is characterized by a Mediterranean climate, showing a marked seasonality, with dry, hot summers and mild winters. The mean annual temperature is 15.6ºC and the precipitation reaches 500mm/year (Santos-Reis & Correia 1999).
Figure 2.1 - Study area location, “Herdade da Ribeira Abaixo” limits and camera trapping stations with associated 325m radius buffers, corresponding to the smallest core area of the mesocarnivores species present in the study area - the common genet.
The entire region is crossed by multiple water courses, most of them being temporary streams, belonging to Sado’s hydrographic basin. Ranging from 150m to 270m high, the region’s topography is slightly rolling (Santos-Reis & Correia 1999).
The predominant tree cover in Serra de Grândola is the cork oak, often encompassing holm oak patches and other small patches of Eucalyptus (Eucalyptus globulus) or pine (Pinus pinaster) stands. Riparian vegetation stretches are also widely dispersed throughout the study area, being mainly composed by black poplars (Populous nigra), grey willows (Salix atrocinerea), narrow-leafed ashes (Fraxinus angustifolia) and wild blackberries (Rubus ulmifolius) (Santos-Reis & Correia 1999). Within the cork oak matrix, the understory vegetation is diverse but largely dominated by two cistaceae species (Cistus ladanifer and Cistus salvifolius), topped lavender (Lavandula stoechas luisieri) and strawberry tree (Arbutus unedo) (Santos-Reis & Correia 1999).
Although only two tarred roads cross the study area, the entire region is connected by a network of dirt roads, although only a few have regular use.
8
Despite the low human density (177 residents in Santa Margarida da Serra and 10657 in Grândola, INE 2011) the landscape is largely impacted by the human activities that occur throughout the study area. This human impact is still moderate and shows some recovery of the traditional activities, following the rural exodus that occurred a few decades ago. Apart from cork extraction, which is the main and more profitable activity within this region, small-sized agriculture is a common practice, with small gardens, orchards and olive groves being scattered throughout Serra de Grândola. Livestock farming is also an important economic activity in Grândola, especially cattle, sheep and Iberian black pig breeding (CM Grândola). Additionally, game importance has been rising in the last decades, with wild species such as wild boar and partridge being hunted from August to May (ICNF 2015).
Mediterranean ecosystems are considered biodiversity hotspots due to its high numbers of species, especially endemisms (Myers et al. 2000). The study area is no exception and a number of Iberian and Portuguese vertebrate endemisms inhabit the region, such as Cabrera’s vole (Microtus cabrerae Thomas 1906) and Iberian midwife toad (Alytes cisternasii Boscá 1879) (Cabral et al. 2005). Although not including many conservation priority species, the mesocarnivore community of Serra de Grândola is diverse incorporating eight out of 10 species inhabiting South Portugal (Santos-Reis & Correia 1999) and of the 14 existing in Portugal (Cabral et al. 2005): red fox (Vulpes vulpes Linnaeus, 1758), weasel (Mustela nivalis Linnaeus, 1766), European polecat (Mustela putorius Linnaeus, 1758), stone marten (Martes foina Erxleben, 1777), European badger (Meles meles Linnaeus, 1758), Eurasian otter (Lutra
lutra Linnaeus, 1758), common genet (Genetta genetta Linnaeus, 1758) and Egyptian mongoose
(Herpestes ichneumon Linnaeus, 1758). Of these eight, none has an endangered status in Portugal (although the polecat is classified as “Data Deficient” in the Portuguese Red List Book, Cabral et al. 2005) and two have a North African origin (common genet and Egyptian mongoose, Dobson 1998). Only two of these carnivores are game species, namely the red fox and the Egyptian mongoose (Santos-Reis & Correia 1999). According to previous studies the most abundant mesocarnivores in this region are the common genet, the stone marten and the Egyptian mongoose (e.g., Santos-Reis & Correia 1999, Rosalino et al. 2005c).
9
3. Methods3.1 Sampling design and camera trapping protocol
The mesocarnivores community of Serra de Grândola was monitored using a camera trapping approach, a non-invasive technique that requires low human investment during the course of the study, causes no harm to the environment, does not disturb the target species and can be used in a wide range of habitats and climatic conditions (Silveira et al. 2003). Most of all, camera trapping is a good method to study low abundant and cryptic species, such as carnivores, being adequate and widely used in wildlife inventorying, community monitoring and occupancy modeling studies (Ferreras et al. 2016).
Using the QGIS software (Version 2.4 Chugiak, QGIS Development Team 2014), we set a 1x1 km grid (30 km2 total) within the study area limits, with 30 sampling stations being defined. This fixed grid
was superimposed to the study area using two criteria: (i) cover the main habitats in the area, so that the region’s spatial heterogeneity could be represented; and (ii) ensure that each individual has an equal chance of being detected (Sarmento et al. 2010), considering that the average ±1km spacing (Mean= 1032.28 meters; SE= 27.64; MIN= 719.91 m; MAX= 1558.05 m) was enough to minimize data spatial autocorrelation (Santos 2014).
In each sampling station one camera trap (Model: Moultrie M-990i Trail Camera) was set either on a tree or on an artificial stake (when no adequate tree was found nearby the sampling point centroid), at a height of 20-25 cm above ground, to increase the target species detectability (Swann et al. 2004). The trap’s sensor was programmed to maximum sensibility and the cameras were programed to take a burst of 3 photos once triggered, with a minimum delay of 5 seconds between each burst. Each 15 days, every camera was checked for replacement of memory cards and batteries.
Primary photo analysis was implemented using “CameraBase” software (V1.7, Tobler 2015). Excluding the cases where multiple individuals were identified, photos of the same species within a 30 minutes time frame were considered a single capture, decreasing thus the error of considering the same wandering individual multiple times (Davis et al. 2011).
Sampling lasted for 4 months, and took place from December 2015 to the beginning of April 2016. This sampling period guarantees that the study overlapped the target species non-breeding period (Loureiro et al. 2012), ensuring the closed population assumption required by the analytical methods used (See 3.3).
Mesocarnivore camera trapping results (global and per species) were expressed as a Relative Abundance Index (RAI), as it allows comparing results among species, regions or studies (Jenks et al. 2011). To estimate this index, all detections for each species are summed for each camera trap, multiplied by 100 and divided by the respective number of camera trap-days. We also estimated the naïve occupancy for each mesocarnivores species, representing the proportion of cameras/sites at which each target species was detected (Monterroso 2013).
3.2 Sampling stations characterization
Based on a review of the target species ecological requirements, a set of environmental variables capable of influencing habitat choice and the degree of use by mesocarnivores was selected. We divided those variables into three categories: “Habitat” (Table 3.1), “Food resources” and “Disturbance” (Table 3.1) and a forth variable category was also considered, evaluating the role of competition (Table 3.1). Each camera –trapping station was characterized using the full set of variables.
10
Table 3.1 - “Habitat”, “Food resources”, “Disturbance” and “Interspecific Competition” variables used in model construction. Habitat types identified in Serra de Grândola and its defining characteristics (named species are considered the
dominant ones in each habitat). RAI – Relative abundance index; NCap/100TD – number of captures per 100 trap days.
Variable Code Unity Description
Habitat
Tree Cover Understory
Montado without shrubs (Shrub cover <10%) MWS Km2 Quercus suber L. Quercus ilex L. Cistus salviifolius L. Cistus ladanifer L. Lavandula stoechas L. Arbutus unedo L. Montado with sparse
shrubs (Shrub cover >10% and <50%) MSS Km2 Quercus suber L. Quercus ilex L. Cistus salviifolius L. Cistus ladanifer L. Lavandula stoechas L. Arbutus unedo L. Montado with dense
shrubs (Shrub cover >50%) MDS Km2 Quercus suber L. Quercus ilex L. Cistus salviifolius L. Cistus ladanifer L. Lavandula stoechas L. Arbutus unedo L.
Strawberry tree SbT Km2 Arbutus unedo L.
Cistus salviifolius L. Cistus ladanifer L. Lavandula stoechas L.
Arbutus unedo L.
Pine stand PinS Km2 Pinus pinaster Aiton Non specified or
absent
Eucalyptus stand EucS Km2 Eucalyptus globulus Labill. Non specified or
absent
Olive grove OliG Km2 Olea europaea L. Non specified or
absent
Scrubland Scru Km2 Absent
Cistus salviifolius L. Cistus ladanifer L. Lavandula stoechas L.
Arbutus unedo L.
Open field Open Km2
Absent
Riparian vegetation RipV Km2
Populos nigra L. Salix atrocinerea Brot. Fraxinus angustifólia Vahl
Others
Rubus ulmifolius
Schott
Juncus spp.
Orchard Orch Km2
Fruit trees, crops, grown species Urban/ Human
infrastructures Urb Km
2 Absent Absent
Landscape Diversity LDiv 0-1 Simpson’s Landscape Diversity Index
Food resources
Orchard distance DOrc meters Distance from the buffer centroid to the nearest orchard
Olive grove distance DOli meters Distance from the buffer centroid to the nearest olive grove
Riparian vegetation
distance DRip meters
Distance from the buffer centroid to the nearest riparian vegetation patch
Riparian vegetation
extension ERip meters
Extension of riparian vegetation patch inside the buffer
11
Table 3.1 - “Habitat”, “Food resources”, “Disturbance” and “Interspecific Competition” variables used in model construction. Habitat types identified in Serra de Grândola and its defining characteristics (named species are considered the
dominant ones in each habitat). RAI – Relative abundance index; NCap/100TD – number of captures per 100 trap days (Cont.)
Variable Code Unity Description
Disturbance
Road distance DRoa meters Distance from buffer centroid to the nearest road
Road extension ERoa meters Extension of main roads inside the buffer
Urban distance DUrb meters Distance from buffer centroid to the nearest urban center/house, inhabited or with frequent use
Livestock LSto NCap/100TD Livestock RAI
Wild boar SusS NCap/100TD Wild boar RAI
Interspecific Competition
Red fox Fox NCap/100TD Competing with all the remaining species
European badger Badg NCap/100TD Competing with the Red Fox
Egyptian mongoose Mong NCap/100TD Competing with the Red Fox
Stone marten Mart NCap/100TD Competing with the Common Genet
Common genet Gene NCap/100TD Competing with the Stone Marten
The “Habitat” variables consisted of the proportion of each habitat type (whose categories were defined a priori according to the study area land cover map) inside a 325m radius buffer around each camera trap (Figure 3.1). To ensure comparative purposes, the buffer size was the same as in Santos (2014) at Companhia das Lezírias, which was chosen to reflect the smallest core area of the target community of Santos’ study, which was that of the common genet (core area = 0.34 km2, Santos-Reis et al. 2004), thus
enabling both studies comparisons.
Due to the irregular topography of the area and difficulty in assessing the accurate land cover classes, the buffer area was divided into a grid of 50x50 meters. In each square the dominant habitat type was visually determined (Table 3.1) and, for analytical purposes, 50m2 of that habitat was assigned to the
corresponding square (Figure 3.1); the total proportion of each habitat type within the buffer was estimated by summing up the area of all squares where that habitat dominated (i.e. n x 50m2) and
dividing it by the buffer area.
With the resulting data, we calculated the “Landscape diversity” variable, using the Simpson’s Landscape Diversity Index (Santos 2014), that measures the patch diversity per buffer (Table 3.1). It equals 1 minus the sum of the squared proportional abundance of each patch type, for each buffer, and its results ranges from 0 (when there is only one habitat type in the buffer) to 1, increasing with the number of habitat types inside the buffer.
12
Figure 3.1 - Habitat cover in each trapping station 325m radius buffer.. Herdade da Ribeira Abaixo limitis (in red) and
13
The “Food resource” category was composed by variables representing the distance between the camera position (i.e. the sampling station) and the closest site where important mesocarnivores’ food resources (e.g. vertebrates, fruits and insects) were available (Table 3.1), namely gardens, olive groves and riparian vegetation (Rosalino & Santos-Reis 2009).
Human presence, irrespective of its intensity, is considered to have a negative impact in the carnivore community (Jepsen et al. 2005, Rosalino et al. 2009a). Thus the “Disturbance” category included some of the factors known to cause a negative impact on the target species, namely houses (Jepsen et al. 2005), roads (Jepsen et al. 2005) and livestock farming (Lozano et al. 2007)(Table 3.1). Thus we estimated the distance from the camera to the nearest home or urban area and main roads, dirt or tarred. We also determined the presence of livestock in the vicinity of the sampling point, which in this region is composed mainly by sheep (Ovis aries Linnaeus 1758), goats (Capra hircus Linnaeus 1758) and domestic pigs (Sus scrofa). Wild boars may also have a negative impact on mesocarnivores’ presence (Lozano et al. 2007, Massei & Genov 2004) and, therefore its presence nearby the sampling points was also considered a disturbance factor. Data regarding livestock and wild boar presence were collected via camera trapping and, similarly to those of mesocarnivores, expressed as a Relative Abundance Index (RAI) (Jenks et al. 2011).
The “Interspecific competition” category (Table 3.1) represents the effect of the remaining mesocarnivore species on the target species and was used as a surrogate of competition. Therefore, we considered that foxes, due to its high densities and larger body size, could have a strong impact on every species. Since badgers and mongooses have distinct activity patterns and are cursorial species, they might have an impact only on the red fox, which is active in all day periods and is also cursorial (Santos et al. 2007). The genet and the stone marten are similarly sized and the only two arboreal species, and therefore we considered that they would mainly compete between themselves (Santos et al. 2007).
3.3 Statistical analysis
To evaluate which factors might be affecting mesocarnivore species presence/absence probability at the selected trapping stations, we used a statistical approach that has been commonly used with this type of detection data and that accounts for the bias associated with imperfect detectability: occupancy modeling (Sollmann et al. 2012, MacKenzie et al. 2002). We developed single season, single species occupancy models (MacKenzie et al. 2002), which are likelihood-based models that estimate the probability of a species existing in each place (occupancy - Ѱ), assuming that it remains constant during the study period (which was assured by our sampling strategy; see section 4.2). These models also take in consideration the probability of detection (p) for each species (MacKenzie et al. 2002), rather than considering it 1 (i.e. perfect detection), meaning that a species using the area will be detected by the camera (an assumption often not fulfilled). To assess the fit of the best models to the observed data, we used the goodness of fit test for single season occupancy models based
on Pearson’s chi-square, as
suggested by
MacKenzie & Bailey (2004). This test also allows estimating the overdispersion parameter ĉ to test data overdispersion (MacKenzie & Bailey, 2004).The sampling period was divided in nine 14-days sampling occasions, with the success or failure of capturing each species in each occasion being converted into a binary code: 0 when there were no captures and 1 when at least one capture of the target species was recorded (Sarmento et al. 2010).
Due to the high number (N=22) of environmental variables considered, which may increase type-II errors (i.e. considers the species is present while in fact it is absent) and lead to models over-fitting (Legendre & Legendre 1998), we used a Principal Components Analysis (PCA) to reduce variables dimensionality from the habitat categories while still retaining much of the original dataset information (Zuur et al. 2007). For the modelling procedures we then selected the principal components that
14
accounted for >90% of the total data variability (Santos et al. 2016) and used Principal Components scores as variables. All habitat related variables were used in the PCA, with the exception of “Riparian Vegetation” and “Landscape diversity” which, due to their high ecological relevance for mesocarnivores, were included as independent variables in the models (Matos et al. 2009). To account for variables multicollinearity we tested the correlations between variables included in the “Food Resources” and “Disturbance” categories, by using a Spearman’s correlation test. When two variables were highly correlated (i.e. r>0.70), we excluded the one with less ecological meaning. This led to the removal of two variables: road extension and riparian vegetation extension inside the buffers, which were correlated to road distance and riparian vegetation distance, respectively. Moreover, all candidate variables were standardized to z-scores in order to facilitate the results interpretation (i.e. model coefficients are comparable) and to avoid model convergence problems (Santos et al. 2016).
Models building was a two-moment process. First, we test what variables might be influencing the probability of detection for each species, assuming a constant probability of occupancy. We tested the variables of the “Habitat” category, individually, and selected the best overall model.
Then, as a second step, using the best model for the probability of detection determined in the first step, we tested the variables influencing the probability of occupation, for each of the four variable categories, both individually and combined, and selected the best models in each one. After selecting the best models for each category, we built new models integrating all those variables included in the partial best models.
Model selection was based on the Akaike’s Information Criterion (AIC) corrected for small samples (AICc) (Burnham & Anderson 2002). Candidate models were ranked by its AICc and all those with ΔAICc ≤2 (i.e., AICc difference to the lower AICc) were considered best fitting. As for the cases where the parameter ĉ indicated overdispersion, the chosen criterion was QAICc (Burnham & Anderson 2002). QAICc is a quasi-likelihood information criterion used for overdispersed count data (MacKenzie & Bailey 2004).
When more than one model was identified as the best model according to the mentioned criteria, we used a model averaging approach to estimate variables coefficients and confidence intervals (Burnham and Anderson 2002).
All the statistical analyses of this study were performed with R v3.3.0 software (R Development Core Team 2016). Occupancy models were built using the “unmarked” (Fiske and Chandler 2011) (occu function) and “AICcmodavg” (Mazerolle 2016) (mb.gof.test function, for testing goodness of fit;
15
4. Results4.1 Habitat characterization
By using the Principal Components Analysis (PCA), it was possible to reduce habitat dimensionality to two principal components, which accounted for 96.5% of the total data variability. PCA1 showed a positive loading of montado with dense shrubs and negative loadings of montado with sparse shrubs and without shrubs, explaining 73.3% of the total variation (Table 4.1). Other 23.2% of data variability is explained by PCA2, with positive loadings of montado without shrubs and with dense shrubs, while having negative loadings of montado with sparse shrubs (Table 4.1).
Table 4.1 - Principal Components Analyses results of the Habitat category. Explained variance and loadings presented for
the first two principal component axis are presented.
PCA1 PCA2 Proportion of Variance 0,733 0,232 Cumulative proportion 0,733 0,964
Loadings Montado without shrubs -0,491 0,66 Montado with sparse shrubs -0,295 -0,738
Montado with dense shrubs 0,819 0,128
4.2 Mesocarnivore capture success
During the four-month sampling period we registered 922 independent “captures” of the five mesocarnivore species, over 2788 effective trap days. This implies an average capture rate of 33.07 captures per 100 trap days (1 capture each 3.02 trap days) (Table 4.2). The average capture rates ranged from 17.54 (red fox) to 2.91 (stone marten) captures per 100 trap days. Being the second most captured species, the badger showed the lowest naïve occupancy, i.e. the badger was detected in the lowest number of sites. All the other species were widespread in the study area (naïve occupancy > 0.75) and, apart from the stone marten, were consistently “captured”. Another mesocarnivore was detected in this survey, the Eurasian otter, with 4 independent captures in two sites. However, the species strict dependence on aquatic habitats led to its exclusion from further analysis as the sampling design did not accounted for this dependence.
Table 4.2 - Camera trap efforts and mesocarnivores captures in Serra de Grândola from December 2015 to April 2016.
RAI – relative abundance index.
Camera trap effort Mesocarnivore “captures”
Trap Stations 30 Species Vulpes vulpes Martes foina Meles meles Herpestes ichneumon Genetta genetta All Trapping Days (TD) 2788 Nº of photos 489 81 129 114 109 922 Mean TD per station 93 Average RAI 17,54 2,91 4,63 4,09 3,91 33,07 Naïve occupancy 0,93 0,77 0,63 0,77 0,83 1
16
4.3 Patterns of mesocarnivore habitat useOf the five terrestrial mesocarnivore species detected in the area, the development of occupancy models for the fox and genet was not possible, due to these species high naïve occupancies. As for the remaining three species, the best models differed but some commonalities (e.g., the role of riparian vegetation) were found among the influencing variables (Table 4.3).
Table 4.3- Best models (ΔAICc < 2) for the mongoose, badger and stone marten reflecting the variables influencing the patterns of habitat use. The null model is always presented, even when not included in the best model set.
Species Model Ѱ p K AICc ΔAICc AICc w
Mongoose null . RipV 3 272.27 0.00 0.16 Hi1 DRip 4 273.18 0.91 0.10 Hi2 PCA2 4 273.82 1.56 0.07 Hi3 Fox 4 274.00 1.73 0.07 Hi4 DOrc 4 274.02 1.75 0.07 Hi5 DOrc+DRip 5 274.04 1.77 0.07 Hi6 DRip+Fox 5 274.10 1.84 0.06 Hi7 DUrb 4 274.20 1.93 0.06 Badger Mm1 DUrb+Fox RipV 5 230.21 0.00 0.19 Mm2 Fox 4 231.28 1.07 0.11 Mm3 DUrb 4 231.42 1.2 0.10 null . 3 234.11 3.9 0.03
Stone Marten Mf1 PCA1 PCA1 5 190.14 0.00 0.59
null . 4 192.19 2.04 0.21
Ѱ – occupancy; p – detection probability; K – number of variables in the model; AICc – Akaike Information Criterion corrected for small samples; ΔAICc – model AICc difference to the lowest AICc; AICc w – Akaike weight.
RipV – Riparian vegetation area inside the buffers; PCA1 and PCA2 refer to the Habitat PCA results; DUrb – Urban distance; DRip – Riparian Vegetation distance; DOrc – Orchard distance; Fox – Fox role as competitor.
Even though the wild boar is considered to have a potential negative influence, this species was eliminated from the model construction since it was over parametrizing the beta coefficient estimates.
Egyptian mongoose model
This species detectability was mainly influenced by the area covered by riparian vegetation, being positively influenced by its presence (β=0.32 ±0.15 [0.07; 0.57]). Despite having 8 models considered as the best models (ΔAICc≤2), the null model for occupancy is included in this set. Since no model had an AICc weight >0.90, emerging as a single top ranked model, a model averaging approach was used. From all the variables, distance to riparian vegetation was more frequently included in the models (3 times), followed by the distance to orchards and fox presence (2 times each). However, it is not possible to infer about any variable influence direction due to all confidence intervals overlapping zero (Table 4.4).
European badger model
Similarly to the mongoose, riparian vegetation also emerged as the best variable explaining badger detectability. Thus, this variable showed a positive effect (0.39 ±0.17 [0.11; 0.68]) on this species detection. Three models ranked as the best fitting models (ΔAICc≤2), featuring the same two variables, both individually and combined: distance to urban centers and fox presence. However, model averaged