CERN-EP-2017-249 2018/07/11
CMS-FSQ-16-008
Measurement of the underlying event activity in inclusive
Z boson production in proton-proton collisions at
√
s
=
13 TeV
The CMS Collaboration
∗Abstract
This paper presents a measurement of the underlying event activity in proton-proton collisions at a center-of-mass energy of 13 TeV, performed using inclusive Z boson production events collected with the CMS experiment at the LHC. The analyzed data correspond to an integrated luminosity of 2.1 fb−1. The underlying event activity is quantified in terms of the charged particle multiplicity, as well as of the scalar sum of the charged particles’ transverse momenta in different topological regions defined with respect to the Z boson direction. The distributions are unfolded to the stable particle level and compared with predictions from various Monte Carlo event gener-ators, as well as with similar CDF and CMS measurements at center-of-mass energies of 1.96 and 7 TeV respectively.
Published in the Journal of High Energy Physics as doi:10.1007/JHEP07(2018)032.
c
2018 CERN for the benefit of the CMS Collaboration. CC-BY-4.0 license
∗See Appendix A for the list of collaboration members
1
Introduction
The production of particles in a hadron-hadron collision includes contributions from parton-parton scatterings, initial-state radiation (ISR), final-state radiation (FSR), and beam-beam rem-nant (BBR) interactions. The large parton densities accessible in proton-proton (pp) collisions at the CERN LHC result in a significant probability of more than one parton-parton scattering in the same pp collision, a phenomenon known as multiple parton interactions (MPI). The combi-nation of particle production from MPI (excluding the parton-parton scattering with the highest momentum transfer) and BBR interactions is commonly called the underlying event (UE). The
UE usually produces particles at low transverse momentum (pT) that cannot be experimentally
distinguished from the particles produced from ISR and FSR. These processes cannot be com-pletely described by perturbative quantum chromodynamics (QCD) calculations, and require phenomenological models, whose parameters are tuned by means of fits to data.
The experimental measurement of the UE is often based on a process that defines the scale of the hardest parton-parton scattering, along with a phase space region with enhanced sensitiv-ity to particle production associated with the UE activsensitiv-ity. A number of measurements [1–9] have been performed by the Tevatron and LHC experiments at various center-of-mass ener-gies, ranging from 0.3 TeV to 13 TeV, and using a variety of hard processes including events with high-pTcharged particles or jets, Z+jets, and tt+jets. Measurements of the UE associated
with different hard processes are useful to test the level of universality of the underlying MPI dynamics. Events with a harder scale are expected to correspond, on average, to proton-proton interactions with a smaller impact parameter and therefore with more MPI [10]. Such increased UE activity is observed to plateau at high energy scales, which indicates that the smallest im-pact parameters have been reached and hence maximum matter overlap in the pp collision [11].
This paper presents a measurement of the UE activity based on events with inclusive Z →
µ+µ−production at √
s =13 TeV. Underlying event measurements based on Z boson
produc-tion have been carried out previously at √s = 1.96 TeV [9] and 7 TeV [3, 8] by Tevatron and
LHC experiments. Z boson production is a process with a clean experimental signature and well understood theoretically, allowing clear identification of the UE activity. Measurements with Z bosons also make it possible to partially distinguish the MPI and ISR/FSR contribu-tions [3, 12]. In this paper, the properties of the UE are measured as a function of conventional observables related to the impact parameter of the pp collision, such as the number of charged particles and the scalar sum of their pT. The data are corrected for detector effects and
com-pared to Monte Carlo (MC) event generators, as well as with earlier results at√s=1.96 TeV [9] and 7 TeV [3].
The outline of the paper is as follows. Section 2 describes the data and simulated samples used for the validation and unfolding studies. Section 3 gives a brief description of the CMS detector, whereas Section 4 describes the event and track selection criteria, and the observables used for quantification of the UE. The unfolding procedure and systematic effects are discussed in Section 5, and the final results are presented in Section 6. Finally, the analysis is summarized in Section 7.
2
Data and simulated samples
The analysis is performed on a sample of pp collisions at √s = 13 TeV, corresponding to an
integrated luminosity of 2.1 fb−1. Data were collected with the CMS detector in 2015 when the average number of inelastic collisions per bunch crossing (pileup) was about 20.
For the evaluation of the event and track selection efficiencies, signal and background pro-cesses are simulated at next-to-leading order (NLO) accuracy [email protected] [13] and, for
single top production, withPOWHEG 2.0 [14, 15]. To study the model dependence, the Z+jets
events are also simulated at leading order (LO) with MADGRAPH5 2.2.2 [16, 17] combined with
PYTHIA8 [18] using the CUET8PM1 [19] tune. Diboson (WW, WZ and ZZ) as well as
multiple-jet production, via strong interaction processes, are generated at LO withPYTHIA8 standalone. The NNPDF3.0 [20] set is used as the default set of parton distribution functions (PDFs) for all generated LO and NLO samples.
These simulated samples are processed and reconstructed in the same manner as the collision
data. The detector response is simulated in detail by using the GEANT4 package [21]. The
samples include additional pileup pp interactions, with a multiplicity distribution matching that observed in data.
The measured UE distributions are unfolded to correct for detector effects and selection effi-ciencies, and compared to various MC simulation predictions:
• MADGRAPH+PYTHIA8: Z+jets events are generated with MADGRAPH, followed by
parton showering and hadronization withPYTHIA8 (CUET8PM1 tune). The MAD
-GRAPHgenerator includes up to 4 partons in the matrix element calculations, while
additional jets can be generated byPYTHIA8 during parton showering.
• POWHEG + PYTHIA8: Z+jets events are produced up to NLO accuracy with the
POWHEG ‘Multiscale-improved NLO’ method [15]. ThePYTHIA8 generator assumes
pT-ordered parton showers, and the latter are interleaved with MPI. Tune CUET8PM1
is used for hadronization and parton showering. To quantify the effect of MPI, events are also simulated without MPI. To study the impact of color-reconnection (CR) between final state partons,PYTHIA8 events are also simulated without CR.
• POWHEG+HERWIG++: To further investigate the model dependence,POWHEG
events are also hadronized using HERWIG++ [22] with tune EE5C [19]. HERWIG++,
unlike PYTHIA8, generates angular-ordered parton showers. It simulates MPI
ac-cording to a model similar to that ofPYTHIA8, with tunable parameters for the reg-ularization of the parton-parton cross section at very low momentum transfers, but without the interleaving with parton showers. In most models, the number of MPI follows a Poission distribution with a mean that depends on the overlap of the mat-ter distributions of the hadrons.
Monte Carlo events are generated at√s= 7 and 13 TeV, as well as for proton-antiproton colli-sions at√s=1.96 TeV.
3
The CMS detector
The central feature of the CMS apparatus is a superconducting solenoid of 6 m internal diam-eter. Within the solenoid volume are a silicon pixel and strip tracker, a lead tungstate crystal electromagnetic calorimeter, and a brass and scintillator hadron calorimeter, each composed of a barrel and two endcap sections. Forward calorimeters extend the pseudorapidity coverage provided by the barrel and endcap detectors. Muons are measured in gas-ionization detec-tors embedded in the steel flux-return yoke outside the solenoid, covering the pseudorapidity range|η| < 2.4, with detection planes based on three technologies: drift tubes, cathode strip chambers, and resistive-plate chambers.
silicon pixel and 15 148 silicon strip detector modules and is located in the 3.8 T field of the superconducting solenoid. For nonisolated particles of 1 < pT < 10 GeV and |η| < 1.4, the track resolutions are typically 1.5% in pTand 25–90 (45–150) µm in the transverse (longitudinal)
impact parameter [23]. Matching muons to tracks measured in the silicon tracker results in a relative pT resolution for muons with 20 < pT < 100 GeV of 1.3–2.0% in the barrel and better
than 6% in the endcaps. The pT resolution in the barrel is better than 10% for muons with pT
up to 1 TeV [24].
A more detailed description of the CMS detector, together with a definition of the coordinate system used and the relevant kinematic variables, can be found in Ref. [25].
4
Experimental methods
4.1 Event selection
Events are selected online by requiring the presence of at least two isolated muon candidates with pT >17(8)GeV for the leading (subleading) muon. Offline, events are required to have at
least one well-reconstructed vertex [23] within±24 cm of the nominal interaction point along the z-direction. At least five tracks are required to be associated with the vertex, which should be at most 2 cm from the beam axis in the transverse plane. Muons are reconstructed with the particle-flow algorithm [26] and are required to satisfy identification criteria based on the number of hits in the muon detectors and tracker, the transverse impact parameter with respect
to the beam axis, and the normalized χ2 of the global muon track fit. The backgrounds from
jets misidentified as muons and from semileptonic decays of heavy quarks are suppressed by applying an isolation condition on the muon candidates. The relative isolation variable, Irel, for
muons is defined as: Irel=
[∑ pTcharged+max(0.,∑ ETneutral+∑ Eγ
T−0.5∑ pPUT )]
pµT . (1)
Here ∑ ETneutral and ∑ EγT are the sums of the transverse energies of neutral
hadrons and photons, respectively, in a pseudorapidity-azimuth cone of size ∆R ≡
√
(ηµ−ηneutral,γ)2+ (φµ−φneutral,γ)2 < 0.4 around the muon direction. The quantity
∑ pcharged
T represents the pT sum of the charged hadrons, in the same cone around the muon,
associated with the selected vertex. Finally,∑ pPUT is the pTsum of the charged hadrons, in the
same cone around the muon, not associated with the selected vertex. A muon is considered
isolated if Irel < 0.15. Misalignment in the detector geometry affects the measurement of
muons in a different manner for data and simulation. To account for this effect, different muon momentum corrections [27] are applied to data and simulated events.
Offline, the leading and subleading muons are required to have a pT larger than 20 and
10 GeV, respectively, so as to be in the region where the trigger efficiency is highest and pT
-independent [28]. These muons are required to be associated to the vertex with the largest value of the p2T sum of the tracks belonging to it. Events with two oppositely charged muons
are further required to have an invariant mass (Mµµ) in the window 81–101 GeV. After all
the selections, a high-purity sample of Z candidates is extracted with estimated background contributions, mainly from top quark and diboson processes, below 1%. About 1.3 million Z candidate events are left in the data, which is in agreement within 5% with the NLO simulation predictions.
4.2 Track selection
All charged particles, except the selected muons, with pT > 0.5 GeV and |η| < 2 are consid-ered for the UE study. To reduce the number of incorrectly reconstructed tracks, a high-purity reconstruction algorithm [29] is used.
The distance of closest approach between the track and the selected vertex in the transverse plane and in the longitudinal direction are required to be less than three times the respective uncertainties. These requirements help reduce contamination of secondary tracks from decays of long-lived particles, photon conversions, and pileup. Tracks with poorly measured mo-menta are removed by requiring σ(pT)/pT < 5%, where σ(pT) is the uncertainty in the pT
measurement. The track selection efficiencies in the data and simulated samples agree within 4–5%.
These selected charged particle tracks are used to construct the relevant UE observables, namely the particle density andΣpT density, which are defined as follows:
• Particle density: The average number of charged particles in an event per unit∆η∆φ
area.
• ΣpTdensity: The average of the scalar pTsum of all selected charged particles in an
event per unit∆η∆φ area.
Here,∆η = |ηZ−ηch|and∆φ = |φZ−φch|are the pseudorapidity and azimuthal separation between each charged particle and the Z boson. In order to enhance the sensitivity to the UE, observables are calculated in different phase-space regions defined with respect to the φ direction of the Z boson. These regions are classified as:
• towards region: ∆φ<60◦,
• transverse region: 60◦ <∆φ<120◦,
• away region: ∆φ>120◦.
The UE observables are studied as a function of the transverse momentum of the dimuon sys-tem (pµµT ).
5
Unfolding and systematic uncertainties
In order to compare data and predictions, the UE distributions are corrected to the stable parti-cle level (lifetime cτ >10 mm) with the iterative D’Agostini method [30], which also accounts for bin-to-bin migrations. In the present analysis, two-dimensional distributions are unfolded
with a response matrix constructed from events simulated with MADGRAPH+PYTHIA8.
The unfolded measured distributions may be distorted by a variety of systematic effects, as discussed below.
• Model dependence: The events simulated with MADGRAPH+PYTHIA8 reproduce
the measured pµµT distribution within 10–20%. The effect of this discrepancy on the final UE distributions is evaluated by reweighting the simulated sample so that it describes the measured pµµT distribution. These weights are applied to the re-sponse matrix used for the unfolding. The difference between the unfolded dis-tributions with and without these weight factors is 2–5%. An additional cross-check is performed by using response matrices constructed with events simulated with
the MADGRAPH + PYTHIA8 and the MC@NLO + PYTHIA8 event generators. The
constructed with these two generators is found to be less than 0.5%.
• Tracking efficiency: The tracking efficiency is known with an uncertainty of 4% [23, 31]. To estimate the effect of this uncertainty on the UE distribution, 4% of the tracks are randomly removed in the simulated events while constructing the response ma-trix. The effect on the unfolded distributions is approximately 4–6%.
• Pileup: Pileup events produce low-pTparticles that can contribute to the UE activity.
However, the effect of pileup is expected to be small in the present analysis because all tracks are required to originate from the same primary vertex. The effect of pileup is further reduced by the unfolding procedure because the simulated samples also include pileup. Any possible residual effect is evaluated by varying the pp inelastic cross section used in the simulation by 5%. The bias on the unfolded distributions is less than 0.5%.
• Trigger: The triggers used in the analysis require that the muons be isolated, which may bias the UE distributions. The effect of this requirement is evaluated by com-paring UE distributions obtained with and without the trigger requirement in the simulation. This affects the results by up to 0.1%.
• Physics background: The Z boson production events are required to be in the mass
window 81–101 GeV. In this region, there is a small (about 0.3%) contribution of dimuons from diboson and top quark decays. These background processes may bias the UE distributions because of the different event topologies and parton radi-ation patterns as compared to the Z boson events. The effect of these background processes is evaluated, using simulations, by comparing the UE distributions for the Z-boson events and for the Z-boson events combined with background processes. The UE distributions change by 0.5–1%.
• Muon momentum correction: The effect of the muon momentum corrections [27] is
studied by comparing the corrected data distributions with the ones without correc-tions. The resulting effect on the particle density is up to 0.4%, and up to 0.7% for theΣpTdensity distribution.
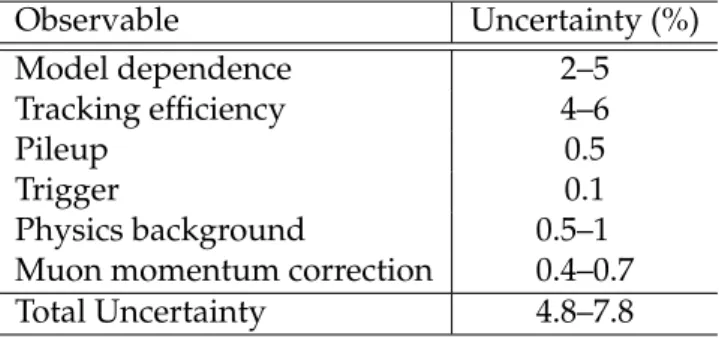
Table 1 summarizes the dominant systematic uncertainties in the particle and ΣpT densities.
Adding all aforementioned sources in quadrature results in a total systematic uncertainty of 4.8–7.8%, depending on the UE observable and particular bin.
Table 1: Summary of the systematic uncertainties in the particle andΣpT densities.
Observable Uncertainty (%) Model dependence 2–5 Tracking efficiency 4–6 Pileup 0.5 Trigger 0.1 Physics background 0.5–1
Muon momentum correction 0.4–0.7
Total Uncertainty 4.8–7.8
6
Results and discussion
Figure 1 shows the comparison of the measured UE activity in the towards, transverse, and away regions. The activity in the away region increases sharply with pµµT , but more slowly in the towards and transverse regions. This is expected as particle production in the away region is
mostly dominated by the hadronic recoil system, which is highly correlated with pµµT . Because of the large spatial separation, the contribution of the hadronic recoil is small in the transverse region, and becomes even smaller in the towards region. The activity in the three regions be-comes similar as pµµT approaches zero; this observation again corroborates the hypothesis that differences in the UE activity for the three regions are due to varying parton radiation contri-butions. Unlike the UE measurement with leading jet/track [3, 6], in the present analysis the UE activity is not zero when pTµµapproaches zero. This behavior reflects the fact that the initial scale in the Z boson events, given by the lepton pair invariant mass in the range 81–101 GeV, is already large enough to determine a significant overlap between the transverse parton den-sities of the colliding protons, and hence a large number of MPI. From the UE measurements using the leading charged particle (jet) approach [3, 6], it is observed that the MPI contribution reaches its maximal value at an energy scale of 5 (12–15) GeV. Above this energy, there is a slow rise in the number of particles produced, which is mainly attributed to the increase in the parton radiation contributions. In the present measurement, the minimum scale is set by the dimuon mass (81–101 GeV), which is larger than the energy where the MPI contribution satu-rates. Therefore, the increase in UE activity with pµµT should be mainly ascribed to the rise in the recoil hadronic contribution and associated ISR/FSR [3].
0 20 40 60 80 100 [GeV] µ µ T p 0.5 1 1.5 2 2.5 3 ] -1 [rad 〉 ch N 〈 )] φ∆ ( ∆η ∆ 1/[ CMS (13 TeV) -1 2.1 fb (GeV) < 101 µ µ 81 < M Charged particles | < 2) η > 0.5 GeV, | T (p + X -µ + µ → Z + X → pp Data (towards) Data (transverse) Data (away) 0 20 40 60 80 100 [GeV] µ µ T p 2 4 6 8 10 [GeV/rad] 〉 T p Σ 〈 )] φ∆ ( ∆η ∆ 1/[ CMS (13 TeV) -1 2.1 fb (GeV) < 101 µ µ 81 < M Charged particles | < 2) η > 0.5 GeV, | T (p + X -µ + µ → Z + X → pp Data (towards) Data (transverse) Data (away)
Figure 1: Unfolded distributions of particle density (left) andΣpTdensity (right) in Z events, as
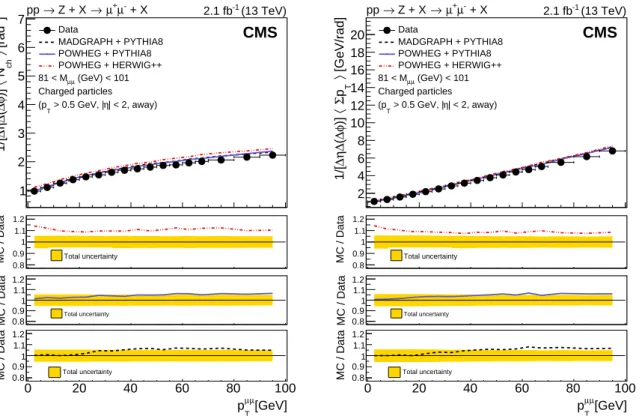
a function of pµµT in the towards (∆φ<60◦), transverse (60◦ <∆φ<120◦), and away (∆φ>120◦) regions. Error bars represent the statistical and systematic uncertainties added in quadrature. Figures 2–4 present data-model comparisons of the UE distributions as a function of the Z boson pT in the away, transverse, and towards regions, respectively. The bottom panel of each
plot presents the ratio of the simulated to the measured distributions. ThePOWHEG sample,
which usesHERWIG++ for parton showering and hadronization, overestimates the UE activity
by 10–15% in all topological regions, whereas when PYTHIA8 is used the measured
distribu-tions are reproduced within 5%. The MADGRAPH sample in combination with PYTHIA8 also
reproduces the measurement within 5%. TheMC@NLOpredictions (not shown in the figures)
have the same level of agreement with the data as MADGRAPH. Color reconnection between
the produced partons influences the multiplicity and pT of final-state particles. Its global
im-pact in the measured UE observables is evaluated by comparing thePYTHIA8 predictions with
and without CR, and is found to be negligible.
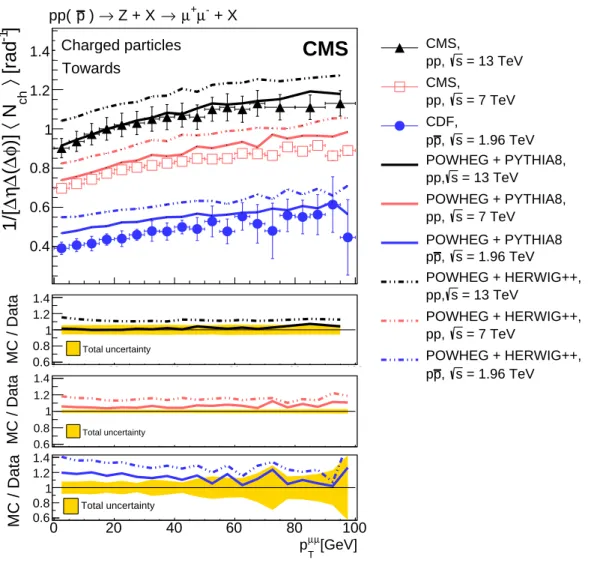
To understand the evolution of the UE activity with√s, the present measurement is compared
with results obtained at√s = 1.96 TeV at the Tevatron and at 7 TeV at the LHC. As the away
considered for this specific study. Figures 5–8 show the UE activity as a function of pTµµ at
√
s=1.96, 7, and 13 TeV. The predictions ofPOWHEGwithPYTHIA8 as well as withHERWIG++
are also shown. The ratios of the simulations to the measurements are plotted in the bottom
panel of each plot. ThePOWHEG +PYTHIA8 predictions reproduce the measurements within
10% at√s of 1.96 TeV and 7 TeV, and within 5% at 13 TeV. The combination of POWHEGand
HERWIG++ describes the measurements within 10–15, 10–20, and 20–40% at√s of 1.96, 7, and
13 TeV, respectively.
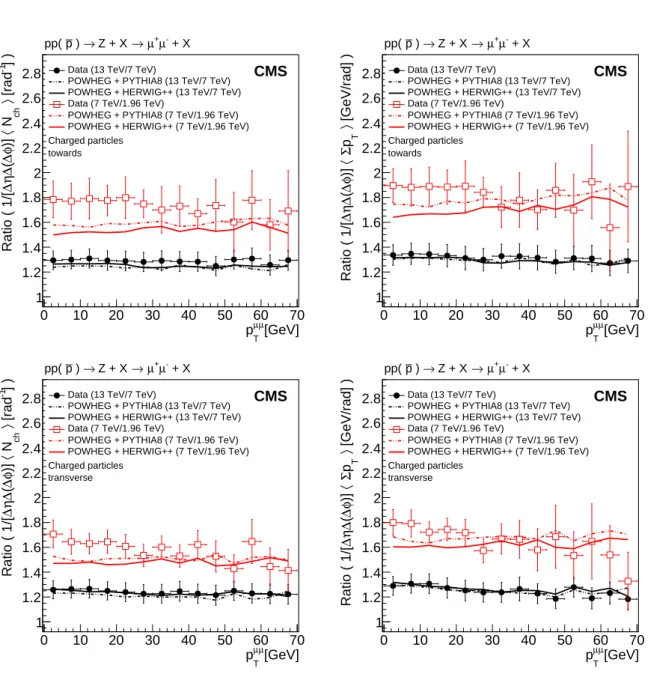
The data show a significant increase in the UE activity with√s, which is qualitatively described by the model predictions. The collision energy evolution is quantified in Fig. 9, which shows the ratio of the UE activities at 13 and 7 TeV, and at 1.96 and 7 TeV, for the data and the simula-tions. An increase of 25–30% in particle andΣpTdensities is observed as the collision energy
in-creases from 7 to 13 TeV. This behavior is quantitatively well described byPOWHEG+PYTHIA8
andPOWHEG+HERWIG++. As the collision energy increases from 1.96 to 7 TeV, the UE activity
increases by 60–80% for both the particle andΣpT densities. Event generators predict a slower
rise, but the agreement improves at higher values of pµµT . The increase in particle andΣpT
den-sities from 7 to 13 TeV is consistent with that observed in the leading jet/track analyses [3, 6]. To further quantify the energy dependence of the UE activity, events with a pµµT smaller than
5 GeV are studied. Setting an upper limit on pµµT reduces the ISR and FSR contributions and
the remaining UE activity stems mainly from MPI. With the requirement pµµT <5 GeV, the UE activity is similar in the towards and transverse regions. Therefore, the UE activity is combined in these two regions. Figure 10 shows the UE activity, with the pµµT < 5 GeV requirement, as a function of√s for data compared to model predictions. There is a significant increase, by a factor 2–2.5, as the collision energy rises from 1.96 to 13 TeV, which is qualitatively reproduced
by POWHEG. The energy evolution is better described by POWHEG with PYTHIA8, whereas
hadronization withHERWIG++ overestimates the UE activity at all collision energies. The
com-parison of the distributions with and without MPI indicates that the ISR and FSR contributions, which increase slowly with center-of-mass energy, are small.
The CUETP8M1 and EE5C tunes employed here are mostly obtained from fits to minimum-bias measurements and UE measurements with leading jets or leading tracks. The fact that these tunes reproduce globally well the present data supports the hypothesis that the UE activity is independent of the hard process. The present study also confirms that the collision energy dependence of the UE activity is similar for different hard processes. Unlike UE studies with a leading track/jet, the present measurements provide new handles to better understand the evolution of ISR, FSR, and MPI contributions separately, as functions of the event energy scale and the collision energy.
7
Summary
This paper presents a measurement of the underlying event (UE) activity using inclusive Z boson production events in proton-proton collisions at a center-of-mass energy of 13 TeV. The data correspond to an integrated luminosity of 2.1 fb−1. The UE activity, quantified in terms
of charged particle and ΣpT densities, is measured as a function of the pT of the muon pair
from the Z boson decay. The distributions are corrected for detector effects and compared to
various model predictions. The MADGRAPHandPOWHEGgenerators, with parton showering
and hadronization modeled withPYTHIA8 using the CUET8PM1 tune, reproduce the
measure-ments within 5%. The combination ofPOWHEGandHERWIG++ (tune EE5C) overestimates the
at 1.96 and 7 TeV. The UE activity almost doubles as the collision energy increases from 1.96 to 13 TeV. Monte Carlo event generators provide a reasonable description of the evolution of the UE activity as the collision energy rises from 1.96 to 13 TeV, although they tend to under-estimate its increase in the 1.96–7 TeV range. The overall good description of the UE activity in Z boson events by Monte Carlo generators previously tuned to minimum-bias and leading track/jet UE measurements confirms the universality of the physical processes producing the underlying event in pp collisions at high energies.
0 20 40 60 80 100 [GeV] µ µ T p 0.8 0.9 1 1.1 1.2
MC / Data Total uncertainty
0 20 40 60 80 100 [GeV] µ µ T p 0.8 0.9 1 1.1 1.2
MC / Data Total uncertainty
0 20 40 60 80 100 [GeV] µ µ T p 0.8 0.9 1 1.1 1.2
MC / Data Total uncertainty
0 20 40 60 80 100 [GeV] µ µ T p 1 2 3 4 5 6 7 ] -1 [rad 〉 ch N 〈 )] φ∆ ( ∆η ∆ 1/[ Data MADGRAPH + PYTHIA8 POWHEG + PYTHIA8 POWHEG + HERWIG++ CMS (13 TeV) -1 2.1 fb (GeV) < 101 µ µ 81 < M Charged particles | < 2, away) η > 0.5 GeV, | T (p + X -µ + µ → Z + X → pp 0 20 40 60 80 100 [GeV] µ µ T p 0.8 0.9 1 1.1 1.2
MC / Data Total uncertainty
0 20 40 60 80 100 [GeV] µ µ T p 0.8 0.9 1 1.1 1.2
MC / Data Total uncertainty
0 20 40 60 80 100 [GeV] µ µ T p 0.8 0.9 1 1.1 1.2
MC / Data Total uncertainty
0 20 40 60 80 100 [GeV] µ µ T p 2 4 6 8 10 12 14 16 18 20 [GeV/rad] 〉 T p Σ 〈 )] φ∆ ( ∆η ∆ 1/[ Data MADGRAPH + PYTHIA8 POWHEG + PYTHIA8 POWHEG + HERWIG++ CMS (13 TeV) -1 2.1 fb (GeV) < 101 µ µ 81 < M Charged particles | < 2, away) η > 0.5 GeV, | T (p + X -µ + µ → Z + X → pp
Figure 2: Unfolded distributions of particle density (left) andΣpT density (right) in Z events
in the away region as a function of pµµT , compared to various model predictions: MAD
-GRAPH+PYTHIA8 (dashed line),POWHEG+PYTHIA8 (solid line), andPOWHEG+HERWIG++
(dashed-dotted line). The bottom panels of each plot show the ratios of the simulations to the measured distributions. The bands in the bottom panels represent the statistical and systematic uncertainties added in quadrature.
0 20 40 60 80 100 [GeV] µ µ T p 0.8 0.9 1 1.1 1.2
MC / Data Total uncertainty
0 20 40 60 80 100 [GeV] µ µ T p 0.8 0.9 1 1.1 1.2
MC / Data Total uncertainty
0 20 40 60 80 100 [GeV] µ µ T p 0.8 0.9 1 1.1 1.2
MC / Data Total uncertainty
0 20 40 60 80 100 [GeV] µ µ T p 0.5 1 1.5 2 2.5 3 3.5 ] -1 [rad 〉 ch N 〈 )] φ∆ ( ∆η ∆ 1/[ Data MADGRAPH + PYTHIA8 POWHEG + PYTHIA8 POWHEG + HERWIG++ CMS (13 TeV) -1 2.1 fb (GeV) < 101 µ µ 81 < M Charged particles | < 2, transverse) η > 0.5 GeV, | T (p + X -µ + µ → Z + X → pp 0 20 40 60 80 100 [GeV] µ µ T p 0.8 0.9 1 1.1 1.2
MC / Data Total uncertainty
0 20 40 60 80 100 [GeV] µ µ T p 0.8 0.9 1 1.1 1.2
MC / Data Total uncertainty
0 20 40 60 80 100 [GeV] µ µ T p 0.8 0.9 1 1.1 1.2
MC / Data Total uncertainty
0 20 40 60 80 100 [GeV] µ µ T p 1 2 3 4 5 6 [GeV/rad] 〉 T p Σ 〈 )] φ∆ ( ∆η ∆ 1/[ Data MADGRAPH + PYTHIA8 POWHEG + PYTHIA8 POWHEG + HERWIG++ CMS (13 TeV) -1 2.1 fb (GeV) < 101 µ µ 81 < M Charged particles | < 2, transverse) η > 0.5 GeV, | T (p + X -µ + µ → Z + X → pp
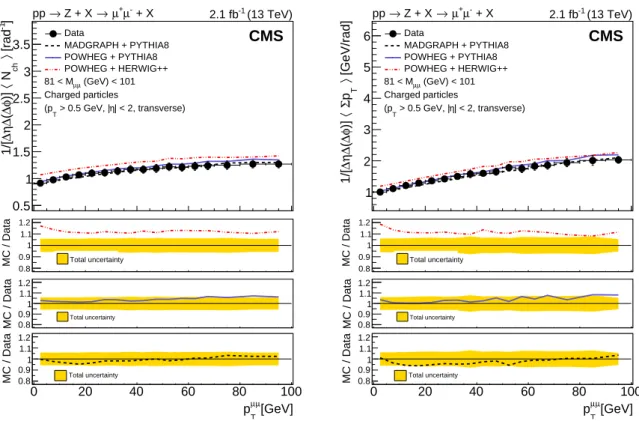
Figure 3: Unfolded distributions of particle density (left) andΣpT density (right) in Z events
in the transverse region as a function of pµµT , compared to various model predictions: MAD
-GRAPH+PYTHIA8 (dashed line),POWHEG+PYTHIA8 (solid line), andPOWHEG+HERWIG++
(dashed-dotted line). The bottom panels of each plot show the ratios of the simulations to the measured distributions. The bands in the bottom panels represent the statistical and systematic uncertainties added in quadrature.
0 20 40 60 80 100 [GeV] µ µ T p 0.8 0.9 1 1.1 1.2
MC / Data Total uncertainty
0 20 40 60 80 100 [GeV] µ µ T p 0.8 0.9 1 1.1 1.2
MC / Data Total uncertainty
0 20 40 60 80 100 [GeV] µ µ T p 0.8 0.9 1 1.1 1.2
MC / Data Total uncertainty
0 20 40 60 80 100 [GeV] µ µ T p 0.5 1 1.5 2 2.5 3 ] -1 [rad 〉 ch N 〈 )] φ∆ ( ∆η ∆ 1/[ Data MADGRAPH + PYTHIA8 POWHEG + PYTHIA8 POWHEG + HERWIG++ CMS (13 TeV) -1 2.1 fb (GeV) < 101 µ µ 81 < M Charged particles | < 2, towards) η > 0.5 GeV, | T (p + X -µ + µ → Z + X → pp 0 20 40 60 80 100 [GeV] µ µ T p 0.8 0.9 1 1.1 1.2
MC / Data Total uncertainty
0 20 40 60 80 100 [GeV] µ µ T p 0.8 0.9 1 1.1 1.2
MC / Data Total uncertainty
0 20 40 60 80 100 [GeV] µ µ T p 0.8 0.9 1 1.1 1.2
MC / Data Total uncertainty
0 20 40 60 80 100 [GeV] µ µ T p 0.5 1 1.5 2 2.5 3 3.5 4 4.5 [GeV/rad] 〉 T p Σ 〈 )] φ∆ ( ∆η ∆ 1/[ Data MADGRAPH + PYTHIA8 POWHEG + PYTHIA8 POWHEG + HERWIG++ CMS (13 TeV) -1 2.1 fb (GeV) < 101 µ µ 81 < M Charged particles | < 2, towards) η > 0.5 GeV, | T (p + X -µ + µ → Z + X → pp
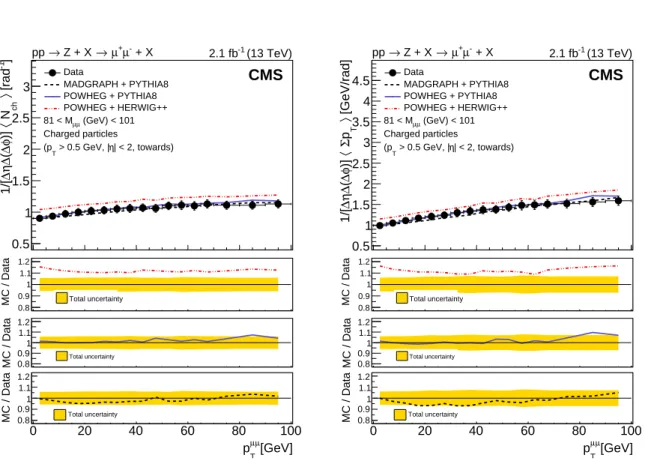
Figure 4: Unfolded distributions of particle density (left) andΣpT density (right) in Z events
in the towards region as a function of pTµµ, compared to various model predictions: MAD
-GRAPH+PYTHIA8 (dashed line),POWHEG+PYTHIA8 (solid line), andPOWHEG+HERWIG++
(dashed-dotted line). The bottom panels of each plot show the ratios of the simulations to the measured distributions. The bands in the bottom panels represent the statistical and systematic uncertainties added in quadrature.
0 20 40 60 80 100 [GeV] µ µ T p 0.6 0.8 1 1.2 1.4 MC / Data Total uncertainty 0 20 40 60 80 100 [GeV] µ µ T p 0.6 0.8 1 1.2 1.4
MC / Data Total uncertainty
0 20 40 60 80 100 [GeV] µ µ T p 0.6 0.8 1 1.2 1.4
MC / Data Total uncertainty
0 20 40 60 80 100
[GeV]
µ
µ
T
p
0.4 0.6 0.8 1 1.2 1.4]
-1[rad
〉
chN
〈
)]
φ∆
(
∆η
∆
1/[
CMS
+ X -µ + µ → Z + X → ) p pp( Charged particles Towards pp, s = 13 TeV CMS, = 7 TeV s pp, CMS, = 1.96 TeV s , p p CDF, = 13 TeV s pp, POWHEG + PYTHIA8, = 7 TeV s pp, POWHEG + PYTHIA8, = 1.96 TeV s , p p POWHEG + PYTHIA8 = 13 TeV s pp, POWHEG + HERWIG++, = 7 TeV s pp, POWHEG + HERWIG++, = 1.96 TeV s , p p POWHEG + HERWIG++,Figure 5: Comparison of the particle density measured in Z events at√s=13 TeV with that at 7 (CMS) [3] and 1.96 TeV (CDF) [9] in the towards region as a function of pµµT . The data are also
compared with the model predictions ofPOWHEG+PYTHIA8 (solid line) andPOWHEG+HER
-WIG++ (dashed-dotted line). The bottom panels of each plot show the ratios of the model
predictions to the measurements. The bands in the bottom panels represent the statistical and systematic uncertainties added in quadrature.
0 20 40 60 80 100 [GeV] µ µ T p 0.6 0.8 1 1.2 1.4 MC / Data Total uncertainty 0 20 40 60 80 100 [GeV] µ µ T p 0.6 0.8 1 1.2 1.4
MC / Data Total uncertainty
0 20 40 60 80 100 [GeV] µ µ T p 0.6 0.8 1 1.2 1.4
MC / Data Total uncertainty
0 20 40 60 80 100
[GeV]
µ
µ
T
p
0.4 0.6 0.8 1 1.2 1.4 1.6 1.8 2[GeV/rad]
〉
Tp
Σ
〈
)]
φ∆
(
∆η
∆
1/[
CMS
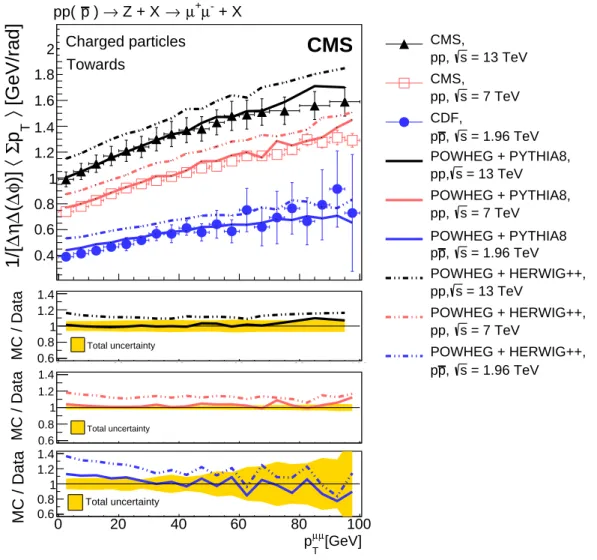
+ X -µ + µ → Z + X → ) p pp( Charged particles Towards pp, s = 13 TeV CMS, = 7 TeV s pp, CMS, = 1.96 TeV s , p p CDF, = 13 TeV s pp, POWHEG + PYTHIA8, = 7 TeV s pp, POWHEG + PYTHIA8, = 1.96 TeV s , p p POWHEG + PYTHIA8 = 13 TeV s pp, POWHEG + HERWIG++, = 7 TeV s pp, POWHEG + HERWIG++, = 1.96 TeV s , p p POWHEG + HERWIG++,Figure 6: Comparison of theΣpT density measured in Z events at
√
s = 13 TeV with that at 7 (CMS) [3] and 1.96 TeV (CDF) [9] in the towards region as a function of pµµT . The data are also
compared with the model predictions ofPOWHEG+PYTHIA8 (solid line) andPOWHEG+HER
-WIG++ (dashed-dotted line). The bottom panels of each plot show the ratios of the model
predictions to the measurements. The bands in the bottom panels represent the statistical and systematic uncertainties added in quadrature.
0 20 40 60 80 100 [GeV] µ µ T p 0.6 0.8 1 1.2 1.4 MC / Data Total uncertainty 0 20 40 60 80 100 [GeV] µ µ T p 0.6 0.8 1 1.2 1.4
MC / Data Total uncertainty
0 20 40 60 80 100 [GeV] µ µ T p 0.6 0.8 1 1.2 1.4
MC / Data Total uncertainty
0 20 40 60 80 100
[GeV]
µ
µ
T
p
0.4 0.6 0.8 1 1.2 1.4 1.6]
-1[rad
〉
chN
〈
)]
φ∆
(
∆η
∆
1/[
CMS
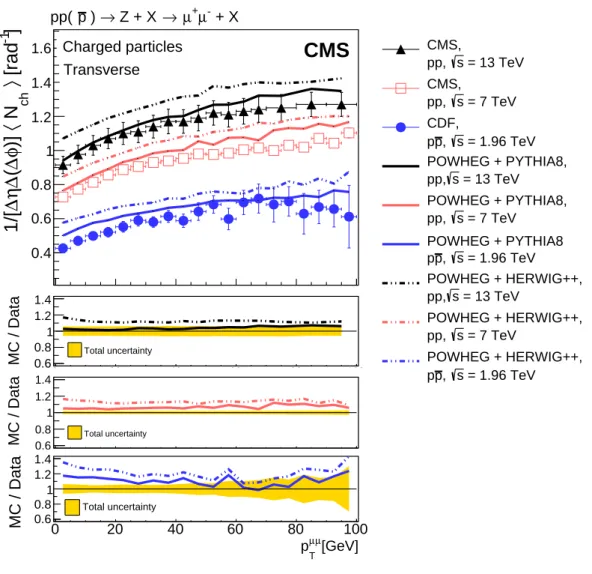
+ X -µ + µ → Z + X → ) p pp( Charged particles Transverse pp, s = 13 TeV CMS, = 7 TeV s pp, CMS, = 1.96 TeV s , p p CDF, = 13 TeV s pp, POWHEG + PYTHIA8, = 7 TeV s pp, POWHEG + PYTHIA8, = 1.96 TeV s , p p POWHEG + PYTHIA8 = 13 TeV s pp, POWHEG + HERWIG++, = 7 TeV s pp, POWHEG + HERWIG++, = 1.96 TeV s , p p POWHEG + HERWIG++,Figure 7: Comparison of the particle density measured in Z events at√s= 13 TeV with that at 7 (CMS) [3] and 1.96 TeV (CDF) [9] in the transverse region as a function of pTµµ. The data are also
compared with the model predictions ofPOWHEG+PYTHIA8 (solid line) andPOWHEG+HER
-WIG++ (dashed-dotted line). The bottom panels of each plot show the ratios of model
pre-dictions to the measurements. The bands in the bottom panels represent the statistical and systematic uncertainties added in quadrature.
0 20 40 60 80 100 [GeV] µ µ T p 0.6 0.8 1 1.2 1.4 MC / Data Total uncertainty 0 20 40 60 80 100 [GeV] µ µ T p 0.6 0.8 1 1.2 1.4
MC / Data Total uncertainty
0 20 40 60 80 100 [GeV] µ µ T p 0.6 0.8 1 1.2 1.4
MC / Data Total uncertainty
0 20 40 60 80 100
[GeV]
µ
µ
T
p
0.5 1 1.5 2 2.5[GeV/rad]
〉
Tp
Σ
〈
)]
φ∆
(
∆η
∆
1/[
CMS
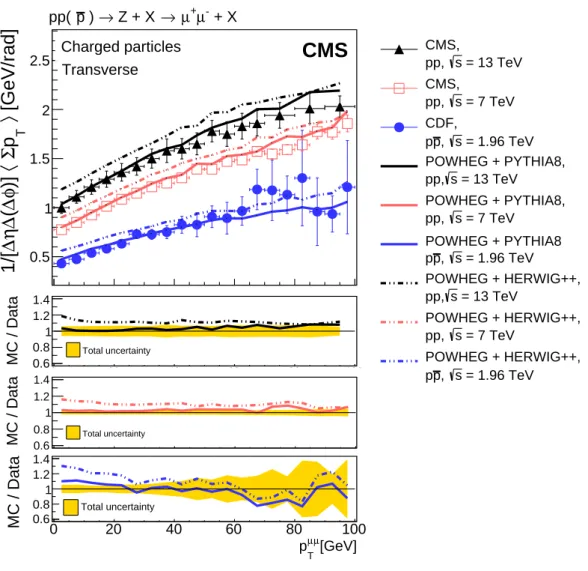
+ X -µ + µ → Z + X → ) p pp( Charged particles Transverse pp, s = 13 TeV CMS, = 7 TeV s pp, CMS, = 1.96 TeV s , p p CDF, = 13 TeV s pp, POWHEG + PYTHIA8, = 7 TeV s pp, POWHEG + PYTHIA8, = 1.96 TeV s , p p POWHEG + PYTHIA8 = 13 TeV s pp, POWHEG + HERWIG++, = 7 TeV s pp, POWHEG + HERWIG++, = 1.96 TeV s , p p POWHEG + HERWIG++,Figure 8: Comparison of theΣpTdensity measured in Z events at
√
s = 13 TeV with that at 7 (CMS) [3] and 1.96 TeV (CDF) [9] in the transverse region as a function of pµµT . The data are also
compared with the predictions ofPOWHEG+PYTHIA8 (solid line) andPOWHEG+HERWIG++
(dashed-dotted line). The bottom panels of each plot show the ratios of the model predictions to the measurements. The bands in the bottom panels represent the statistical and systematic uncertainties added in quadrature.
0 10 20 30 40 50 60 70 [GeV] µ µ T p 1 1.2 1.4 1.6 1.8 2 2.2 2.4 2.6 2.8 ] ) -1 [rad 〉 ch N 〈 )] φ∆ ( ∆η ∆ Ratio ( 1/[ CMS Charged particles towards + X -µ + µ → Z + X → ) p pp(
Data (13 TeV/7 TeV)
POWHEG + PYTHIA8 (13 TeV/7 TeV) POWHEG + HERWIG++ (13 TeV/7 TeV) Data (7 TeV/1.96 TeV)
POWHEG + PYTHIA8 (7 TeV/1.96 TeV) POWHEG + HERWIG++ (7 TeV/1.96 TeV)
0 10 20 30 40 50 60 70 [GeV] µ µ T p 1 1.2 1.4 1.6 1.8 2 2.2 2.4 2.6 2.8 [GeV/rad] ) 〉 T p Σ 〈 )] φ∆ ( ∆η ∆ Ratio ( 1/[ CMS Charged particles towards + X -µ + µ → Z + X → ) p pp(
Data (13 TeV/7 TeV)
POWHEG + PYTHIA8 (13 TeV/7 TeV) POWHEG + HERWIG++ (13 TeV/7 TeV) Data (7 TeV/1.96 TeV)
POWHEG + PYTHIA8 (7 TeV/1.96 TeV) POWHEG + HERWIG++ (7 TeV/1.96 TeV)
0 10 20 30 40 50 60 70 [GeV] µ µ T p 1 1.2 1.4 1.6 1.8 2 2.2 2.4 2.6 2.8 ] ) -1 [rad 〉 ch N 〈 )] φ∆ ( ∆η ∆ Ratio ( 1/[ CMS Charged particles transverse + X -µ + µ → Z + X → ) p pp(
Data (13 TeV/7 TeV)
POWHEG + PYTHIA8 (13 TeV/7 TeV) POWHEG + HERWIG++ (13 TeV/7 TeV) Data (7 TeV/1.96 TeV)
POWHEG + PYTHIA8 (7 TeV/1.96 TeV) POWHEG + HERWIG++ (7 TeV/1.96 TeV)
0 10 20 30 40 50 60 70 [GeV] µ µ T p 1 1.2 1.4 1.6 1.8 2 2.2 2.4 2.6 2.8 [GeV/rad] ) 〉 T p Σ 〈 )] φ∆ ( ∆η ∆ Ratio ( 1/[ CMS Charged particles transverse + X -µ + µ → Z + X → ) p pp(
Data (13 TeV/7 TeV)
POWHEG + PYTHIA8 (13 TeV/7 TeV) POWHEG + HERWIG++ (13 TeV/7 TeV) Data (7 TeV/1.96 TeV)
POWHEG + PYTHIA8 (7 TeV/1.96 TeV) POWHEG + HERWIG++ (7 TeV/1.96 TeV)
Figure 9: Comparison of the increase in UE activity in Z events, from√s= 1.96 TeV (CDF) [9]
to 7 TeV (CMS) [3], with that from√s = 7 TeV (CMS) to 13 TeV (CMS) in the towards (top) and
transverse (bottom) regions. Panels on the left show the particle density, whereas panels on the right show theΣpTdensity as a function of pµµT . The data distributions are also compared with
predictions ofPOWHEG+PYTHIA8 (dashed-dotted line) andPOWHEG+HERWIG++ (solid line).
2 4 6 8 10 12 [TeV] s 0 0.2 0.4 0.6 0.8 1 1.2 1.4 1.6 ] -1 [rad 〉 ch N 〈 )] φ∆ ( ∆η ∆ 1/[ CMS < 5 GeV µ µ T p + X -µ + µ → Z + X → ) p pp( Charged particles ) o | < 120 φ ∆ towards+transverse (| Data POWHEG + PYTHIA8 POWHEG + HERWIG++ POWHEG + PYTHIA8, MPI OFF
2 4 6 8 10 12 [TeV] s 0 0.2 0.4 0.6 0.8 1 1.2 1.4 1.6 1.8 [GeV/rad] 〉 T p Σ 〈 )] φ∆ ( ∆η ∆ 1/[ CMS < 5 GeV µ µ T p + X -µ + µ → Z + X → ) p pp( Charged particles ) o | < 120 φ ∆ towards+transverse (| Data POWHEG + PYTHIA8 POWHEG + HERWIG++ POWHEG + PYTHIA8, MPI OFF
Figure 10: Average particle density (left) and average ΣpT density (right) for Z events with
pTµµ < 5 GeV as a function of the center-of-mass energy, measured by CMS and CDF [9] in
the combined towards + transverse regions, compared to predictions fromPOWHEG+PYTHIA8,
POWHEG + HERWIG++, and POWHEG + PYTHIA8 without MPI. The error bars represent the
statistical and systematic uncertainties added in quadrature.
Acknowledgments
We congratulate our colleagues in the CERN accelerator departments for the excellent perfor-mance of the LHC and thank the technical and administrative staffs at CERN and at other CMS institutes for their contributions to the success of the CMS effort. In addition, we grate-fully acknowledge the computing centers and personnel of the Worldwide LHC Computing Grid for delivering so effectively the computing infrastructure essential to our analyses. Fi-nally, we acknowledge the enduring support for the construction and operation of the LHC and the CMS detector provided by the following funding agencies: the Austrian Federal Min-istry of Science, Research and Economy and the Austrian Science Fund; the Belgian Fonds de la Recherche Scientifique, and Fonds voor Wetenschappelijk Onderzoek; the Brazilian Fund-ing Agencies (CNPq, CAPES, FAPERJ, and FAPESP); the Bulgarian Ministry of Education and Science; CERN; the Chinese Academy of Sciences, Ministry of Science and Technology, and Na-tional Natural Science Foundation of China; the Colombian Funding Agency (COLCIENCIAS); the Croatian Ministry of Science, Education and Sport, and the Croatian Science Foundation; the Research Promotion Foundation, Cyprus; the Secretariat for Higher Education, Science, Technology and Innovation, Ecuador; the Ministry of Education and Research, Estonian Re-search Council via IUT23-4 and IUT23-6 and European Regional Development Fund, Estonia; the Academy of Finland, Finnish Ministry of Education and Culture, and Helsinki Institute of Physics; the Institut National de Physique Nucl´eaire et de Physique des Particules / CNRS, and Commissariat `a l’ ´Energie Atomique et aux ´Energies Alternatives / CEA, France; the Bundes-ministerium f ¨ur Bildung und Forschung, Deutsche Forschungsgemeinschaft, and Helmholtz-Gemeinschaft Deutscher Forschungszentren, Germany; the General Secretariat for Research and Technology, Greece; the National Scientific Research Foundation, and National Innova-tion Office, Hungary; the Department of Atomic Energy and the Department of Science and Technology, India; the Institute for Studies in Theoretical Physics and Mathematics, Iran; the Science Foundation, Ireland; the Istituto Nazionale di Fisica Nucleare, Italy; the Ministry of
Science, ICT and Future Planning, and National Research Foundation (NRF), Republic of Ko-rea; the Lithuanian Academy of Sciences; the Ministry of Education, and University of Malaya (Malaysia); the Mexican Funding Agencies (BUAP, CINVESTAV, CONACYT, LNS, SEP, and UASLP-FAI); the Ministry of Business, Innovation and Employment, New Zealand; the Pak-istan Atomic Energy Commission; the Ministry of Science and Higher Education and the Na-tional Science Centre, Poland; the Fundac¸˜ao para a Ciˆencia e a Tecnologia, Portugal; JINR, Dubna; the Ministry of Education and Science of the Russian Federation, the Federal Agency of Atomic Energy of the Russian Federation, Russian Academy of Sciences, the Russian Foun-dation for Basic Research and the Russian Competitiveness Program of NRNU “MEPhI”; the Ministry of Education, Science and Technological Development of Serbia; the Secretar´ıa de Es-tado de Investigaci ´on, Desarrollo e Innovaci ´on, Programa Consolider-Ingenio 2010, Plan de Ciencia, Tecnolog´ıa e Innovaci ´on 2013-2017 del Principado de Asturias and Fondo Europeo de Desarrollo Regional, Spain; the Swiss Funding Agencies (ETH Board, ETH Zurich, PSI, SNF, UniZH, Canton Zurich, and SER); the Ministry of Science and Technology, Taipei; the Thailand Center of Excellence in Physics, the Institute for the Promotion of Teaching Science and Tech-nology of Thailand, Special Task Force for Activating Research and the National Science and Technology Development Agency of Thailand; the Scientific and Technical Research Council of Turkey, and Turkish Atomic Energy Authority; the National Academy of Sciences of Ukraine, and State Fund for Fundamental Researches, Ukraine; the Science and Technology Facilities Council, UK; the US Department of Energy, and the US National Science Foundation.
Individuals have received support from the Marie-Curie program and the European Research Council and Horizon 2020 Grant, contract No. 675440 (European Union); the Leventis Foun-dation; the A. P. Sloan FounFoun-dation; the Alexander von Humboldt FounFoun-dation; the Belgian Fed-eral Science Policy Office; the Fonds pour la Formation `a la Recherche dans l’Industrie et dans l’Agriculture (FRIA-Belgium); the Agentschap voor Innovatie door Wetenschap en Technologie (IWT-Belgium); the Ministry of Education, Youth and Sports (MEYS) of the Czech Republic; the Council of Scientific and Industrial Research, India; the HOMING PLUS program of the Foun-dation for Polish Science, cofinanced from European Union, Regional Development Fund, the Mobility Plus program of the Ministry of Science and Higher Education, the National Science Center (Poland), contracts Harmonia 2014/14/M/ST2/00428, Opus 2014/13/B/ST2/02543, 2014/15/B/ST2/03998, and 2015/19/B/ST2/02861, Sonata-bis 2012/07/E/ST2/01406; the National Priorities Research Program by Qatar National Research Fund; the Programa Severo Ochoa del Principado de Asturias; the Thalis and Aristeia programs cofinanced by EU-ESF and the Greek NSRF; the Rachadapisek Sompot Fund for Postdoctoral Fellowship, Chulalongkorn University and the Chulalongkorn Academic into Its 2nd Century Project Advancement Project (Thailand); the Welch Foundation, contract C-1845; and the Weston Havens Foundation (USA).
References
[1] CMS Collaboration, “Measurement of the underlying event activity at the LHC with√
s =7 TeV and comparison with√s=0.9 TeV”, JHEP 09 (2011) 109,
doi:10.1007/JHEP09(2011)109, arXiv:1107.0330.
[2] CMS Collaboration, “Measurement of the underlying event activity using
charged-particle jets in proton-proton collisions at√s=2.76 TeV”, JHEP 09 (2015) 137, doi:10.1007/JHEP09(2015)137, arXiv:1507.07229.
[3] CMS Collaboration, “Measurement of the underlying event in the Drell–Yan process in proton-proton collisions at√s=7 TeV”, Eur. Phys. J. C 72 (2012) 2080,
doi:10.1140/epjc/s10052-012-2080-4, arXiv:1204.1411.
[4] ALICE Collaboration, “Underlying event measurements in pp collisions at√s=0.9 and
7 TeV with the ALICE experiment at the LHC”, JHEP 07 (2012) 116, doi:10.1007/JHEP07(2012)116, arXiv:1112.2082.
[5] ATLAS Collaboration, “Measurement of underlying event characteristics using charged particles in pp collisions at√s=900 GeV and 7 TeV with the ATLAS detector”, Phys. Rev. D 83 (2011) 112001, doi:10.1103/PhysRevD.83.112001, arXiv:1012.0791. [6] ATLAS Collaboration, “Measurements of underlying-event properties using neutral and
charged particles in pp collisions at 900 GeV and 7 TeV with the ATLAS detector at the LHC”, Eur. Phys. J. C 71 (2011) 1636, doi:10.1140/epjc/s10052-011-1636-z, arXiv:1103.1816.
[7] ATLAS Collaboration, “Measurement of the dependence of transverse energy production at large pseudorapidity on the hard-scattering kinematics of proton-proton collisions at√
s =2.76 TeV with ATLAS”, Phys. Lett. B 756 (2016) 10,
doi:10.1016/j.physletb.2016.02.056, arXiv:1512.00197.
[8] ATLAS Collaboration, “Measurement of distributions sensitive to the underlying event in inclusive Z-boson production in pp collisions at√s=7 TeV with the ATLAS
detector”, Eur. Phys. J. C 74 (2014) 3195, doi:10.1140/epjc/s10052-014-3195-6,
arXiv:1409.3433.
[9] CDF Collaboration, “Studying the underlying event in Drell–Yan and high transverse momentum jet production at the Tevatron”, Phys. Rev. D 82 (2010) 034001,
doi:10.1103/PhysRevD.82.034001, arXiv:1003.3146.
[10] T. Sj ¨ostrand and M. Van Zijl, “A multiple interaction model for the event structure in hadron collisions”, Phys. Rev. D 36 (1987) 2019, doi:10.1103/PhysRevD.36.2019. [11] L. Frankfurt, M. Strikman, and C. Weiss, “Transverse nucleon structure and diagnostics
of hard parton-parton processes at LHC”, Phys. Rev. D 83 (2011) 054012,
doi:10.1103/PhysRevD.83.054012, arXiv:1009.2559.
[12] R. Kumar, M. Bansal, S. Bansal, and J. B. Singh, “New observables for multiple-parton interactions measurements using Z+jets processes at the LHC”, Phys. Rev. D 93 (2016) 054019, doi:10.1103/PhysRevD.93.054019, arXiv:1602.05392.
[13] J. Alwall et al., “The automated computation of tree-level and next-to-leading order differential cross sections, and their matching to parton shower simulations”, JHEP 07 (2014) 079, doi:10.1007/JHEP07(2014)079, arXiv:1405.0301.
[14] S. Frixione, P. Nason, and C. Oleari, “Matching NLO QCD computations with parton shower simulations: the powheg method”, JHEP 11 (2007) 070,
doi:10.1088/1126-6708/2007/11/070, arXiv:0709.2092.
[15] K. Hamilton, P. Nason, and G. Zanderighi, “MINLO: multi-scale improved NLO”, JHEP
10(2012) 155, doi:10.1007/JHEP10(2012)155, arXiv:1206.3572.
[16] F. Maltoni and T. Stelzer, “MadEvent: automatic event generation with MadGraph”, JHEP 02 (2003) 027, doi:10.1088/1126-6708/2003/02/027,
arXiv:hep-ph/0208156.
[17] J. Alwall et al., “MadGraph 5: going beyond”, JHEP 06 (2011) 128,
doi:10.1007/JHEP06(2011)128, arXiv:1106.0522.
[18] T. Sj ¨ostrand, S. Mrenna, and P. Z. Skands, “A brief introduction to PYTHIA 8.1”, Comput. Phys. Commun. 178 (2008) 852, doi:10.1016/j.cpc.2008.01.036,
arXiv:0710.3820.
[19] CMS Collaboration, “Event generator tunes obtained from underlying event and multiparton scattering measurements”, Eur. Phys. J. C 76 (2016) 155,
doi:10.1140/epjc/s10052-016-3988-x, arXiv:1512.00815.
[20] NNPDF Collaboration, “Parton distributions for the LHC Run II”, JHEP 04 (2015) 040, doi:10.1007/JHEP04(2015)040, arXiv:1410.8849.
[21] GEANT4 Collaboration, “GEANT4—a simulation toolkit”, Nucl. Instrum. Meth. A 506 (2003) 250, doi:10.1016/S0168-9002(03)01368-8.
[22] M. B¨ahr et al., “Herwig++ physics and manual”, Eur. Phys. J. C 58 (2008) 639, doi:10.1140/epjc/s10052-008-0798-9, arXiv:0803.0883.
[23] CMS Collaboration, “Description and performance of track and primary-vertex reconstruction with the CMS tracker”, JINST 9 (2014) P10009,
doi:10.1088/1748-0221/9/10/P10009, arXiv:1405.6569.
[24] CMS Collaboration, “Performance of CMS muon reconstruction in pp collision events at√
s =7 TeV”, JINST 7 (2012) P10002, doi:10.1088/1748-0221/7/10/P10002,
arXiv:1206.4071.
[25] CMS Collaboration, “The CMS experiment at the CERN LHC”, JINST 3 (2008) S08004,
doi:10.1088/1748-0221/3/08/S08004.
[26] CMS Collaboration, “Particle-flow reconstruction and global event description with the CMS detector”, JINST 12 (2017) P10003, doi:10.1088/1748-0221/12/10/P10003, arXiv:1706.04965.
[27] A. Bodek et al., “Extracting muon momentum scale corrections for hadron collider experiments”, Eur. Phys. J. C 72 (2012) 2194,
doi:10.1140/epjc/s10052-012-2194-8, arXiv:1208.3710.
[28] CMS Collaboration, “The CMS trigger system”, J. Instrum. 12 (2017) P01020,
doi:10.1088/1748-0221/12/01/P01020.
[29] CMS Collaboration, “CMS tracking performance results from early LHC operation”, Eur. Phys. J. C 70 (2010) 1165, doi:10.1140/epjc/s10052-010-1491-3,
[30] G. D’Agostini, “A multidimensional unfolding method based on Bayes’ theorem”, Nucl. Instrum. Meth. A 362 (1995) 487, doi:10.1016/0168-9002(95)00274-X.
[31] CMS Collaboration, “Measurement of tracking efficiency”, CMS Physics Analysis Summary CMS-PAS-TRK-10-002, 2010.
A
The CMS Collaboration
Yerevan Physics Institute, Yerevan, Armenia
A.M. Sirunyan, A. Tumasyan
Institut f ¨ur Hochenergiephysik, Wien, Austria
W. Adam, F. Ambrogi, E. Asilar, T. Bergauer, J. Brandstetter, E. Brondolin, M. Dragicevic, J. Er ¨o, M. Flechl, M. Friedl, R. Fr ¨uhwirth1, V.M. Ghete, J. Grossmann, J. Hrubec, M. Jeitler1, A. K ¨onig, N. Krammer, I. Kr¨atschmer, D. Liko, T. Madlener, I. Mikulec, E. Pree, D. Rabady, N. Rad, H. Rohringer, J. Schieck1, R. Sch ¨ofbeck, M. Spanring, D. Spitzbart, J. Strauss, W. Waltenberger, J. Wittmann, C.-E. Wulz1, M. Zarucki
Institute for Nuclear Problems, Minsk, Belarus
V. Chekhovsky, V. Mossolov, J. Suarez Gonzalez
Universiteit Antwerpen, Antwerpen, Belgium
E.A. De Wolf, D. Di Croce, X. Janssen, J. Lauwers, M. Van De Klundert, H. Van Haevermaet, P. Van Mechelen, N. Van Remortel
Vrije Universiteit Brussel, Brussel, Belgium
S. Abu Zeid, F. Blekman, J. D’Hondt, I. De Bruyn, J. De Clercq, K. Deroover, G. Flouris, D. Lontkovskyi, S. Lowette, S. Moortgat, L. Moreels, A. Olbrechts, Q. Python, K. Skovpen, S. Tavernier, W. Van Doninck, P. Van Mulders, I. Van Parijs
Universit´e Libre de Bruxelles, Bruxelles, Belgium
H. Brun, B. Clerbaux, G. De Lentdecker, H. Delannoy, G. Fasanella, L. Favart, R. Goldouzian, A. Grebenyuk, G. Karapostoli, T. Lenzi, J. Luetic, T. Maerschalk, A. Marinov, A. Randle-conde, T. Seva, C. Vander Velde, P. Vanlaer, D. Vannerom, R. Yonamine, F. Zenoni, F. Zhang2
Ghent University, Ghent, Belgium
A. Cimmino, T. Cornelis, D. Dobur, A. Fagot, M. Gul, I. Khvastunov, D. Poyraz, C. Roskas, S. Salva, M. Tytgat, W. Verbeke, N. Zaganidis
Universit´e Catholique de Louvain, Louvain-la-Neuve, Belgium
H. Bakhshiansohi, O. Bondu, S. Brochet, G. Bruno, A. Caudron, S. De Visscher, C. Delaere, M. Delcourt, B. Francois, A. Giammanco, A. Jafari, M. Komm, G. Krintiras, V. Lemaitre, A. Magitteri, A. Mertens, M. Musich, K. Piotrzkowski, L. Quertenmont, M. Vidal Marono, S. Wertz
Universit´e de Mons, Mons, Belgium
N. Beliy
Centro Brasileiro de Pesquisas Fisicas, Rio de Janeiro, Brazil
W.L. Ald´a J ´unior, F.L. Alves, G.A. Alves, L. Brito, M. Correa Martins Junior, C. Hensel, A. Moraes, M.E. Pol, P. Rebello Teles
Universidade do Estado do Rio de Janeiro, Rio de Janeiro, Brazil
E. Belchior Batista Das Chagas, W. Carvalho, J. Chinellato3, A. Cust ´odio, E.M. Da Costa,
G.G. Da Silveira4, D. De Jesus Damiao, S. Fonseca De Souza, L.M. Huertas Guativa,
H. Malbouisson, M. Melo De Almeida, C. Mora Herrera, L. Mundim, H. Nogima, A. Santoro, A. Sznajder, E.J. Tonelli Manganote3, F. Torres Da Silva De Araujo, A. Vilela Pereira
Universidade Estadual Paulistaa, Universidade Federal do ABCb, S˜ao Paulo, Brazil
S. Ahujaa, C.A. Bernardesa, T.R. Fernandez Perez Tomeia, E.M. Gregoresb, P.G. Mercadanteb, S.F. Novaesa, Sandra S. Padulaa, D. Romero Abadb, J.C. Ruiz Vargasa
Institute for Nuclear Research and Nuclear Energy, Bulgarian Academy of Sci-ences, Sofia, Bulgaria
A. Aleksandrov, R. Hadjiiska, P. Iaydjiev, M. Misheva, M. Rodozov, M. Shopova, S. Stoykova, G. Sultanov
University of Sofia, Sofia, Bulgaria
A. Dimitrov, I. Glushkov, L. Litov, B. Pavlov, P. Petkov
Beihang University, Beijing, China
W. Fang5, X. Gao5
Institute of High Energy Physics, Beijing, China
M. Ahmad, J.G. Bian, G.M. Chen, H.S. Chen, M. Chen, Y. Chen, C.H. Jiang, D. Leggat, H. Liao, Z. Liu, F. Romeo, S.M. Shaheen, A. Spiezia, J. Tao, C. Wang, Z. Wang, E. Yazgan, H. Zhang, J. Zhao
State Key Laboratory of Nuclear Physics and Technology, Peking University, Beijing, China
Y. Ban, G. Chen, Q. Li, S. Liu, Y. Mao, S.J. Qian, D. Wang, Z. Xu
Universidad de Los Andes, Bogota, Colombia
C. Avila, A. Cabrera, L.F. Chaparro Sierra, C. Florez, C.F. Gonz´alez Hern´andez, J.D. Ruiz Al-varez
University of Split, Faculty of Electrical Engineering, Mechanical Engineering and Naval Ar-chitecture, Split, Croatia
B. Courbon, N. Godinovic, D. Lelas, I. Puljak, P.M. Ribeiro Cipriano, T. Sculac
University of Split, Faculty of Science, Split, Croatia
Z. Antunovic, M. Kovac
Institute Rudjer Boskovic, Zagreb, Croatia
V. Brigljevic, D. Ferencek, K. Kadija, B. Mesic, A. Starodumov6, T. Susa
University of Cyprus, Nicosia, Cyprus
M.W. Ather, A. Attikis, G. Mavromanolakis, J. Mousa, C. Nicolaou, F. Ptochos, P.A. Razis, H. Rykaczewski
Charles University, Prague, Czech Republic
M. Finger7, M. Finger Jr.7
Universidad San Francisco de Quito, Quito, Ecuador
E. Carrera Jarrin
Academy of Scientific Research and Technology of the Arab Republic of Egypt, Egyp-tian Network of High Energy Physics, Cairo, Egypt
Y. Assran8,9, M.A. Mahmoud10,9, A. Mahrous11
National Institute of Chemical Physics and Biophysics, Tallinn, Estonia
R.K. Dewanjee, M. Kadastik, L. Perrini, M. Raidal, A. Tiko, C. Veelken
Department of Physics, University of Helsinki, Helsinki, Finland
P. Eerola, J. Pekkanen, M. Voutilainen
Helsinki Institute of Physics, Helsinki, Finland
J. H¨ark ¨onen, T. J¨arvinen, V. Karim¨aki, R. Kinnunen, T. Lamp´en, K. Lassila-Perini, S. Lehti, T. Lind´en, P. Luukka, E. Tuominen, J. Tuominiemi, E. Tuovinen
Lappeenranta University of Technology, Lappeenranta, Finland
J. Talvitie, T. Tuuva
IRFU, CEA, Universit´e Paris-Saclay, Gif-sur-Yvette, France
M. Besancon, F. Couderc, M. Dejardin, D. Denegri, J.L. Faure, F. Ferri, S. Ganjour, S. Ghosh, A. Givernaud, P. Gras, G. Hamel de Monchenault, P. Jarry, I. Kucher, E. Locci, M. Machet, J. Malcles, G. Negro, J. Rander, A. Rosowsky, M. ¨O. Sahin, M. Titov
Laboratoire Leprince-Ringuet, Ecole polytechnique, CNRS/IN2P3, Universit´e Paris-Saclay, Palaiseau, France
A. Abdulsalam, I. Antropov, S. Baffioni, F. Beaudette, P. Busson, L. Cadamuro, C. Charlot, R. Granier de Cassagnac, M. Jo, S. Lisniak, A. Lobanov, J. Martin Blanco, M. Nguyen, C. Ochando, G. Ortona, P. Paganini, P. Pigard, S. Regnard, R. Salerno, J.B. Sauvan, Y. Sirois, A.G. Stahl Leiton, T. Strebler, Y. Yilmaz, A. Zabi, A. Zghiche
Universit´e de Strasbourg, CNRS, IPHC UMR 7178, F-67000 Strasbourg, France
J.-L. Agram12, J. Andrea, D. Bloch, J.-M. Brom, M. Buttignol, E.C. Chabert, N. Chanon,
C. Collard, E. Conte12, X. Coubez, J.-C. Fontaine12, D. Gel´e, U. Goerlach, M. Jansov´a, A.-C. Le Bihan, N. Tonon, P. Van Hove
Centre de Calcul de l’Institut National de Physique Nucleaire et de Physique des Partic-ules, CNRS/IN2P3, Villeurbanne, France
S. Gadrat
Universit´e de Lyon, Universit´e Claude Bernard Lyon 1, CNRS-IN2P3, Institut de Physique Nucl´eaire de Lyon, Villeurbanne, France
S. Beauceron, C. Bernet, G. Boudoul, R. Chierici, D. Contardo, P. Depasse, H. El Mamouni, J. Fay, L. Finco, S. Gascon, M. Gouzevitch, G. Grenier, B. Ille, F. Lagarde, I.B. Laktineh,
M. Lethuillier, L. Mirabito, A.L. Pequegnot, S. Perries, A. Popov13, V. Sordini,
M. Vander Donckt, S. Viret
Georgian Technical University, Tbilisi, Georgia
A. Khvedelidze7
Tbilisi State University, Tbilisi, Georgia
D. Lomidze
RWTH Aachen University, I. Physikalisches Institut, Aachen, Germany
C. Autermann, S. Beranek, L. Feld, M.K. Kiesel, K. Klein, M. Lipinski, M. Preuten, C. Schomakers, J. Schulz, T. Verlage
RWTH Aachen University, III. Physikalisches Institut A, Aachen, Germany
A. Albert, E. Dietz-Laursonn, D. Duchardt, M. Endres, M. Erdmann, S. Erdweg, T. Esch, R. Fischer, A. G ¨uth, M. Hamer, T. Hebbeker, C. Heidemann, K. Hoepfner, S. Knutzen, M. Merschmeyer, A. Meyer, P. Millet, S. Mukherjee, M. Olschewski, K. Padeken, T. Pook, M. Radziej, H. Reithler, M. Rieger, F. Scheuch, D. Teyssier, S. Th ¨uer
RWTH Aachen University, III. Physikalisches Institut B, Aachen, Germany
G. Fl ¨ugge, B. Kargoll, T. Kress, A. K ¨unsken, J. Lingemann, T. M ¨uller, A. Nehrkorn, A. Nowack, C. Pistone, O. Pooth, A. Stahl14
Deutsches Elektronen-Synchrotron, Hamburg, Germany
M. Aldaya Martin, T. Arndt, C. Asawatangtrakuldee, K. Beernaert, O. Behnke, U. Behrens,
A. Berm ´udez Mart´ınez, A.A. Bin Anuar, K. Borras15, V. Botta, A. Campbell, P. Connor,
E. Eren, E. Gallo16, J. Garay Garcia, A. Geiser, A. Gizhko, J.M. Grados Luyando, A. Grohsjean,
P. Gunnellini, A. Harb, J. Hauk, M. Hempel17, H. Jung, A. Kalogeropoulos, M. Kasemann,
J. Keaveney, C. Kleinwort, I. Korol, D. Kr ¨ucker, W. Lange, A. Lelek, T. Lenz, J. Leonard,
K. Lipka, W. Lohmann17, R. Mankel, I.-A. Melzer-Pellmann, A.B. Meyer, G. Mittag, J. Mnich,
A. Mussgiller, E. Ntomari, D. Pitzl, R. Placakyte, A. Raspereza, B. Roland, M. Savitskyi, P. Saxena, R. Shevchenko, S. Spannagel, N. Stefaniuk, G.P. Van Onsem, R. Walsh, Y. Wen, K. Wichmann, C. Wissing, O. Zenaiev
University of Hamburg, Hamburg, Germany
S. Bein, V. Blobel, M. Centis Vignali, T. Dreyer, E. Garutti, D. Gonzalez, J. Haller, A. Hinzmann, M. Hoffmann, A. Karavdina, R. Klanner, R. Kogler, N. Kovalchuk, S. Kurz, T. Lapsien, I. Marchesini, D. Marconi, M. Meyer, M. Niedziela, D. Nowatschin, F. Pantaleo14, T. Peiffer,
A. Perieanu, C. Scharf, P. Schleper, A. Schmidt, S. Schumann, J. Schwandt, J. Sonneveld, H. Stadie, G. Steinbr ¨uck, F.M. Stober, M. St ¨over, H. Tholen, D. Troendle, E. Usai, L. Vanelderen, A. Vanhoefer, B. Vormwald
Institut f ¨ur Experimentelle Kernphysik, Karlsruhe, Germany
M. Akbiyik, C. Barth, S. Baur, E. Butz, R. Caspart, T. Chwalek, F. Colombo, W. De Boer, A. Dierlamm, B. Freund, R. Friese, M. Giffels, A. Gilbert, D. Haitz, F. Hartmann14, S.M. Heindl, U. Husemann, F. Kassel14, S. Kudella, H. Mildner, M.U. Mozer, Th. M ¨uller, M. Plagge, G. Quast,
K. Rabbertz, M. Schr ¨oder, I. Shvetsov, G. Sieber, H.J. Simonis, R. Ulrich, S. Wayand, M. Weber, T. Weiler, S. Williamson, C. W ¨ohrmann, R. Wolf
Institute of Nuclear and Particle Physics (INPP), NCSR Demokri-tos, Aghia Paraskevi, Greece
G. Anagnostou, G. Daskalakis, T. Geralis, V.A. Giakoumopoulou, A. Kyriakis, D. Loukas, I. Topsis-Giotis
National and Kapodistrian University of Athens, Athens, Greece
S. Kesisoglou, A. Panagiotou, N. Saoulidou
University of Io´annina, Io´annina, Greece
I. Evangelou, C. Foudas, P. Kokkas, S. Mallios, N. Manthos, I. Papadopoulos, E. Paradas, J. Strologas, F.A. Triantis
MTA-ELTE Lend ¨ulet CMS Particle and Nuclear Physics Group, E ¨otv ¨os Lor´and Univer-sity, Budapest, Hungary
M. Csanad, N. Filipovic, G. Pasztor
Wigner Research Centre for Physics, Budapest, Hungary
G. Bencze, C. Hajdu, D. Horvath18, ´A. Hunyadi, F. Sikler, V. Veszpremi, G. Vesztergombi19, A.J. Zsigmond
Institute of Nuclear Research ATOMKI, Debrecen, Hungary
N. Beni, S. Czellar, J. Karancsi20, A. Makovec, J. Molnar, Z. Szillasi
Institute of Physics, University of Debrecen, Debrecen, Hungary
M. Bart ´ok19, P. Raics, Z.L. Trocsanyi, B. Ujvari
Indian Institute of Science (IISc), Bangalore, India
S. Choudhury, J.R. Komaragiri
National Institute of Science Education and Research, Bhubaneswar, India
Panjab University, Chandigarh, India
S. Bansal, S.B. Beri, V. Bhatnagar, U. Bhawandeep, R. Chawla, N. Dhingra, R. Gupta, A.K. Kalsi, A. Kaur, M. Kaur, R. Kumar, P. Kumari, A. Mehta, J.B. Singh, G. Walia
University of Delhi, Delhi, India
A. Bhardwaj, S. Chauhan, B.C. Choudhary, R.B. Garg, S. Keshri, A. Kumar, Ashok Kumar, S. Malhotra, M. Naimuddin, K. Ranjan, Aashaq Shah, R. Sharma, V. Sharma
Saha Institute of Nuclear Physics, HBNI, Kolkata, India
R. Bhardwaj, R. Bhattacharya, S. Bhattacharya, S. Dey, S. Dutt, S. Dutta, S. Ghosh, N. Majumdar, A. Modak, K. Mondal, S. Mukhopadhyay, S. Nandan, A. Purohit, A. Roy, D. Roy, S. Roy Chowdhury, S. Sarkar, M. Sharan, S. Thakur
Indian Institute of Technology Madras, Madras, India
P.K. Behera
Bhabha Atomic Research Centre, Mumbai, India
R. Chudasama, D. Dutta, V. Jha, V. Kumar, A.K. Mohanty14, P.K. Netrakanti, L.M. Pant,
P. Shukla, A. Topkar
Tata Institute of Fundamental Research-A, Mumbai, India
T. Aziz, S. Dugad, B. Mahakud, S. Mitra, G.B. Mohanty, N. Sur, B. Sutar
Tata Institute of Fundamental Research-B, Mumbai, India
S. Banerjee, S. Bhattacharya, S. Chatterjee, P. Das, M. Guchait, Sa. Jain, S. Kumar, M. Maity23,
G. Majumder, K. Mazumdar, T. Sarkar23, N. Wickramage24
Indian Institute of Science Education and Research (IISER), Pune, India
S. Chauhan, S. Dube, V. Hegde, A. Kapoor, K. Kothekar, S. Pandey, A. Rane, S. Sharma
Institute for Research in Fundamental Sciences (IPM), Tehran, Iran
S. Chenarani25, E. Eskandari Tadavani, S.M. Etesami25, M. Khakzad, M. Mohammadi
Na-jafabadi, M. Naseri, S. Paktinat Mehdiabadi26, F. Rezaei Hosseinabadi, B. Safarzadeh27,
M. Zeinali
University College Dublin, Dublin, Ireland
M. Felcini, M. Grunewald
INFN Sezione di Baria, Universit`a di Barib, Politecnico di Baric, Bari, Italy
M. Abbresciaa,b, C. Calabriaa,b, C. Caputoa,b, A. Colaleoa, D. Creanzaa,c, L. Cristellaa,b, N. De Filippisa,c, M. De Palmaa,b, F. Erricoa,b, L. Fiorea, G. Iasellia,c, S. Lezkia,b, G. Maggia,c, M. Maggia, G. Minielloa,b, S. Mya,b, S. Nuzzoa,b, A. Pompilia,b, G. Pugliesea,c, R. Radognaa,b,
A. Ranieria, G. Selvaggia,b, A. Sharmaa, L. Silvestrisa,14, R. Vendittia, P. Verwilligena
INFN Sezione di Bolognaa, Universit`a di Bolognab, Bologna, Italy
G. Abbiendia, C. Battilanaa,b, D. Bonacorsia,b, S. Braibant-Giacomellia,b, R. Campaninia,b, P. Capiluppia,b, A. Castroa,b, F.R. Cavalloa, S.S. Chhibraa, G. Codispotia,b, M. Cuffiania,b, G.M. Dallavallea, F. Fabbria, A. Fanfania,b, D. Fasanellaa,b, P. Giacomellia, C. Grandia, L. Guiduccia,b, S. Marcellinia, G. Masettia, A. Montanaria, F.L. Navarriaa,b, A. Perrottaa, A.M. Rossia,b, T. Rovellia,b, G.P. Sirolia,b, N. Tosia
INFN Sezione di Cataniaa, Universit`a di Cataniab, Catania, Italy
INFN Sezione di Firenzea, Universit`a di Firenzeb, Firenze, Italy
G. Barbaglia, K. Chatterjeea,b, V. Ciullia,b, C. Civininia, R. D’Alessandroa,b, E. Focardia,b, P. Lenzia,b, M. Meschinia, S. Paolettia, L. Russoa,28, G. Sguazzonia, D. Stroma, L. Viliania,b,14
INFN Laboratori Nazionali di Frascati, Frascati, Italy
L. Benussi, S. Bianco, F. Fabbri, D. Piccolo, F. Primavera14
INFN Sezione di Genovaa, Universit`a di Genovab, Genova, Italy
V. Calvellia,b, F. Ferroa, E. Robuttia, S. Tosia,b
INFN Sezione di Milano-Bicoccaa, Universit`a di Milano-Bicoccab, Milano, Italy
L. Brianzaa,b, F. Brivioa,b, V. Cirioloa,b, M.E. Dinardoa,b, S. Fiorendia,b, S. Gennaia,
A. Ghezzia,b, P. Govonia,b, M. Malbertia,b, S. Malvezzia, R.A. Manzonia,b, D. Menascea, L. Moronia, M. Paganonia,b, K. Pauwelsa,b, D. Pedrinia, S. Pigazzinia,b,29, S. Ragazzia,b, T. Tabarelli de Fatisa,b
INFN Sezione di Napoli a, Universit`a di Napoli ’Federico II’ b, Napoli, Italy, Univer-sit`a della Basilicatac, Potenza, Italy, Universit`a G. Marconid, Roma, Italy
S. Buontempoa, N. Cavalloa,c, S. Di Guidaa,d,14, F. Fabozzia,c, F. Fiengaa,b, A.O.M. Iorioa,b, W.A. Khana, L. Listaa, S. Meolaa,d,14, P. Paoluccia,14, C. Sciaccaa,b, F. Thyssena
INFN Sezione di Padova a, Universit`a di Padova b, Padova, Italy, Univer-sit`a di Trentoc, Trento, Italy
P. Azzia,14, N. Bacchettaa, L. Benatoa,b, D. Biselloa,b, A. Bolettia,b, R. Carlina,b,
A. Carvalho Antunes De Oliveiraa,b, P. Checchiaa, P. De Castro Manzanoa, T. Dorigoa,
F. Gasparinia,b, U. Gasparinia,b, A. Gozzelinoa, S. Lacapraraa, P. Lujan, M. Margonia,b, A.T. Meneguzzoa,b, N. Pozzobona,b, P. Ronchesea,b, R. Rossina,b, F. Simonettoa,b, E. Torassaa,
S. Venturaa, P. Zottoa,b, G. Zumerlea,b
INFN Sezione di Paviaa, Universit`a di Paviab, Pavia, Italy
A. Braghieria, F. Fallavollitaa,b, A. Magnania,b, P. Montagnaa,b, S.P. Rattia,b, V. Rea, M. Ressegotti, C. Riccardia,b, P. Salvinia, I. Vaia,b, P. Vituloa,b
INFN Sezione di Perugiaa, Universit`a di Perugiab, Perugia, Italy
L. Alunni Solestizia,b, M. Biasinia,b, G.M. Bileia, C. Cecchia,b, D. Ciangottinia,b, L. Fan `oa,b,
P. Laricciaa,b, R. Leonardia,b, E. Manonia, G. Mantovania,b, V. Mariania,b, M. Menichellia, A. Rossia,b, A. Santocchiaa,b, D. Spigaa
INFN Sezione di Pisaa, Universit`a di Pisab, Scuola Normale Superiore di Pisac, Pisa, Italy
K. Androsova, P. Azzurria,14, G. Bagliesia, J. Bernardinia, T. Boccalia, L. Borrello, R. Castaldia, M.A. Cioccia,b, R. Dell’Orsoa, G. Fedia, L. Gianninia,c, A. Giassia, M.T. Grippoa,28, F. Ligabuea,c, T. Lomtadzea, E. Mancaa,c, G. Mandorlia,c, L. Martinia,b, A. Messineoa,b, F. Pallaa, A. Rizzia,b, A. Savoy-Navarroa,30, P. Spagnoloa, R. Tenchinia, G. Tonellia,b, A. Venturia, P.G. Verdinia
INFN Sezione di Romaa, Sapienza Universit`a di Romab, Rome, Italy
L. Baronea,b, F. Cavallaria, M. Cipriania,b, N. Dacia, D. Del Rea,b,14, M. Diemoza, S. Gellia,b, E. Longoa,b, F. Margarolia,b, B. Marzocchia,b, P. Meridiania, G. Organtinia,b, R. Paramattia,b, F. Preiatoa,b, S. Rahatloua,b, C. Rovellia, F. Santanastasioa,b
INFN Sezione di Torinoa, Universit`a di Torinob, Torino, Italy, Universit`a del Piemonte Ori-entalec, Novara, Italy
N. Amapanea,b, R. Arcidiaconoa,c, S. Argiroa,b, M. Arneodoa,c, N. Bartosika, R. Bellana,b, C. Biinoa, N. Cartigliaa, F. Cennaa,b, M. Costaa,b, R. Covarellia,b, A. Deganoa,b, N. Demariaa, B. Kiania,b, C. Mariottia, S. Masellia, E. Migliorea,b, V. Monacoa,b, E. Monteila,b, M. Montenoa,
M.M. Obertinoa,b, L. Pachera,b, N. Pastronea, M. Pelliccionia, G.L. Pinna Angionia,b, F. Raveraa,b, A. Romeroa,b, M. Ruspaa,c, R. Sacchia,b, K. Shchelinaa,b, V. Solaa, A. Solanoa,b, A. Staianoa, P. Traczyka,b
INFN Sezione di Triestea, Universit`a di Triesteb, Trieste, Italy
S. Belfortea, M. Casarsaa, F. Cossuttia, G. Della Riccaa,b, A. Zanettia
Kyungpook National University, Daegu, Korea
D.H. Kim, G.N. Kim, M.S. Kim, J. Lee, S. Lee, S.W. Lee, C.S. Moon, Y.D. Oh, S. Sekmen, D.C. Son, Y.C. Yang
Chonbuk National University, Jeonju, Korea
A. Lee
Chonnam National University, Institute for Universe and Elementary Parti-cles, Kwangju, Korea
H. Kim, D.H. Moon, G. Oh
Hanyang University, Seoul, Korea
J.A. Brochero Cifuentes, J. Goh, T.J. Kim
Korea University, Seoul, Korea
S. Cho, S. Choi, Y. Go, D. Gyun, S. Ha, B. Hong, Y. Jo, Y. Kim, K. Lee, K.S. Lee, S. Lee, J. Lim, S.K. Park, Y. Roh
Seoul National University, Seoul, Korea
J. Almond, J. Kim, J.S. Kim, H. Lee, K. Lee, K. Nam, S.B. Oh, B.C. Radburn-Smith, S.h. Seo, U.K. Yang, H.D. Yoo, G.B. Yu
University of Seoul, Seoul, Korea
M. Choi, H. Kim, J.H. Kim, J.S.H. Lee, I.C. Park, G. Ryu
Sungkyunkwan University, Suwon, Korea
Y. Choi, C. Hwang, J. Lee, I. Yu
Vilnius University, Vilnius, Lithuania
V. Dudenas, A. Juodagalvis, J. Vaitkus
National Centre for Particle Physics, Universiti Malaya, Kuala Lumpur, Malaysia
I. Ahmed, Z.A. Ibrahim, M.A.B. Md Ali31, F. Mohamad Idris32, W.A.T. Wan Abdullah,
M.N. Yusli, Z. Zolkapli
Centro de Investigacion y de Estudios Avanzados del IPN, Mexico City, Mexico
Duran-Osuna, M. C., H. Castilla-Valdez, E. De La Cruz-Burelo, I. Heredia-De La Cruz33,
R. Lopez-Fernandez, J. Mejia Guisao, R.I. Rabad´an-Trejo, G. Ramirez-Sanchez, R. Reyes-Almanza, A. Sanchez-Hernandez
Universidad Iberoamericana, Mexico City, Mexico
S. Carrillo Moreno, C. Oropeza Barrera, F. Vazquez Valencia
Benemerita Universidad Autonoma de Puebla, Puebla, Mexico
I. Pedraza, H.A. Salazar Ibarguen, C. Uribe Estrada
Universidad Aut ´onoma de San Luis Potos´ı, San Luis Potos´ı, Mexico