DOCUMENTOS DE TRABALHO
WORKING PAPERS
GESTÃO
MANAGEMENT
Nº 03/2009
THE R
2PUZZLE
Paulo Alves
Universidade Católica Portuguesa (Porto) and Lancaster University
Ken Peasnell
Lancaster University
Paul Taylor
The R
2Puzzle
Paulo Alves1 Ken Peasnell2 Paul Taylor2
February, 2008
Abstract
Previous research has argued that the degree of co-movement of stock returns (the R² of a market regression) at country-level can be explained by the interaction of firm-specific and market-wide information. The R² measure has been used to investigate a number of issues of potentially great importance to accounting, such as whether countries with poor corporate governance regimes and weak legal protection of private property rights are more likely to have poor information environments or to assess the informativeness of prices. To date, only limited research has been carried out to assess the reliability of an information interpretation of the R² measure at a firm-level within a country rather than at an aggregate country level. In this paper we now examine the properties of stock returns co-movement at the firm-level within two countries, UK and USA, thereby being able to filter out certain extraneous factors that could arise in cross-country settings. We analyse the performance of this overall measure by triangulating it with other information-related measures which previous research has suggested capture partial aspects of the information environment. We find some serious flaws in the methodology and our findings suggest that when using it at firm-level, it may be being driven by other factors related to uninformed trading.
Keywords: Information; R²; firm-specific information; market-wide information;
volatility; disclosures; comovement. 1
Portuguese Catholic University and International Centre for Research in Accounting (Lancaster University Management School): [email protected]
Financial support was provided by Fundação para a Ciência e Tecnologia – Portugal (ref. SFRH/BD/9147/2002).
2
Lancaster University, Management School
Comments and suggestions from seminar participants at the British Accounting Association Doctoral Colloquium, 29th Congress of the European Accounting Association (Ireland), Lancaster University (UK), Monash University (Australia) and School of Economics and Management (ISEG – Portugal) are gratefully acknowledged. We would also like to thank David Ashton, Martien Lubberink and Steve Young for their valuable comments and suggestions. Finally, we are grateful to the Institutional Brokers Estimate System (I/B/E/S), service of Thomson Financial, for providing us with the data as part of a broad academic program to encourage earnings expectations research.
1. Introduction
Roll‟s (1988) seminal paper tests the asset pricing paradigm that stock returns can be explained by pervasive factors, industry influences and events unique to the firm, by using the R² of a regression of firm‟s returns on economy-wide factors. Results show that asset pricing theories explain poorly ex post stock returns, leaving the causes of this poor performance open to debate. Roll (1988, 542) concludes: “The results are not very gratifying. … We ought to discover either (a) measurable influences that will explain the remaining [R²] or (b) a coherent reason why it should forever remain unexplained.” Arguably, however, the biggest impact this research has had on the finance literature has been in the use of R² as a measure of the quality of firm-specific information available to investors rather than of the adequacy of an asset pricing theory. As Morck et al. (2000, 216) states, “[s]tock returns reflect new market-level and firm-market-level information. As Roll (1988) makes clear, the extent to which stocks move together depends on the relative amounts of firm-level and market-level information capitalized into stock prices.”
Recent research using Roll‟s (1988) methodology presents strong conclusions on the quality of information environments both at the country-level and at the firm-level. Morck et al.‟s (2000) landmark paper in this new stream of research argues that R² captures the quality of investor protection rights and corporate governance regimes and, therefore, the amount of firm-specific information incorporated into prices.
The critical issue is whether R² is an adequate measure of the quality of the firm-specific information environment. There is very little evidence to support the use of R² for this purpose. The papers using this methodology take for granted that R² is a robust measure without questioning its suitability. There is a huge gap between Roll‟s
(1988) conclusion and Morck et al.‟s (2000) assumption about the quality of the measure. Furthermore, Roll‟s (1988) objective is clearly different. He views high R²s favourably, that is as being indicative of an asset price theory having descriptive power, while Morck et al. (2000) regards low R²s as being indicative of a good information environment where investors have access to high quality firm-specific information.
Ashbaugh-Skaife et al. (2005) replicate Morck et al. (2000) in order to test the soundness of their conclusions and then use a battery of tests relating R² to firm fundamentals that theory and prior empirical research suggest capture some of the key aspects of the quality of a firm‟s information environment (e.g. abnormal returns, analyst forecast errors, analyst following, firm size, stock turnover, whether the firm has made a loss, and standard deviation of sales). Their results provide little support for an informational interpretation of R². Our study extends Ashbaugh-Skaife et al.‟s (2005) results in a number of ways, notably by relaxing some of the assumptions made in the R² literature1. Our results confirm and strengthen their conclusions of the inadequacy of R² as a measure of information.
The literature based on using R² as a measure of the overall quality of the information environment also presents a methodology for disentangling the overall measure into the effects of pervasive factors (market and industry) and firm-specific factors, by decomposing the R² into components representing these factors (Durnev et al. 2001; Morck et al. 2000). We extend our analysis to examine such decompositions and find that they share similar problems to R² as measures of information quality.
1 Namely, we relax sample constraints related to extreme observations, previously classified as errors and we also analyse model constraints resulting from the deletion/inclusion of an industry returns variable.
We use firm-level data from the USA and the UK to investigate the performance and validity of within-country firm-level R² and its components as measures of firm-specific information. We focus on these two countries for two reasons. Firstly, these two countries have highly developed capital markets, strong investor property rights and disclosure regimes oriented to serving investor needs. Secondly, Morck et al.‟s (2000) findings indicate that, despite these similarities, the average R² for the UK is three times larger than that for the USA, suggesting that the latter has a markedly better information environment. By focusing on these two countries, we are able to abstract from the problems involved in comparing countries at different stages of development in their capital markets. We use firm-level data to enable us to explore the relationship between firm-specific characteristics and the measures proposed for the quality of the information environment.
Our results confirm the declining trend over time in overall R² found in prior literature. Alternative explanations can be used to describe such a decline. Morck et al. (2000) argue that it is due an increase of firm-specific information. However, such trend can also be explained by an increase in firm-specific stock returns‟ volatility as documented in Campbell et al. (2001). It is beyond the scope of this thesis to determine the determinants of such an effect. Contrary to Morck et al. (2000), our results indicate that the relevance of pervasive factors has remained roughly constant over the last twenty years.
Previous research has shown that bid-ask spread and book-to-market ratio are important attributes related to the quality of a firm‟s information environment. Bid-ask spread is a widely used indicator of the information asymmetries facing market makers (e.g. Brooks 1994; Copeland and Galai 1983; Glosten 1987; Glosten and Milgrom 1985). Book-to-market ratio captures growth expectations (e.g. Penman
1996) and inadequacies of the accounting model to reflect value creation on a timely basis (e.g. Chambers 2002; Lev 2001; Lev and Zarowin 1999). Neither of these measures are employed in the Ashbaugh-Skaife et al. (2005) and Kelly (2005) studies of R². We extend these other studies by including bid-ask spread and book-to-market, together with firm size and analyst following, in our regression models. We find that these variables are poorly correlated with R² and its components.
The remainder of the paper is organised as follows: Section 2 summarises prior work in this area. Section 3 presents our research design. Section 4 presents our sample selection and the construction of metrics. Section 5 presents empirical tests and a discussion of the results. Finally, section 6 draws conclusions and establishes the path for future research.
2. Prior research
We start by considering the original use made of R² by Roll (1988) and the extensions introduced by subsequent researchers in this tradition.
Roll (1988) regresses firm‟s returns on economy-wide factors2 to test the asset paradigm that stock returns can be explained by pervasive factors, industry influences and events unique to the firm. High R²s mean that pervasive factors have high explanatory power. Conversely, a low R² indicates that firm-specific factors not
2 Roll (1988) starts by using only market returns as an explanatory variable and then extends his model to incorporate an industry factor. The addition of the industry factor improves the model‟s coefficient of determination and, therefore, results in a more refined measure of the residuals that are interpreted relating to firm-specific information. Roll (1988) uses the one factor CAPM and the multi factor APT model; both models produce similar results.
included in the model are driving returns.3 To verify the extent to which firm-specific events are affecting R², he runs the same regression excluding from the sample all dates corresponding to firm-specific events. Results from this second approach seem “to imply the existence of either private information or else occasional frenzy unrelated to concrete information” (Roll 1988, 566). Cornell (1990) and Robin (1993) take this further, by excluding days when firm-specific trading volume is high, arguing that such days are likely to be ones where there is an abnormal firm-specific information flow. Their results are stronger than Roll‟s (1988) but the picture is still essentially unchanged. Finally, Brown (1999) sharpens the focus by eliminating dates when both firm-specific information is made publicly available and dates when corporate insiders acquired or sold shares, aiming to disentangle the effect of both private and public information. He finds that R² remains largely unchanged by the exclusion or inclusion of information days and concludes that “… economists‟ inability to explain asset price movements is the result of either noise or naïve asset price models” (Brown 1999, 633). In short, these later studies have not been able to rule out Roll‟s (1988) conjecture that low R²s might at least in part be driven by behavioural factors.
A new stream of research has developed, using Roll‟s (1988) methodology. This new work assumes that the R² methodology is robust enough to allow conclusions to be drawn about the quality of countries‟ information environments, Morck et al. (2000) show that higher R²s are associated with countries with poor
3 A low R² could also be due, of course, to the omission of other nondiversifiable factors priced by the market. In other words, the effectiveness of R² as a measure of the presence or absence of (diversifiable) firm-specific information depends on how good our asset pricing theories are. This aspect of the problem is beyond the scope of the present paper.
economic performance, weak corporate governance and inadequate protection of private property rights. The reasoning underlying this perspective is that information-based trading becomes more attractive in the presence of strong property rights that allow more firm-specific information to be capitalised and, therefore, results in less stock price synchronicity. Furthermore, they show that in the USA and the UK R²s are very low compared to most other countries, which they attribute to the very high levels of firm-specific information available to investors in America and Britain.
Morck et al. (2000) also present a decomposition of R² into two components reflecting firm-specific variation and market-wide variation. Disentangling these two effects they suggest allows a more refined study of the drivers of R² and, consequently, a potentially more precise interpretation of the quality of firm-specific information. As other researchers have ignored this suggested decomposition of R² and its reliability as a measure of information is still open to debate, and its performance is evaluated in this paper.
Jin and Myers (2004) seek to explain Morck et al‟s (2000) finding that R²s are higher in countries with less developed capital markets and weaker corporate governance regimes.4 They provide a model to explain how control rights and the opaqueness of information affect managerial behaviour. Using three measures of opaqueness (a survey-based measure of the adequacy of financial disclosure, size of the audit profession, and diversity of analyst forecasts); they find that countries where firms tend to be more opaque have higher R² and higher frequencies of crashes.
4See also Li et al. (2003). They find that R² is negatively associated with the degree of openness of capital markets. They also find that the negative relationship only holds when the countries have strong corporate governance regimes; otherwise, the relationship is positive.
Following Morck et al. (2000), they compute R² for each firm in their sample and aggregate them into country-level R²s.
Generally speaking, in a cross-country setting, prior research suggests that the R² measure seems to perform well as an inverse proxy for firm-specific information being capitalised into prices, in the sense that R² rankings correlate reasonably well with prior expectations about the country information environment. Alves et al. (2006) suggests this interpretation is faulty. The same rationales applied at the firm-level and, within a given country, would lead to the expectation that an individual firm‟s R² would be associated with the quality of its firm-specific environment.
Some studies also have employed the R² methodology at the firm level. Durnev et al. (2001) find that firms with lower R²s exhibit higher association between current returns and future earnings, indicating that R² appears to be capturing some relevant aspects of the information environment. However, caution must be exercised in interpreting this result as Ashbaugh-Skaife et al.‟s (2005) replication shows that results are very sensitive to country and sample selection.
Piotroski and Roulstone (2004) address the question of why some US firms exhibit a higher degree of co-movement than others, by examining the effect of trading activities of insiders, institutional investors and financial analysts, using R² to measure the relative amount of firm-specific information capitalised into prices. Results show that the trading activities of these market participants affect the information environment at firm-level, but in different directions: more analyst activity and higher institutional holdings result in more stock return synchronicity, while greater insider trading results in more firm-specific information being capitalised into prices. They argue that the ultimate goal of analysts is to incorporate
more industry-level information into prices and, by doing so, this leads to more co-movement. The authors acknowledge that stock return synchronicity could also be due to uninformed trading, but treat this as a second-order effect. However, their research design relies very heavily on a strong interpretation of Roll‟s (1988) results and on an untested extrapolation of Morck et al.‟s (2000) country-level findings to a firm-level framework.
More closely related to our study, Ashbaugh-Skaife et al. (2005) use Morck et al.‟s (2000) approach and confirm their results on the behaviour of R², but disagree on its interpretation. Using R² at the firm-level in a small set of countries, Ashbaugh-Skaife et al. (2005) find that R² is only weakly associated with measures of firm fundamentals (e.g. abnormal returns, analyst forecast errors, analyst following, firm size, stock turnover, whether the firm has made a loss, and standard deviation of sales). Using a similar approach but a different set of information environment proxies, Kelly (2005) also finds that R² is a noisy measure of firm-specific information, using a mix of market and micro-structure variables, such as trading cost, illiquidity, probability of an informed trade, probability of an information event, amongst others.
A critical assumption of the papers using the R² methodology is that stock return volatility arises only from the arrival of new information in the market. However, evidence on this assumption is at best mixed (Lee and Liu 2006). Shleifer and Vishny (1997) show that demand unrelated to firm-specific fundamentals affects returns volatility.5 Barberis et al. (2005) document changes in R² around additions and
5
See also the earlier work by Shiller (1981) and West (1988) suggesting that firm-specific price volatility is too large to be associated with changes in firms‟ fundamentals.
deletions to the S&P 500. Greenwood and Sosner (2002) and Greenwood (2005) document similar results for the Nikkei 225 stock index, suggesting that demand shocks not related to stock price fundamentals are an important determinant of stock price co-movement: addition to the index results in an overall increase in R² from 0.04 to 0.15 and deletion from the index results in a reduction from 0.28 to 0.19.
A related body of work considers the role of investors following a company. Lee et al. (1991), Pindyck and Rotemberg (1993), Barberis and Shleifer (2003), Andrade et al. (2005) and Kuman and Lee (2005) document the impact of retail investors and uninformed investors on stock co-movement, showing that trading activities by these classes of market participants are characterised by a common directional component.
Several studies have used volatility-type metrics as a measure of information asymmetries (e.g. Bhagat et al. 1985; Blackwell et al. 1990; Dierkens 1991). These studies assume that both managers and investors have the same knowledge about market wide factors and, therefore, information asymmetries will be higher when managers withhold a larger portion of relevant firm-specific information. Viewed from this perspective, firm-specific volatility is a measure of how much firm-specific information is not being shared by managers.
Campbell et al. (2001) show that market volatility has been stable over time while firm-specific volatility has been increasing. As the previous discussion makes clear, this could be due either to improved firm-specific information or to increased noise trading, or both. Bennett and Sias (2004) argue that firm-specific risk has increased over the last three decades due to the growth of riskier industries, the increase of small stocks in the market and a decline in industry concentration. This explanation points to a decline in firm-specific information: less is known about
riskier industries and smaller firms. This is consistent with the findings of Rajgopal and Venkatachalam (2005) that earnings have become of poorer quality and more volatile, with the effect being stronger for newly listed stocks (Wei and Zhang 2006).
As our brief review of the literature makes clear, the picture concerning R² as a measure of information quality is a mixed and incomplete one. Our research design attempts to consolidate some of the insights of these disparate studies and to take research a step forward by both exploring existent gaps in current literature and extending the analysis to the R² components.
Previous research using R² as a measure of firm-specific information deletes extreme returns on the assumption that they are errors in the data.6 Our study explores and empirically investigates the validity of such error deletion procedures and finds that the „error in data justification‟ for data deletion is completely erroneous and, therefore, raises severe doubts over the validity of previous research conclusions. The only valid reason for eliminating extreme returns from the database is if they are data errors. Valid extreme returns are central to our understanding of the information environment7. We show the effects of including such extreme returns on the behaviour of R².
We also explore the opaqueness argument put forward by Jin and Myers (2004). Opaqueness is clearly a strong determinant of the quality of the information
6 As an example, Morck et al (2000) argues that bi-weekly returns above twenty-five percent are errors in the data and, therefore, are deleted. Ashbaugh-Skaife et al. (2005) rely on the same assumption when replicating Morck et al‟s (2000) and in further tests of reliability of the informational interpretation of R².
7 They can be either the result of noise trading or the result of information events. If extreme returns are caused by noise trading, then their erroneous deletion will force the R² measure to appear incorrectly to be artificially related to information. However, if they are the result of information shocks, then their exclusion from the analyses would clearly be erroneous as their inclusion would then be central to the understanding of the information environment.
environment, leaving more space to private information. Our model captures the level of opaqueness by including a measure of the degree of the information asymmetry (the bid-ask spread).
The model used to compute R² varies across studies. The most common models tend not to use a variable to capture industry effects and to include a variable capturing relationship with the US market. We closely follow Roll‟s (1988) original paper‟s reasoning and therefore include an industry variable. Firm-specific information is measured by the R2 based on the residuals of the returns regression and, consequently, the inclusion of this variable not only follows the original rationale of the model more closely, but also allows the measurement of the firm-specific variation to be more precise. Contrary to prior studies, we do not include a variable capturing the effect of US returns. This effect could be market, industry or firm specific and, therefore as argued later, is better included in the model by these factors.
Finally, we make a new contribution to the literature by providing an empirical analysis of the reliability of the firm-specific and market-wide variation components of R2 as well as to the overall measure previously examined. We are particularly interested in the component reflecting firm-specific variation, because Morck et al. (2000) argue that it should be a more precise measure of the quality of the firm-specific information.
3. Predictions and research design
We test the reliability of the informational interpretation of R² by analysing the relationship between R² and a set of variables that we consider to capture partial
attributes of the overall information environment8. Previous research has demonstrated the association between the information environment and the information-related variables chosen for our main tests (market value, bid-ask spread, book-to-market ratio and analyst following). If R² is a good (inverse) proxy for firm-specific information, we expect it to be associated with those information content variables. Conversely, if R² is a poor measure, then we would not expect it to be related to measures that capture aspects of the information environment. Additionally, we use analysts consensus (as measured by the standard deviation of EPS one-year forecasts). We now briefly describe the rationales supporting the link between the quality of the information environment and the variables we have chosen to capture some of its attributes. There are several links between size and the quality of the information environment, not all pointing in the same direction. Larger companies tend to be more diversified and have a large number of different business segments. Therefore and everything else equal, their information is harder to understand which results in a worse information environment compared to a small company operating in a single industry. On the other hand, smaller firms tend to have fewer analysts following them and fewer investors interested in them, with the result that firm-specific information might be less readily impounded into prices. This might be compounded by small firms being more reluctant to report information that might be used by competitors. These two factors suggest that small firms might have worse information environments than their larger brethren.
8 Other related studies use slightly different approaches. While we focus on market-based variables, other studies give more emphasis to accounting-based measures (Ashbaugh-Skaife et al. 2005) or microstructures variables (Kelly 2005).
Lang and Lundholm (1993) present several additional information-based arguments to justify a positive association between disclosures and firm size, measured by market value. Firstly, it is less expensive for larger companies to widely disseminate information compared to smaller firms. Secondly, the amount of firm-specific information available is related to transaction costs. Lower transaction costs facilitate reaping benefits from private information and this encourages the search for such information and leads to better information environments. Larger firms have more liquidity and higher trading volumes, thus transaction costs are on average lower for such firms. Thirdly, the amount of information can also be partially explained by litigation cost theory. Larger firms have deep-pockets and are thus are more susceptible to litigation. In order to avoid the costs of litigation, companies tend to increase disclosures (Field et al. 2005; Skinner 1994, 1997). Finally, there is a market for information and analysts exploit this market, producing and disseminating private information. Larger companies attract more investors and, therefore, represent a better business opportunity for analysts (Bhushan 1989). All these arguments allow us to predict that larger firms should have richer information environments, and as such should have lower R²s than their smaller brethren.
Companies with low book-to-market ratios are valued as growth companies. Book-to-market ratios reflect intangible assets and rents which are not shown in the balance sheet (AICPA 1994; Eccles et al. 2001; Lev and Zarowin 1999). Whatever the cause, for companies with a low book-to-market ratio the market expects future accounting rates of returns to be higher than in the past. In order to attract capital, growth companies have economic incentives to engage in credible reporting practices to align their investment strategies with investors‟ interests (Lambert et al. 2005; Myers and Majluf 1984) and have to disclose more information to overcome the
deficiencies of the financial reporting model. We therefore predict that companies with low book-to-market ratios disclose more firm-specific information.
According to finance theory (Glosten 1987; Glosten and Milgrom 1985), the existence of information asymmetries between investors can give rise to an adverse selection problem and, consequently, reduce liquidity. Companies can avoid this adverse selection cost by reporting more information (Francis et al. 2002; Lambert et al. 2005; Leuz and Verrecchia 2000) and more precise information (Diamond and Verrecchia 1991; Kim and Verrecchia 1991). Empirical research finds evidence of such an association between disclosure strategies and a proxy for adverse selection costs – the bid-ask spread (Cohen 2003; Leuz and Verrecchia 2000). The bid-ask spread theoretically has been divided into three components: order processing, inventory and adverse selection (George et al. 1991; Glosten 1987; Glosten and Harris 1988; Huang and Stoll 1997; Stoll 1989). For the purposes of this study, we are interested in the adverse selection component, but empirically such decomposition has not proven to be reliable or more informative (Affleck-Graves et al. 1994; Brooks 1994; Lin et al. 1995; McInish and Ness 2002) and so we focus on the bid-ask spread itself.9 We, therefore, predict smaller bid-ask spreads to be associated with less information asymmetry and thus with more firm-specific information. Firm size also affects the relation between bid-ask spreads and disclosures. Larger companies have higher levels of liquidity and, consequently, lower transaction costs and lower bid-ask spreads (Easley et al. 1996).
9 An additional reason for not attempting to disaggregate the bid-ask spread is that the order processing and inventory holding components are themselves likely to reflect the quality of the firm‟s information environment.
Analysts produce and signal information to the market in a way that investors believe to be credible and companies use analysts as a complementary channel to disclose information. These factors provide incentives for firms to try to maximize the number of analysts following (Lang and Lundholm 1996). Analysts are in the market for information and tend to follow the companies that maximise their (i.e. analysts‟) revenues, which can be achieved by focusing on companies with a larger shareholder basis, i.e. more potential buyers of information, or on stocks where the quality of the analyst service is crucial, i.e. more complex entities. The number of analysts is often used as a proxy for information asymmetry and the quality of a company‟s information environment. The informational interpretation of R², would suggest that higher analyst following should be associated with lower R²s. However, Piotroski and Roulstone (2004) argue that more analysts lead to more incorporation of market and industry information into prices and, therefore, high analyst following should result in higher R²s. Therefore, the prediction of the direction of the relationship remains an open question.
4. Sample selection and construction of metrics
Our sample comprises UK and US data for the period 1985-2004. Both capital markets are well established and provide an informational setting that embodies a strong set of institutional factors designed to protect investors. Nevertheless, as stated earlier, Morck et al. (2000) document that the average R² is three times higher in the UK than in the USA. Therefore, the use of these two countries allows us to explore such differences between the two and potentially to draw more robust conclusions than if we focused on countries with less
well-developed capital markets characterised by more heterogeneous investor protection environments.
We identified all listed companies included on Datastream (UK) and CRSP (USA) for the period 1985-2004, totalling 5,674 observations for the UK and 21,085 observations for the USA, including both financial and dead companies. We do not consider data before 1985 for two reasons: before this date (i) the number of UK companies on the database becomes too small to make reliable inferences regarding the change in R² and (ii) data on bid-ask spreads and analyst following declines markedly.
All companies were included in our samples other than those that failed to meet the following criteria. We excluded observations without available information (2,009 for the UK) and observations that for a particular year have less than 26 weekly observations for returns (31 for the UK and 419 for the USA). We also excluded all secondary issues of shares (751 for the USA) in order to focus exclusively on common stocks. To measure industry returns, we use the relevant database classification and exclude all observations without a valid industry classification (158 for the UK).10 Finally, to mitigate the influence of extraneous environmental and governance factors, we exclude foreign companies (857 and 1,941, for the UK and USA respectively).11 Our final sample includes 2,619 and 17,974 companies, for the UK and USA respectively.
10 We find that industry composition is stable over time and the proportion in each industry in each country is virtually constant.
11 A company is classified as foreign if it meets one of the following criteria: headquarters outside UK or USA; London Stock Exchange or an American stock exchange is not the main stock exchange; or the shares were issued outside UK or USA.
Following Roll‟s (1988) methodology, we used a modified market regression to capture the level of stock returns explained by market and industry variables. Previous research is not unanimous on the inclusion of an industry variable and some studies include an additional explanatory variable for US market returns.
The decision in prior studies to include or not to include an industry variable is driven by the focus of the study. Single country or firm-level studies tend to include an industry variable, whilst cross-country studies tend not to. We attribute this difference to the difficulties of defining industries in countries with small capital markets.12 The distinction between industry and firm-specific information is a grey area and the fewer the firms in the industry the harder it is to disentangle these two categories.
We have also not included US stock market returns as a market-wide factor for UK companies, contrary to certain previous research that includes this variable on the basis that most economies are at least partially open to foreign capital (e.g. Morck et al. 2000). Our reasons are twofold. First, if it is used to control the fact that only some companies have exposure to the US economy, than this is firm-specific information. Second, if it attempts to capture the global effect of the US market then this is a market-wide effect (or industry effect if specific to an industry) already included in the model.
Equation (1) regresses company j’s returns (RCjwt) on market‟s returns
(RMjwt) and industry‟s returns (RIjwt):
12
For instance, the Portuguese market has 76 companies that match our sample selection criteria and 22
jwt jwt jt jwt jt jt jwt RM RI RC (1)
All returns are measured on a weekly basis (w) for each year (t). To prevent spurious correlations – more severe in industries with fewer companies – market and industry returns are value-weighted averages excluding company j. We compute market and industry returns as follows:
n j i i iwt n j i i iwt iwt jwt jwt RC MV MV RI RM 1 1 ) ( (2)where RMjwt (RIjwt) is the market (industry) return in week w of year t, excluding firm
j, MViwt is company i’s market value and n is the number of companies in the market
(industry). RCiwt is company i‟s returns in week w of year t. We use weekly data to
mitigate thin trading problems.
Equation (1) yields a R2 value per company-year that has been interpreted as an inverse proxy for firm-specific information (Morck et al. 2000). A large R2 implies that the market and the industry explain a large proportion of the company‟s returns. Conversely, a small R2 means that such pervasive factors poorly explain the company‟s returns and, therefore, there are other factors not common to market or industry driving the measure. We also compute an annual R² value for the entire sample (country) by weighting individual R2s by SST (Durnev et al. 2001; Morck et al. 2000):
n j jt n j jt jt t SST SST R R 1 1 2 2 (3)where SST is the total sum of squares of the regression.
In our tests we use the logistic transformation of R2 calculated as:
2 2 1 ln jt jt jt R R LTRSQ (4)
The use of the logistic transformation of R² is justified by R² being bounded between zero and one (Atkinson 1985). It behaves in the opposite direction to the usually used raw R² measure: a high R² leads to a lower LTRSQ and vice versa. Therefore, whereas previously lower levels of R² are supposedly associated with better information environments, after the transformation, LTRSQ has a positive relationship with the quality of information environment.
Finally, we construct a yearly bid-ask spread, using Equation (5) below, where BASjt is the bid-ask spread for company j in year t. ASKjwt (BIDjwt) is the ask
(bid) price for company j in week w of year t (e.g. Cohen 2003; Greenstein 1994). Yearly BAS is then obtained by averaging over the number of weeks (n).
n BID ASK BID ASK BAS w jwt jwt jwt jwt jt 1 2
(5)In our study, we use two approaches to capture the effect of analyst following. Firstly, we take into account the total number of analysts following a specific company during each year. Secondly, we set a dummy variable equal to one if the number of analysts following a company is greater than or equal to the industry average and set it equal to zero if not.
All information was obtained directly from Datastream (UK) and CRSP (USA) except data on analyst following that were gathered from IBES. Bid-ask spread
data are not available before 1986. When constructing the book-to-market ratio we deleted observations with negative book values. For the USA, book value was obtained from Compustat. Analyst following for each firm-year is measured by the number of forecasts in IBES by different analysts during the year and is merged with
Datastream and CRSP data. If a company exists in Datastream and CRSP but we
failed to match it to an IBES company, we assume the company is not being tracked and set the number of analysts following it to zero.
For some of these information-related variables, there is no information available for the complete period and so company coverage is not identical. We therefore adjust our sample depending on the years and variables used and we report these adjustments.
In order to carry out some further exploratory and sensitivity analyses we used the analysts‟ forecasts standard deviation provided by IBES. However, we found there were only a relatively small number of observations for the UK. The use of IBES summary statistics might introduce some survivorship bias. Thus we only use this data in some exploratory analyses and, therefore, care should be exercised when generalizing the results.
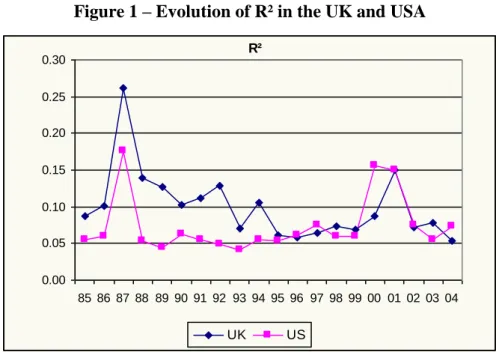
Figure 1 shows the evolution of the weighted average country-based annual R² for the last 20 years. Such R²s for the UK are higher for the first half of the period and slowly decline over time. After 1995, the two countries have similar R²s. The most striking features are two spikes in 1987 and 2000-2001, the former corresponding to the stock market crash of 1987 and the latter to the hi-tech bubble and its subsequent bursting.
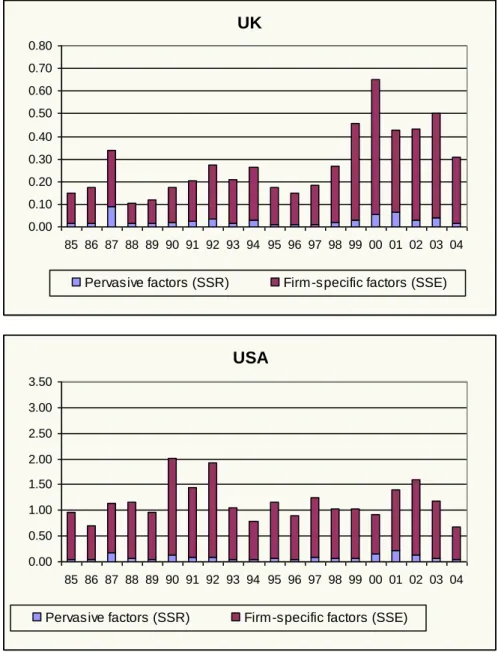
During the crash of 1987, R² reached maxima of 26% and 18% in the UK and USA, respectively. Figure 2 shows that, although there was an increase in the firm-specific component, this large spike was also associated with an increase in pervasive factors. Another characteristic of the crash of 1987 is that R² and its components immediately returned to values similar to those prior to the crash. A similar effect has been observed in the US market by Campbell et al. (2001) regarding changes through time in firm-specific volatility. This type of behaviour is at odds with the explanations given by Morck et al. (2000). Corporate governance and investor protection rights do not change so quickly and so dramatically and neither do firms‟ fundamentals.
Table 1 and Table 2 present descriptive statistics13 for the pooled time-series-and-cross-sectional samples. In
13
Descriptive statistics show the existence of some potential outliers, we run our analyses with a sample where the outliers are removed and results are not affected.
Table 1, we can see that apart from the effects of market value and the number of observations, the other variables have broadly similar distribution characteristics in both countries.
Table 2 shows that the bid-ask spread variable behaves quite differently over time in the two countries. In the USA, the bid-ask spread has been declining for the last 20 years. On the other hand, in the UK, the bid-ask spread presents an increasing trend, from a minimum of 0.02 (1986, 1987 and 1989) to a maximum of 0.15 (2002-2003). This pattern is inconsistent with an informational interpretation of R² and its components. Work by Amihud and Mendelson (2003) in the USA suggest that the order processing and inventory components of bid-ask spread are decreasing over time and that secular increases in bid-ask spreads must be due to the adverse selection component that arises from information asymmetry between investors.
The book-to-market ratio varies over the period examined, with no pattern evident. It is worth noting that the book-to-market ratio seems to increase around major stock markets crash, however the different pattern shown for both countries does not have a straightforward explanation.
The number of companies being followed by analysts increases over time, reaching the maximum in 1998 (1,106 for the UK and 4,494 for the USA) and then decreases. In our models, we lagged our measure of analysts per firm by one year to reflect the effect of the number of analysts before its informational effect is reflected in R²s and because analysts need to have been following a company for a while before reporting forecasts for it.
Table 3 reports Pearson and Spearman‟s correlation coefficients for all variables used in the multivariate analysis. The correlation between R² and all
individual information-related variables is inconsistent with an information interpretation of R². It indicates that those companies which are smaller, have larger bid-ask spreads, higher book-to-market ratios and fewer analysts following them have lower R²s.
5. Empirical tests and discussion of results
5.1. The relationship between R² and information-related
variables
Theory discussed earlier predicts a positive association between firm size, analyst following and the amount of firm-specific information. It predicts a negative association between the degree of information asymmetries, book-to-market ratio and the amount of firm-specific information. In this section, we will analyse the reliability of the R² methodology by using a set of regressions that aim at testing the relationship between R²-based measures and a vector of firm-specific attributes related to the quality of the information environment. All results are reported using the Fama-Macbeth procedure (Campbell et al. 1997)14.
In our first set of tests, we use the Logistic Transformation of R² (LTRSQ), Equation (4), and the raw R², for comparison purposes, as dependent variables. Our analysis will focus mainly on the LTRSQ, due to the statistical problems associated
14
Initial regressions are run using Equation (1) and the R² (and other relevant information) per firm-year from each regression is recorded and used as the dependent variable in a second set of firm-yearly regressions where our set of information-related variables are used as explanatory variables. From this second regression, we obtain a time series set of coefficient estimates and t-statistics for each explanatory variable, and a time-series set of annual R²s. Mean coefficients and R²s are reported along side Fama-Macbeth t-statistics, which are computed based on the standard deviation from the time series set of t-statistics and are used to evaluate significance.
with bounded variables, as mentioned earlier in the paper. Our first set of regressions analyses the relationship between our dependent variables and the information-set attributes: market value (MV), bid-ask spread (BAS), number of analysts following (ANL)15 and book-to-market ratio (BM). Note that, as discussed earlier, our hypothesised directions are opposite for R2 and LTRSQ, and LTRSQ is expected to have a positive relationship with the quality of the information environment. Table 4 shows that LTRSQ is negatively associated with MV in both countries, indicating that larger companies co-move more with the market. This result is not consistent with the hypothesis that larger companies have better information environments. The result is consistent, however, with larger companies being more highly diversified than smaller ones.16
We also hypothesise that better firm-specific information environments are positively correlated to smaller bid-ask spreads. However we do not observe this relationship. In fact, Table 4 shows that for the UK, larger BAS are associated with higher levels of LTRSQ and lower levels of R². For the US results are statistically insignificant and, therefore, also do not confirm our predictions. Again, this is hard to reconcile with Morck et al.‟s (2000) interpretation of R². One can argue that BAS also reflects the issues associated to liquidity, but as we argued earlier in the paper even if this is the case, liquidity would also be associated with information and the prediction remains unchanged.
15We also run the same set of regressions again using a dummy to control for analysts coverage above or below industry‟s average and results are similar.
The sign on the ANL coefficient is negative in both countries in the LTRSQ regression. Analyst following is clearly a measure of information and results are once again incompatible with an informational interpretation of the R² methodology. An alternative explanation could be that analysts capture industry information and that their actions lead to more co-movement. We will return to this issue later on in the paper.
Finally, a low book-to-market ratio is an indicator of firms with high growth prospects. Such firms have strong economic incentives to provide the market with firm-specific information. This leads us to the understanding that there would be a negative relationship between LTRSQ and BM. Table 4 confirms this relationship for the UK and confirms a similar effect for the US but is of weaker statistical significance. Results on BM provide limited support for Morck et al‟s. (2000) interpretation of R². One should however be aware that from our vector of explanatory variables, BM is also the one that, as discussed earlier, has greater diversity of view in what it represents concerning what it reflects.
Results from Table 4 strongly suggest that the expected relationship between the R² overall measure of the quality of the information environment and other information-related variables cannot be supported on the basis of the informational perspective proposed by Morck et al. (2000) and subsequent studies. Our results are fully consistent with and complementary to the empirical findings of Ashbaugh-Skaife et al. (2005) and Kelly (2005) and the theoretical arguments of Shiller (1981) and West (1988) concerning. higher levels of stock returns volatility which is unrelated to changes in fundamentals. Moreover, as discussed earlier in the paper, by construction, the R² methodology captures changes in returns and not changes in fundamentals. Poor information environments are more likely to facilitate uninformed trading and,
therefore, smaller firms, higher bid-ask spreads, less analyst following or lower book-to-market ratios are more likely to present higher stock returns and higher levels of uninformed trading. Our results are not inconsistent with this alternative explanation of R² being driven by uninformed trading and that more information leads to less firm-specific variability and, therefore, higher R².
5.2. The R² components
Morck et al. (2000) also propose a breakdown of R² with the aim of disentangling firm-specific effects and pervasive factors. This breakdown is presented as a more refined technique to capture firm-specific information and it has been adopted in subsequent research (e.g. Durnev et al. 2001). The proposed breakdown interprets R² as the returns variation explained by the model (market and industry) relative to total variation. R2 is then the proportion of the regression sum of squares (SSR) to the total sum of squares (SST), which is in turn the sum of SSR and the sum of
squared errors (SSE). SSR is the difference between the estimated value and the
average – in other words, the part the regression model can explain. SSE reflects what is left unexplained by the model, the difference between the observed value and the estimated value, as in:
jt jt jt jt jt jt SSE SSR SSR SST SSR R 2 (6)
The breakdown proposed by Morck et al. (2000) is particularly relevant when applied to the logistic transformation of R² as it allows an additive breakdown of the measure as seen in (7).
jt jt jt jt jt jt jt jt jt LSSR LSSE SSR SSE SSR SSE R R LTRSQ ln 1 2 ln ln( ) ln( ) 2 (7)
Under this interpretation, changes in LTRSQ result from the interaction between firm-specific and pervasive factors. We interpret LTRSQ as the relevance of firm-specific information relative to market-wide information. Equation (7) shows that higher LTRSQ results when the firm-specific factor is more important relative to the market-wide factors. Equation (4) allows us to separate the two components and to use them individually in multivariate tests. LSSE is used as a measure of firm-specific information and the next set of tests extend our analyses to this component together with the LSSR. As there is general agreement in the literature concerning the determinants of pervasive LSSR factors, we focus the following discussion primarily on the LSSE results.
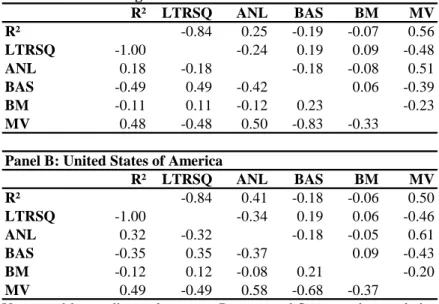
Contrary to what prior research on the behaviour of the information environment measures would lead us to hypothesise, Table 5 shows that LSSE is significantly and negatively associated with MV in both countries. Results on LSSR seem to suggest that larger firms co-move more with the market, these results are not consistent with the hypothesis that larger companies have better information environments, however it is consistent with the idea that larger companies are more highly diversified than smaller ones; in which case, we would expect the pervasive factor (LSSR) to be positively related to firm size, and this is what we observe in the
UK.17. Results on this are hard to reconcile with Morck et al.‟s (2000) interpretation of R².
The sign on ANL is positive in the LSSE regression, which is consistent with the argument that the greater the analyst following, the better the information environment. It is difficult to form a clear prediction regarding the sign of the ANL coefficient in the LSSR regression. On the one hand, analysts are a source of firm-specific information; in which case, we would expect ANL not to be significant in the
LSSR regression. On the other hand, analysts are also a source of information on
general economic and industry related news (Piotroski and Roulstone 2004). Analyst following is also likely to be related to firm size. Either or both of these two factors would lead us to predict a positive sign on ANL in the LSSR regressions, which is what Table 5 reveals. Since LTRSQ = LSSE - LSSR, it follows that the pervasive factor (LSSR) is the dominant component in explaining the LTRSQ regression results. Again, this is not consistent with Morck et al‟s. (2000) informational interpretation of R².
Finally, we predict a negative relationship between LSSE and BM. Table 5 indicates that this relationship is of weak statistical significance. In terms of pervasive factors, the greater opaqueness (and hence greater riskiness) of low-BM firms should result in them having greater co-movement with the market. On the other hand, this relationship will be attenuated by the fact that high-BM firms are not as well diversified. We therefore predict a weak positive relationship between LSSR and BM. However, it can be seen from Table 5 that the coefficient on BM is insignificant. Again, Morck et al‟s. (2000) informational interpretation does not hold.
17 It should be noted that, the MV coefficient in LSSR regression for the USA is not significant – a finding consistent with Roll (1988). We conjecture that the difference between the two countries is attributable to the greater size of the US economy.
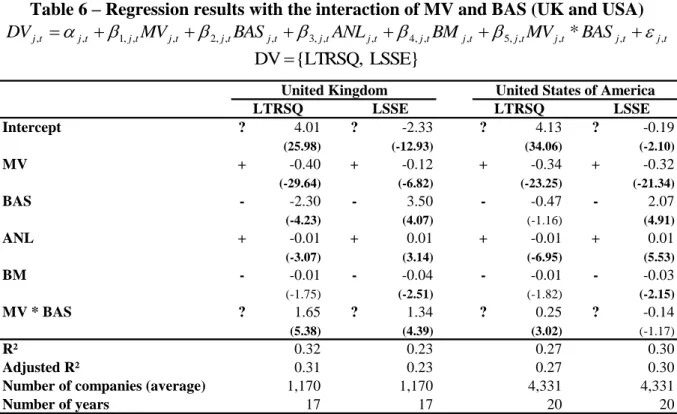
We also tested several interactions, using different variable combinations, but we found these interactions to provide little additional contribution. For presentation reasons we present here only the results from interacting the variables MV and BAS. Table 6 shows that the coefficient of BAS is sensitive to the inclusion of the interaction variable. When using LTRSQ as the dependent variable the coefficient for
BAS becomes negative for the UK and statistically insignificant for the US. The same
effect is not visible when using LSSE as the dependent variable. In all of the cases the coefficient of the interaction term is positive meaning that as size increases, larger
BAS are associated with better information. This is not compatible with an
informational interpretation.
5.3. R² and analysts forecast dispersion
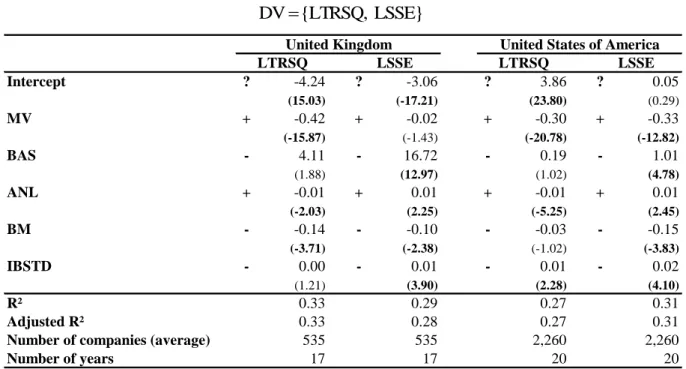
Our next set of tests is only exploratory because of lack of data availability: we include an additional variable in our regressions that should be undeniably associated with the firm-specific information environment. If the information environment is of a good quality it should facilitate predictions and forecasts: in such a scenario, analysts should arrive at similar forecasts of future earnings. We use the standard deviation of analyst forecasts (IBSTD) as an inverse measure of the quality of the information environment. We do not include this variable in our main set of tests due to lack of data18.
In Table 7, we focus our analysis on the two dependent variables which prior research claims to measure firm-specific information (LTRSQ and LSSE) and we can
18 According to IBES and WRDS these data are only available for a subset of companies and to some extent it is affected by survivorship bias. As survivorship might itself be correlated with the quality of the information environment, any relationship with IBSTD has to be treated with caution.
see that the inclusion of such an analyst variable leads to some changes in the results, namely some of the unlikely relationships cease to be statistically significant. The counter intuitive sign of MV (for the UK when using LSSE) and BAS (when using
LTRSQ as the dependent variable) are not significant anymore, however these
relationships are still highly significant in the remaining regressions. BM is now always negative and statistically significant, except for LTRSQ in the US. However, far more interesting is that in all of the cases except for LTRSQ in the UK, IBSTD is positively associated with the dependent variables. The caution in footnote 18 noted, the coefficients on IBSTD seem to give some support to the argument that R² captures uninformed trading rather than information. In other words, lower R²s reflect more unstable information environments, raising some doubts over the informational interpretation of R².
5.4. Sensitivity analyses
5.4.1. Extreme returns
As stated earlier, we do not delete extreme weekly observations, though this has been a normal procedure in all similar studies, usually with the justification that there are likely to be data errors (Morck et al. 2000, 224): “On the assumption that coding errors are overrepresented in extreme observations, we trim our data by dropping bi-weekly observations for which the stock's return exceeds 0.25 in absolute value”.
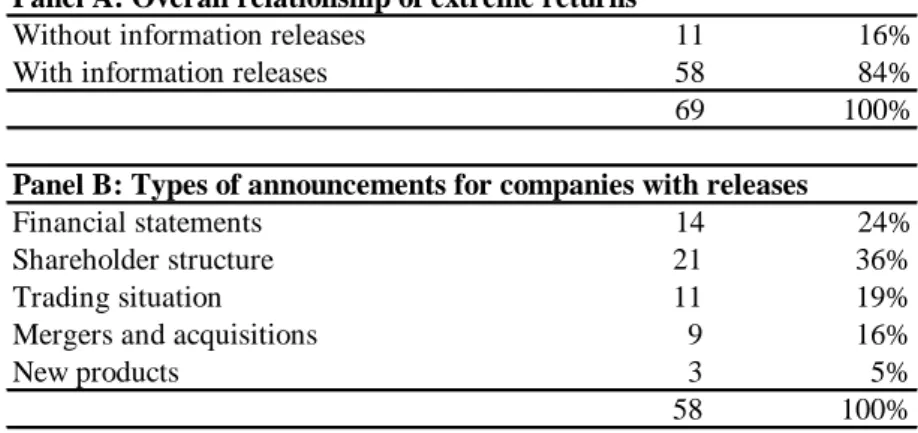
For the UK, we examined such “outliers” and, hand checked each with source data: we found that virtually none of them could be considered as an error. Our procedure was twofold. Firstly, we randomly selected a sample of UK extreme weekly
returns and checked for changes in price to confirm that true price variation existed. Secondly, for all observations with weekly returns above 200%19 we checked for information events registered in the database Perfect Information during the same week. As reported in Table 8, in 84%20 of these cases information was actually released. Our analysis dismisses the error justification and on the contrary it strongly signals that such outliers might be crucial to any information-related study. By ignoring such observations, previous research restricts the validity of its conclusions. These extreme returns can be both noise and the result of information events. If the extreme returns result from information events, then its inclusion in the analysis is relevant for the research question.
We include such extreme observations in our sample, which we consider a major contribution towards our study. Nevertheless, we also replicate the exclusion practiced in other studies and it results in a significant reduction in the variation in the components of R². Due to the number of observations, it would be a much larger task to perform such a check of extreme observations on the US market.
Figure 3, in contrast to Figure 2, presents the evolution of the components of R² for the UK after deleting weekly returns larger than ± 25%, the basis used in previous studies. We note a strong decline in the firm-specific component (SSE). The magnitude of pervasive factors (SSR) also declines, but not as severely as
19 Previous research considered bi-weekly returns larger than ±25% to be errors. In our analysis, by selecting weekly returns above 200% we are selecting the ones where the likelihood of error is most extreme.
20
For the remaining 16% we do not have any evidence concerning the release (or non-release) of information.
specific ones.21 We believe that this specification as used in previous studies is a mistaken one for the reasons discussed above.
Trimming the sample at ± 25% deletes observations with abnormal behaviour and forces the model to perform in a more “desirable” way. Volatility is trimmed and any eventual noise effect reduced, inadvertently sharpening the results inappropriately to appear to be more consistent with an informational perspective of the R² methodology.
We also run our multivariate analysis excluding extreme returns, consistent with Morck et al. (2000) and other papers, and our results are consistent with the ones reported without the exclusions in this paper. R² and its components still behave in the opposite way to an informational interpretation.
5.4.2. Non-trading weeks
Periods where no trading activity has occurred have a zero return, which will not only affect market and industry returns for the period, but also affect the degree of co-movement. To test for the impact of no trading, we eliminated observations that corresponded to periods larger than two weeks in duration with no trading activity. Such deletions do not significantly affect our interpretation of the results.
5.4.3. Industry effects
As we mentioned earlier, previous research using R² methodology is not unanimous on the inclusion of an industry factor. Roll (1988) began by using only a
21
In addition in another test we also trimmed our sample for weekly returns larger than 100%, and the results are similar but less pronounced.
market index and then extended the model to include an industry variable, but subsequent research does not address this issue conceptually. Therefore, we replicate our multivariate tests using the LTRSQ, LSSR and LSSE from a modified version of Equation (1) without an industry factor. Equation (8) uses only market returns as independent variable. jwt jwt jt jt jwt RM RC (8)
Figure 4 compares the R² with and without the industry variable. When using the model without the industry variable we constructed an alternative sample including all companies with invalid industry classification, which could not be included in the model used earlier. Multivariate results are very similar to those in Table 4 and Table 5, allowing us to draw analogous conclusions.
In the main tests, in order to take into account that small industries are more likely to be sensitive to extreme observations we constructed the industry index for each company excluding the company in question, as described in Equation (2). As a further sensitivity test, we also deleted from our final sample companies in industries with less than ten companies and the results remain unaffected.
Companies listed on the London Stock Exchange are industry classified according to the FTSE Global Classification. In our main tests, we adopt a classification by level four sectors/industries. As a sensitivity analysis, we also rerun our tests with different levels of classification. Results are not affected by this.
5.4.4. Using market value as a weighting factor
Equation (3) uses SST as a weighting factor to compute an aggregate R² per year. The use of SST allows us to decompose the aggregate R² into its components as in Equation (4). As a sensitivity test, we also run our tests using market value as a
weighting factor for R² rather than SST and results show a strong and positive association with market value. When using market value as the weighting factor instead of SST, the declining trend disappears and annual R²s are considerably higher. This effect shows a clear positive association between R² and market value, as we discussed in our multivariate analysis.
6. Conclusions
Roll (1988) establishes a research methodology that attempts to investigate the performance of asset pricing theory. The coherent results from this stream of research demonstrate how poorly asset pricing theories perform when trying to explain returns. A more recent stream of research uses the same methodology to measure the cross-country quality of information environments. In this paper, we question the conclusions of such research, applied at a firm rather than a cross-country level, particularly its interpretation of the R² measure as a proxy for quality of information.
We study the behaviour of the methodology at the firm-level, based on R² and its components, in two developed countries over the last twenty years and examine its relationship with other information-related variables which capture aspects of the information environment. We focus on the firm-level because in cross-country results, such an effect might not be evident because it can easily be obscured by institutional factors. Our results lead us to question the accepted rationales for the use of such R² methodology articulated in recent research and indicate that other factors rather than information may be driving R². We believe that the informational interpretation of the R² methodology proposed in the literature has flaws that need to
be carefully considered by researchers intending to use it as a parsimonious way of representing the quality of a firm‟s information environment.
Table 1 – Descriptive statistics for average of unadjusted variables for the whole period
Panel A: United Kingdom
N Mean Std dev Min 25% Median 75% Max
R² 1,388 0.14 0.14 0.00 0.04 0.09 0.19 0.79
LTRSQ 1,388 2.51 1.49 -1.40 1.52 2.39 3.36 9.54
Analysts per firm 814 8 8 1 2 5 10 46
Companies followed by analysts 814 814 187 460 664 834 953 1,106 Bid-ask spread (BAS) 1,224 0.07 0.12 0.00 0.02 0.04 0.07 1.41 Book-to-market (BM) 1,159 0.89 1.49 0.00 0.33 0.61 1.07 32.60 Market value (MV million £) 1,388 530 2,725 0 9 33 146 50,155 Market returns (sample-year) 20 0.13 0.16 -0.25 0.08 0.18 0.22 0.34 FTSE all returns (year) 20 0.13 0.16 -0.23 0.05 0.18 0.24 0.36
Panel B: United States of America
N Mean Std dev Min 25% Median 75% Max
R² 6,621 0.13 0.13 0.00 0.04 0.09 0.19 0.87
LTRSQ 6,621 2.55 1.48 -2.23 1.55 2.41 3.39 12.10
Analysts per firm 3,287 9 10 1 2 6 12 67
Companies followed by analysts 3,287 3,287 668 2,362 2,791 3,100 3,802 4,494 Bid-ask spread (BAS) 6,621 0.07 0.11 0.00 0.02 0.04 0.08 1.08 Book-to-market (BM) 4,521 0.83 1.80 0.00 0.23 0.51 0.93 70.62 Market value (MV million £) 6,293 1,185 6,628 0 27 99 416 204,023 Market returns (sample-year) 20 0.13 0.17 -0.20 -0.02 0.12 0.27 0.39 AMEX, NASDAQ and NYSE returns 20 0.14 0.17 -0.21 0.01 0.17 0.29 0.36
R² is computed using Equation (1) and then transformed to LTRSQ with Equation (4). Bid-ask spreads are computed using Equation (5).
Market returns are market value weighted. For each company we computed annual returns using weekly observations and annual average market value.
Book-to-market ratio is computed by dividing book value of equity by market value. The information about analysts refers only to companies with at least one analyst following.