Information Asymmetry and Share Prices: Analysis of the Use of Social
Networks in the Brazilian and U.S. Capital Markets*,**
Marcelo Paulo de Arruda
Universidade Federal da Paraíba, Centro de Ciências Sociais e Aplicadas, Departamento de Finanças e Contabilidade, João Pessoa, PB, Brazil
Luiz Felipe de Araújo Pontes Girão
Universidade Federal da Paraíba, Centro de Ciências Sociais e Aplicadas, Departamento de Finanças e Contabilidade, João Pessoa, PB, Brazil
Wenner Glaucio Lopes Lucena
Universidade Federal da Paraíba, Centro de Ciências Sociais e Aplicadas, Departamento de Finanças e Contabilidade, João Pessoa, PB, Brazil
Received on 01.13.2015 – Desk Acceptance on 03.04.2015 – 3rd version approved on 09.14.2015.
ABSTRACT
Increasing globalization has meant the internet becoming ever more part of the routine of people around the world. With the evolution of the internet, social networks have emerged in order to facilitate communication between people, communities and even between corpora-tions. Social networks offer companies a way of instantly releasing information, allowing those who use this information greater flexibility when searching for news about the companies in which they have invested or wish to invest. In this context, the objective of this study was to analyze how social networks (Facebook, Twitter and Youtube) affect levels of information asymmetry and the pricing of shares for Brazilian and U.S. public companies during 2012. To achieve the proposed goal, the conceptual framework of the Ohlson model (1995) was used to verify whether the information posted on social networks affects the pricing of shares, and share price volatility was used as a proxy for information asymmetry. The sample included 170 Brazilian companies listed on the BM&FBOVESPA and 100 companies listed on the U.S. stock market in 2012. The results show that social networks can affect levels of information asymmetry in these markets, but only "unofficial" Facebook affects the pricing of shares for companies in the Brazilian stock market, although sensitivity analysis indicated that the groups that use and those that do not use Facebook do not exhibit different average returns. Thus, investors should not use this information to devise strategies to generate better returns.
Palavras-chave: social networks, information asymmetry, pricing of shares.
* Paper presented at the 17th SemeAd, São Paulo, Brazil, October, 2014.
1 INTRODUCTION
The reasons for this may be varied, such as: (i) the gathering of data is very costly and done manually and individually, which discourages the writing of empirical articles on the subject (data can be downloaded on: http://www.mediafi-re.com/download/13fvba0rrbbzefy/Social_Networks_data. rar, retrieved from January, 20, 2014); and (ii) the use of social networks is still very recent in Brazilian companies.
Yet, the importance of the subject of this study can-not be ignored, especially following excessive use by some Brazilian companies that announced, via Twitter, that they were discovering new growth opportunities and that they would still produce a lot; however, these companies ultima-tely ended up in receivership.
On this basis, information released by companies can lead to alterations in their share prices, by it being unders-tood as reporting of relevant facts. If investors take this news into consideration when making decisions – and, gi-ven the increasing advance in the use of social networks – companies can take advantage of these tools in order to publish information that is of interest to their investors. As well as the impact on the pricing of shares, such informa-tion released via social networks, if used correctly, can also serve to reduce information asymmetry between compa-nies and investors.
Regarding the concerns described in the two procee-ding paragraphs, it is also worth mentioning that even the
Comissão de Valores Mobiliários (CVM), the Brazilian Se-curities and Exchange Commission, has begun to discuss and regulate the release of information via the internet. The first step was the announcement of CVM Instruction no. 547/2014, which even involved the participation of acade-mics presenting data from studies in order to support some of the comments related to the ruling.
In light of the comments in this introduction, the gene-ral aim of this study was to verify the relationship between the release of information on social networks with the de-gree of information asymmetry and the pricing of shares for companies listed on the BM&FBOVESPA. The sample totaled 170 analyzed Brazilian companies and the 100 big-gest companies in terms of market value listed on the NYSE (New York Stock Exchange) and the NASDAQ (National Association of Securities Dealers Automated Quotations) in 2012. The United States was chosen as a benchmark sin-ce it is the country with the biggest capitalization of com-panies in the capital market (according to a list of countries and their respective capitalizations taken on February 25th 2014 from http://www.quandl.com/economics/stock-ma-rket-capitalization-all-countries) and it has a good infor-mational environment (Lopes & Alencar, 2010).
It is hoped that this study contributes to a better unders-tanding of the use of social networks in divulging informa-tion – thus assisting investors, as well as widening academic contributions with regards to capital market practitioners and regulatory bodies – showing evidence that such repor-ting mechanisms are important in reducing information Traditionally, stock market participants evaluate
com-panies through information released via the usual chan-nels, such as newspapers, journals, reports, and analysts’ forecasts (Hu, Liu, Tripathy, & Yao, 2011, p. 1362). With advancements in technology and the increasing use of the internet by many different users around the world, it has become possible for companies to employ these tools to release information and relevant facts, and users of this in-formation have come to base their decisions on this – from product launch announcements, institutional campaigns and advertising, to the communication of economic-finan-cial related facts, by means of finaneconomic-finan-cial statements and ma-nagement reports, among others.
According to Bonsón and Flores (2011), in corporate communication, the main application for Web 2.0 techno-logies (in which the idea is to make the online environment more dynamic, so that users collaborate in order to orga-nize content) and social media is corporate dialogue. This dialogue means that companies can take advantage of the evolution of the web, making it possible to provide more detailed and useful information to users, thus allowing them to participate effectively via the use of these new pla-tforms.
Adopting a corporate dialogue would mean setting aside the current one-way communication model, that is, from corporation to user, thus facilitating multi-way flows between stakeholders, in whichever public or private entity (shareholders-owners, managers, employees, clients-users, suppliers, authorities, competitors, local communities, en-vironment, etc.) (Bonsón & Flores, 2011); thus having the potential to reduce information asymmetry.
Information asymmetry was initially analyzed by Aker-lof (1970), whose research showed that the informational difference between players means that, at the limit, the market does not function, since good buyers and sellers will exit, leaving only the bad ones, which would not ne-gotiate with each other, leading to the market’s extinction. Akerlof ’s “market” is supported by Leland and Pyle (1977), who state that markets are characterized by different levels of information between buyers and sellers. That is, some particular users exhibit higher levels (qualitative or quan-titative) of information with respect to some entities than other users. Thus, an increase in the release of relevant in-formation should benefit average users without access to private information.
asymmetry, provided companies use them correctly. Fur-thermore, this article widens the international debate on the subject via three specific points, namely: (i) an analysis of the effect of reporting via social networks on informa-tion asymmetry and company value; (ii) a comparison of a strong informational environment with one that is less strong; and (iii) by encompassing a greater number of so-cial networks, which were not explored in “seminal” studies from this area presented in the literature review.
In order to provide some of the evidence from a line of research that is similar to that of this article, studies re-garding voluntary disclosure have shown that this type of reporting is able to reduce the cost of equity (ke), given that ke is linked to informational risk, which is linked to infor-mation asymmetry. Yet, the main findings with relation to voluntary disclosure and the cost of equity indicate that the informational environment is a relevant factor in explai-ning the relationship between voluntary disclosure (which should reduce information asymmetry) and ke (e.g. Boto-san, 1997; Cao, Myers, Tsang, & Yang, 2014).
Botosan (1997) found that voluntary disclosure only re-duces the ke of companies with low analyst coverage; Fu,
Kraft and Zhang (2012), among other studies, provided evidence that more timely disclosure (as is the case with social networks, for example) is able to reduce ke. Cao et al. (2014) showed that forecasts, made by company mana-gement, are also able to reduce ke, provided investors are protected. Blanco, Garcia-Lara and Tribo (2015) found that, even in competitive environments, in which releasing extra information could benefit competitors, its release can reduce ke.
It is also worth noting that the more fragile Brazilian informational environment could mean additional repor-ting having an even stronger effect for Brazilian companies, as Lopes and Alencar (2010) reported; this study presents some evidence in this direction.
With relation to the results found, it is possible to ve-rify that some social networks affect levels of information asymmetry and the pricing of shares for companies from the Brazilian and U.S. stock markets, with an emphasis on the latter due to the fact that, on average, social networks are more widely used in this country, a fact that renews the debate regarding the informational differences between the two markets.
2 THEORETICAL FRAMEWORK
2.1 Social Networks and Information Asymmetry
The emergence of social media has altered the way people and companies around the world communicate in such a manner that Hutter, Hautz, Dennhardt and Füller (2013) affirm that the revolution caused by so-cial media has altered the communication landscape and had a significant impact on marketing communication. The rising importance of websites like Facebook, You-tube, and others, in the lives of consumers has an ever greater influence over their communication habits. Due to consumers spending more and more time on social networks, an increasing amount of communication has come to take place within these new environments.This impact on the way of communicating is also ap-proached by Blankespoor, Miller and White (2014), who state that various technologies have emerged to provide companies with additional communication channels, allowing them to ignore information intermediaries and to directly reach investors on a frequent basis and in real time.
The study of social networks on the internet focuses on the problem of how social structures emerge, what type they are, how they are composed by way of commu-nication mediated by computers, and how these media-ted interactions are able to generate information flows and social exchanges that have an impact on these struc-tures (Recuero, 2009, p. 24).
Hanna, Rohm and Crittenden (2011) state that con-tent in the form of social networks and blogs is widening the spheres of influence of marketing, given that it allo-ws individuals to create, share and recommend
informa-tion, which has promoted a wide variety of social media platforms that provide tools for exchanging significant information between companies and clients.
According to Hu et al. (2011), due to the rising popu-larity and reliability of blogs, they have become a valid information channel for market participants to use such information when making decisions regarding their in-vestments.
In light of the above, the importance of social ne-tworks for communication between corporations and their clients/investors is verified, and the aim is to analyze the best way of using them, primarily since they involve a tool that belongs to a field that has still barely been explored by entities, considering its range of uses.
Looking at information asymmetry, Blankespoor et al. (2014) emphasize in their work that, at least in the short term, the release of a particular item of news can really increase information asymmetry (if it is used for this objective); however, Kim and Verrecchia (1994) and Lee, Mucklow, and Ready (1993) found empirical evi-dence that increases in information asymmetry last less than an hour.
It is possible that this problem exists primarily in Brazil, due to there not being effective regulation for the release of content on social networks. This occurs due to the fact that it is a recent issue, with emerging problems that are also recent – like the case cited in the introduc-tion secintroduc-tion of this article – and also due to the existen-ce of conflicting objectives between principal and agent (Jensen & Meckling, 1976).
asymmetry, showing that investors have diluted infor-mation (Blankespoor et al., 2014).
Into this context of information asymmetry and ma-rket for lemons (Akerlof, 1970) enters Accounting, with the main role, within the business dynamic, of providing relevant information able to reduce information asym-metry, thus minimizing conflicts of agency and, con-sequently, contributing to the appropriate allocation of available resources, therefore forming part of the system of governance (Paulo, 2007).
Some studies show, though indirectly, that the re-porting of company results to the public reduces infor-mation asymmetry (Ball & Brown, 1968; Beaver, 1968), since it will make the same information that was availa-ble to agents within entities also availaavaila-ble to the external public. Concerning social networks, companies can use these means for releasing accounting and economic in-formation.
Thus, there is the following study hypothesis:
Hypothesis1 (H1): information asymmetry between companies and investors is reduced through the use of social networks.
As mentioned above, the possible use of these social networks by companies in order to release information that can assist users in decision making is verified. The release of company financial reports – containing the most varied financial statements – is a requirement ba-cked by law, however Drake, Roulstone and Thornock (2012) affirm that available public information does not mean in itself that this is instantly received by all market participants, and that investors should make efforts to obtain information through various channels, such as the press, analysts and the internet, and that the market should demand this information.
With regards to this, the Efficient Market Hypothesis (EMH), studied primarily by Fama (1970), claims that asset values completely reflect available information. As social networks are used to release information, there is the following study hypothesis:
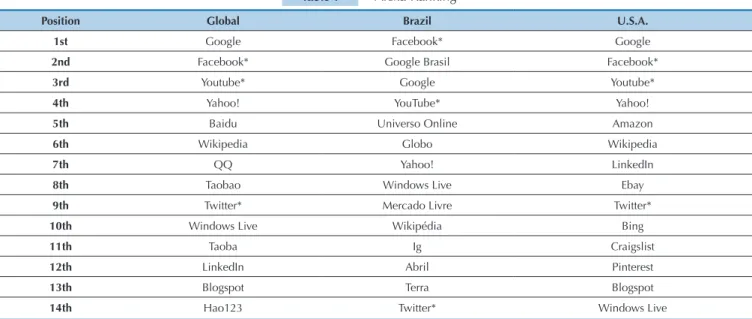
Table 1 Alexa Ranking
Position Global Brazil U.S.A.
1st Google Facebook* Google
2nd Facebook* Google Brasil Facebook*
3rd Youtube* Google Youtube*
4th Yahoo! YouTube* Yahoo!
5th Baidu Universo Online Amazon
6th Wikipedia Globo Wikipedia
7th QQ Yahoo! LinkedIn
8th Taobao Windows Live Ebay
9th Twitter* Mercado Livre Twitter*
10th Windows Live Wikipédia Bing
11th Taoba Ig Craigslist
12th LinkedIn Abril Pinterest
13th Blogspot Terra Blogspot
14th Hao123 Twitter* Windows Live
Hypothesis2 (H2): information posted on social ne-tworks affects the market value of companies.
Comprising the social networks used by the com-panies that were the object of this study are Facebook, Twitter, and Youtube. According to Recuero (2009), Fa-cebook was launched in 2004, at first only being avai-lable to Harvard students; it was seen as one of the so-cial networks with more privacy than others, since only users that formed part of the same network could view each other’s profiles. The official Facebook profile states that the mission of this social network is to provide pe-ople with the power to share and make the world more open and connected.
The Twitter website declares that this tool is the best way to connect with people, to express yourself and to find out what is happening. On the same website, the Twitter for Business option has the following descrip-tion: companies use Twitter to share information about their services, bring relevant information together in real time and build relationships with clients, partners and opinion formers.
As announced on the the Youtube website, the chan-nel offers a forum for users around the world to interre-late, and acts as a distribution platform for creators and advertisers of original content, large and small. As men-tioned by Shifman (2011), Youtube, launched in 2005, has become the biggest free video sharing website of content created or generated by users.
Youtube is known worldwide, and considered the biggest video sharing website, in which its users post videos with the intention, in most cases, of causing an impact on other users. Therefore, Youtube ultimately serves a large volume of visitors and a range of different audiences, offering a means for its participants to obtain extensive exposure.
Via Alexa – a site that measures webpage use around the world – it is verified that the social networks in this study are among the most accessed websites in the world and in Brazil, as shown in Table 1.
2.2 Empirical Evidence
Some studies (Hu et al., 2011; Rubin & Rubin, 2010; Drake et al., 2012; Blankespoor et al., 2014) sought to relate the use of social networks with information asymmetry and the pricing of shares.
In a study carried out by Hu et al. (2011), the au-thors verified that the visibility of blogs has a positive impact on share evaluations, and they suggest that the SEC (Security and Exchange Commission) should in-vestigate the impact of blogs on the capital market and regulate the release of such information, since it has important implications for company valuations.
Rubin and Rubin (2010) employed the frequency of editing in Wikipedia as an instrument that captures the extent of the population’s involvement in the proces-sing of information related to companies. The results obtained indicated that, for investors and analysts to be informed about companies, processing of information via the internet should be related to the extent of the population’s involvement.
Drake et al. (2012) investigated factors that influen-ce investors’ demand for information with regards to reporting results; such investors use the Google search engine as a way to express their demand for public in-formation. The authors concluded that searches on the website increase around two weeks before release and remain elevated for a given period after the announce-ment.
In a study carried out by Blankespoor et al. (2014), the authors sought to verify whether companies can use new information technologies to reduce informa-tion asymmetry, using Twitter in this case. The authors do not suggest that the social network has an impact on the visibility of firms; however the dissemination of this network can assist in alleviating information asymmetry for companies that are not so visible, since they receive less press coverage.
Given the empirical evidence mentioned above, this study aims to widen knowledge in this area for 3 main reasons that have not been explored in previous stu-dies or that have, but in a different way: (i) to jointly analyze the effect of reporting via social networks on information asymmetry and on company value; (ii) to compare the informational environment in the Uni-ted States with that of Brazil, expecting the first to be stronger (Lopes & Alencar, 2010), and implying a lower level of information asymmetry; and (iii) to encompass a greater number of social networks, even separating them into “official” and “unofficial” social networks, as detailed in this study’s methodology. The contribution of this study lies here, since, as Saito and Silveira (2008) affirmed, evidence of the existence of agency problems has already been provided in various studies, and it is now necessary to find out its economic relevance and the means for alleviating these problems; the appro-priate use of social networks has the potential for this.
3 METHODOLOGICAL PROCEDURES
3.1 Sample Composition and Data Collection
The population of this study is formed of publicly traded Brazilian and U.S. companies. The information necessary for this study to be carried out was gathered (manually and individually) from companies’ social ne-tworks (Facebook, Twitter, and Youtube), categorized as “official” and “unofficial”, and from the Economatica® database, covering 2012. “Official” social networks were considered to be those with access links directly provi-ded on companies’ websites; “unofficial” ones were con-sidered to be those with links not provided on compa-nies’ websites and which were searched for, individually, by company name on the social networks themselves.The information gathered on social networks for this study are presented below and follow a methodology that is similar to that of Hu et al. (2011) and of Rubin and Rubin (2010), which focuses on the visibility that social networks lend to information, though these stu-dies used blogs and Wikipedia, respectively.
◆ Facebook: number of “likes” on the companies’
pages;
◆ Twittter: number of tweets and company followers;
and
◆ Youtube: number of views and users subscribed to company channels in this social network.
The study only uses 2012, given that there is no pos-sibility for categorizing a priori (directly accessing the websites) year to year the information gathered for the study, thus characterizing it as a cross section analy-sis. Hence, with relation to accounting numbers, only the last available year, following the 2008 crisis and the adoption of IFRS, was used. The final sample for this study was composed of 170 Brazilian companies and 100 U.S. companies with the highest market value in 2012.
3.2 Definition of Models and Variables Employed
This study sought to relate the companies’ book value with their market values, using variables that serve as proxies for information asymmetry and for the use and visibility of social networks. Equation 1 was developed in order to test Hypothesis 1 of this study.In which:
IASi= share price volatility was used as a proxy for the information asymmetry of company i in 2012 ;
Ai = total assets of company i at the end of 2012 divi-ded by the total assets of company i at the end of 2011;
CGi = level of corporate governance of company i at the end of 2012;
SNi = social network visibility of company i at the end of 2012;
εi = regression error – εi~N(0,σ2).
According to Martins (2012), company size can be represented by different variables, among them, the book value of their total assets, the sum of their net re-venues in a particular period, and the market value of their shares. For this study, the value of companies’ total assets was used to represent their size, so that the proxy is not linked to the market, given that IAS is already tied to market fluctuations.
As a proxy for information asymmetry, share price volatility was used (Yoon; Zo; Ciganek, 2011), and tre-ated as a measure for idiosyncratic risk. These authors claim that, if the market is efficient and information asymmetry is low, security volatility tends to be low, and if not, volatility will be high, as adverse selection proble-ms between traders tends to worsen.
Corporate governance was used as a control variable for Brazil, since, according to Moreiras (2010), the diffe-rent governance practices adopted aim to improve the quality of information provided by companies, bringing
about a reduction in information asymmetry. As a proxy for corporate governance, the different levels of corpo-rate governance that exist within the BM&FBOVESPA (N1, N2, and Novo Mercado) were used. The CG variable was not used in the United States sample, since the proxy used for this variable specifically applies to the Brazilian stock market, and also because the informational envi-ronment in the United States is superior to the Brazi-lian one, as shown, for example, by Lopes and Alencar (2010).
In order to verify the influence of information posted on social networks over company share valuations, an adaptation of the Ohlson model (1995) was used, sin-ce the parameters for the persistensin-ce of residual income and for other information were ignored; that is, only the idea that net equity and residual income are value rele-vant was used.
Market value was used instead of cost of equity (ke), unlike in other studies regarding disclosure and infor-mation asymmetry, (e.g. Botosan, 1997), because ke is not directly observable, however is related to the market value of companies. As it is possible for another proxy (which would be ke) not to be used, the use of a variable that is directly observed and that is able to reflect the effects of releasing information was chosen, as ke should be, considering the hypothesis that the market is effi-cient in a semi-strong form.
Thus, in order to test Hypothesis 2 from this study, there are Equations 2 and 3.
P
a=P – r
f
* NE
2
P
i= β
0+ β
1NE
i+ β
2P
ia+ β
3
SN
i+ ε
i3
In which:
Pa = residual income (or abnormal proit) in 2012;
P = net proit for the period;
rf= risk free interest rate;
PL = net equity in 2011.
To estimate residual income (Pa), the Selic Interest Rate
(SELIC) was adopted as a risk free rate for the Brazilian companies. For the U.S. companies, the average Federal
Funds (efective) rate for 2011 was adopted. Rates from the previous year were used because they cover net equity also from the previous period, which theoretically relects com-pany net assets that will generate cash low in the following year.
Ater that, there is the model for measuring company value(Pi) proposed by Ohlson (1995), based on accounting numbers, as in Equation 3.
In which:
Pi = market value of company i;
NEi = net equity of company i in 2012;
Pia = abnormal profit of company i in 2012;
SNi = effect of the use of social networks for company i in 2012;
εi = regression error – εi~N(0,σ2).
3.4 Sensibility Analysis
As a sensibility analysis of the results – expecting that the use of social networks affects information asymme-try, as well as share value – it was verified whether there is the possibility of devising investment strategies based
on social networks.
Thus, the groups that use, and those that do not use social networks, were separated, in order to compare the future return on shares using these networks. This result was obtained via the t test for difference of means.
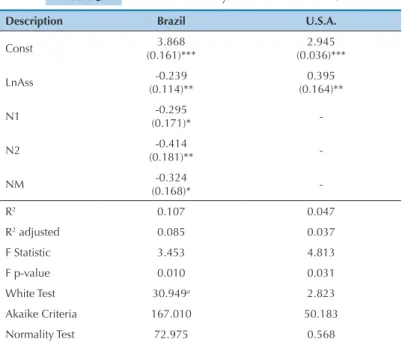
Table 3 Results of analysis of control variables
Description Brazil U.S.A.
Const 3.868
(0.161)***
2.945 (0.036)***
LnAss -0.239
(0.114)**
0.395 (0.164)**
N1 -0.295
(0.171)*
-N2 -0.414
(0.181)**
-NM -0.324
(0.168)*
-R2 0.107 0.047
R2 adjusted 0.085 0.037
F Statistic 3.453 4.813
F p-value 0.010 0.031
White Test 30.949a 2.823
Akaike Criteria 167.010 50.183
Normality Test 72.975 0.568
Table 2 Expected signs for the analyzed variables
Analyzed Variables Effect on Information Asymmetry Effect on Market Value of Shares
Assets
-Net Equity +
Corporate Governance - +
Information Posted on Social Networks - ?
Residual income +
Source: Developed by the authors.
4 EMPIRICAL RESULTS
4.1 Descriptive Statistics
Based on the descriptive statistics in this study, it is possible to infer that the most widely used social ne-twork in Brazil is Facebook, since it exhibits a higher ave-rage than the other social networks analyzed, whereas in the United States the most widely used is Youtube. It turns out that, for both markets and for the samples analyzed, there are many companies that still do not use these tools.
Another important point to be observed is the diference found between the two markets. he United States exhibits a higher average for all the oicial social networks of the companies analyzed, thus making it pos-sible to infer that these tools are more widely used in the U.S. market than in the Brazilian one (data not tabulated).
Note: *10% signiicant; ** 5% signiicant; ***1% signiicant. Standard errors in
brackets.
a Regressions estimated with standard errors robust in heterocedasticity. The
nor-mality assumption was relaxed by the Central Limit Theorem (Brooks, 2008). The greatest VIF obtained in the regressions contained in this table was 1.975. Source: Developed by the authors.
4.2 Results for the Influence of Social Networks
on Information Asymmetry
Table 4 presents the results relating to an analysis of the Facebook social network, in which it is possible to verify that the Brazilian companies’ oicial Facebook (Model 1) does not exhibit statistical signiicance, that is, it does not afect information asymmetry. However, on analyzing the results regarding unoicial Facebook (LnUOFB) for this same market, statistical signiicance is veriied – negatively afecting information asymmetry, that is, reducing it - whi-ch is the same result exhibited by the U.S. companies’ oi-cial Facebook (Model 3).
Following on from the estimations from the models looked at here, with the explanatory variables, it is possible to verify that the adjusted determination coeicients (R2 adjusted) from the models for the Brazilian companies pre-sented results between 0.080 and 0.099, while those for the U.S. companies were between 0.046 and 0.063, so that the
regressions carried out with the variables for the Brazilian companies exhibited a higher degree of adjustment than the regressions for the companies from the U.S market.
his result was expected, as the informational environ-ment in the United States is better than the Brazilian one (Lopes & Alencar, 2010), for example, due to a culture of disclosing information to speciic institutions (e.g. banks and governments), whether it be for funding or taxes, and an underdeveloped capital market with a lower quality of corporate governance (lower view to attracting sharehol-ders). Such characteristics mean that additional informa-tion released by social networks makes more of a diference in Brazil and does not make much of a diference in the United States, since the companies listed there already tend to disclose the necessary information for the various users to make decisions.
Table 4 Results of analysis of “Facebook” variable regarding information asymmetry
Description Brazil U.S.A.
Model 1 Model 2 Model 3 Model 4
Const 3.873
(0.160)***
3.925 (0.174)***
3.027 (0.051)***
2.930 (0.037)***
LnAss -0.241
(0.114)**
-0.251 (0.115)**
0.292 (0.159)*
0.339 (0.164)**
N1 -0.291
(0.173)*
-0.304 (0.170)*
-
-N2 -0.405
(0.185)**
-0.434 (0.180)**
-
-NM -0.320
(0.170)*
-0.338 (0.166)**
-
-LnOFB -0.002
(0.005)
--0.010 (0.005)*
-LnUOFB - -0.014
(0.008)*
- 0.011
(0.008)
R2 0.108 0.125 0.082 0.066
R2 adjusted 0.080 0.099 0.063 0.046
F Statistic 2.858 2.748 6.416 3.409
F p-value 0.017 0.021 0.002 0.037
White Test 32.715a 44.665a 15.497a 7.613
Akaike Criteria 168.874 165.435 48.452 50.185
Normality Test 72.881 69.547 0.749 0.787
Note: *10% signiicant; **5% signiicant; ***1% signiicant. Standard errors in brackets.
a Regressions estimated with standard errors robust in heterocedasticity. The normality assumption was relaxed by the Central Limit Theorem (Brooks, 2008).
The greatest VIF obtained in the regressions contained in this table was 2.006. Source: Developed by the authors.
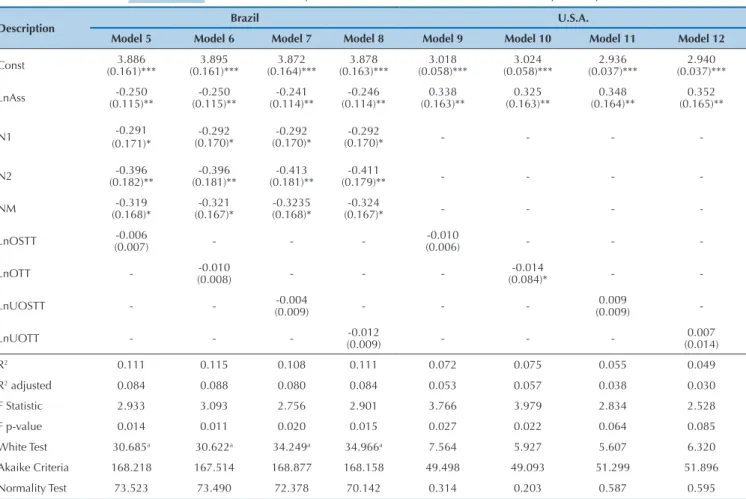
An analysis of Twitter can be found in Table 5, in whi-ch it is veriied – with relation to the Brazilian compa-nies – that Models 5, 6, 7, and 8 presented negative signs, which would indicate that this social network negatively afects information asymmetry, by reducing it. However, no statistical signiicance is exhibited, thus making it pos-sible to conclude that the variables used in these models do not contribute to reducing information asymmetry, since they are statistically equal to zero. In the United
Looking at the Youtube analysis, the results indicated in Table 6 show that the use of this social network does not afect information asymmetry with relation to the Brazilian stock market, however in the U.S. stock market, the inluence of the number of video views on the compa-nies’ oicial Youtube pages is veriied, negatively afecting
information asymmetry, thus making it inferable that, like the inluence of Twitter, the average number of U.S. company Youtube video views (8.351) is greater than the average for Brazilian companies (5.125), thus making it possible to explain the inluence of this variable on infor-mation asymmetry.
Description Brazil U.S.A.
Model 5 Model 6 Model 7 Model 8 Model 9 Model 10 Model 11 Model 12
Const (0.161)***3.886 (0.161)***3.895 (0.164)***3.872 (0.163)***3.878 (0.058)***3.018 (0.058)***3.024 (0.037)***2.936 (0.037)***2.940
LnAss (0.115)**-0.250 (0.115)**-0.250 (0.114)**-0.241 (0.114)**-0.246 (0.163)**0.338 (0.163)**0.325 (0.164)**0.348 (0.165)**0.352
N1 -0.291
(0.171)*
-0.292 (0.170)*
-0.292 (0.170)*
-0.292
(0.170)* - - -
-N2 (0.182)**-0.396 (0.181)**-0.396 (0.181)**-0.413 (0.179)**-0.411 - - -
-NM (0.168)*-0.319 (0.167)*-0.321 (0.168)*-0.3235 (0.167)*-0.324 - - -
-LnOSTT (0.007)-0.006 - - - (0.006)-0.010 - -
-LnOTT - (0.008)-0.010 - - - (0.084)*-0.014 -
-LnUOSTT - - (0.009)-0.004 - - - (0.009)0.009
-LnUOTT - - - (0.009)-0.012 - - - (0.014)0.007
R2 0.111 0.115 0.108 0.111 0.072 0.075 0.055 0.049
R2 adjusted 0.084 0.088 0.080 0.084 0.053 0.057 0.038 0.030
F Statistic 2.933 3.093 2.756 2.901 3.766 3.979 2.834 2.528
F p-value 0.014 0.011 0.020 0.015 0.027 0.022 0.064 0.085
White Test 30.685a 30.622a 34.249a 34.966a 7.564 5.927 5.607 6.320
Akaike Criteria 168.218 167.514 168.877 168.158 49.498 49.093 51.299 51.896
Normality Test 73.523 73.490 72.378 70.142 0.314 0.203 0.587 0.595
Note: *10% signiicant; **5% signiicant; ***1% signiicant. Standard errors in brackets.
a Regressions estimated with standard errors robust in heterocedasticity. The normality assumption was relaxed by the Central Limit Theorem (Brooks, 2008).
The greatest VIF obtained in the regressions contained in this table was 1.981. Source: Developed by the authors.
Table 6 Results of analysis of “Youtube” variable regarding information asymmetry
Description Brazil U.S.A.
Model 13 Model 14 Model 15 Model 16 Model 17 Model 18 Model 19 Model 20
Const 3.862
(0.161)***
3.861 (0.160)***
3.878 (0.165)***
3.881 (0.165)***
2.998 (0.047)***
3.035 (0.049)***
2.940 (0.037)***
2.941 (0.037)***
LnAss -0.242
(0.112)**
-0.241 (0.113)**
-0.242 (0.114)**
-0.243 (0.114)**
0.321 (0.158)**
0.291 (0.159)*
0.353 (0.165)**
0.355 (0.165)**
N1 (0.173)*-0.299 (0.174)*-0.299 (0.170)*-0.293 (0.170)*-0.293 - - - -
N2 (0.183)**-0.422 (0.184)**-0.422 (0.179)**-0.411 (0.179)**-0.415 - - -
-NM (0.169)*-0.328 (0.170)*-0.328 (0.169)*-0.327 (0.169)*-0.327 - - -
-LnOYT 0.004
(0.009) - -
--0.010
(0.146) - -
-LnOVYT - 0.002
(0.005) - -
--0.010
(0.004)** -
-LnUOYT - - -0.012
(0.015) - -
-0.008
(0.012)
-LnUOVYT - - - -0.006
(0.015) - -
4.2 Results for the Influence of Social Networks
on the Pricing of Shares
This part of the study deals with the results found re-garding the influence of the use of social networks on the value of the analyzed companies’ shares. Table 7 presents the results from an analysis of the control variables. As
Note: * 10% Signiicant; ** 5% Signiicant; ***1% Signiicant. Standard errors in brackets.
a Regressions estimated with standard errors robust in heterocedasticity. The normality assumption was relaxed by the Central Limit Theorem (Brooks, 2008).
The greatest VIF obtained in the regressions contained in this table was 1.997. Source: Developed by the authors
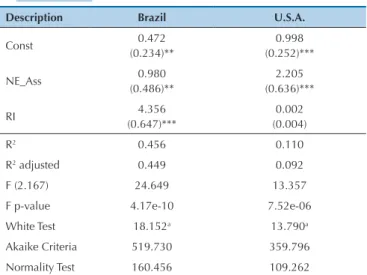
Table 7 Results from analysis of control variables
Description Brazil U.S.A.
Const 0.472
(0.234)**
0.998 (0.252)***
NE_Ass 0.980
(0.486)**
2.205 (0.636)***
RI 4.356
(0.647)***
0.002 (0.004)
R2 0.456 0.110
R2 adjusted 0.449 0.092
F (2.167) 24.649 13.357
F p-value 4.17e-10 7.52e-06
White Test 18.152a 13.790a
Akaike Criteria 519.730 359.796
Normality Test 160.456 109.262
Note: * 10% Signiicant; ** 5% Signiicant; ***1% Signiicant. Standard
errors in brackets.
a Regressions estimated with standard errors robust in heterocedasticity. The
normality assumption was relaxed by the Central Limit Theorem (Brooks, 2008). The greatest VIF obtained in the regressions contained in this table was 1.048.
Source: Developed by the authors.
is verified, residual income positively affects the value of the Brazilian companies’ shares to a 1% degree of signii-cance. Also in Table 7, it is observed that adjusted R2 shows that the applied statistics explain 44.9% of the formulated model. However, as seen in the same table, residual income does not statistically afect the U.S. companies’ share prices.
Below, Tables 8, 9, and 10 are presented, with the results for the inluence of social networks on the pricing of shares.
Table 8 Results of analysis of “Facebook” variable regarding information asymmetry
Description Brazil U.S.A.
Model 21 Model 22 Model 23 Model 24
Const 0.468
(0.263)*
0.322 (0.240)
0.953 (0.412)**
0.991 (0.259)***
NE Ass 0.981
(0.496)**
1.040 (0.486)**
2.237 (0.700)***
2.308 (0.726)***
RI 4.353
(0.678)***
4.363 (0.647)***
0.002 (0.005)
0.002 (0.005)
LnOFB 0.001
(0.019)
-0.004
(0.030)
-LnUOFB - (0.023)*0.039 - (0.028)-0.021
R2 0.108 0.108 0.109 0.109 0.065 0.097 0.051 0.049
R2 adjusted 0.081 0.081 0.082 0.082 0.046 0.078 0.031 0.030
F (5.164) 2.909 2.825 2.780 2.780 4.428 6.641 2.598 2.518
F p-value 0.015 0.018 0.019 0.019 0.014 0.002 0.080 0.086
White Test 32.950a 33.391a 36.309a 36.309a 15.158a 14.056a 4.637 4.757
Akaike Criteria 168.811 168.789 168.571 168.571 50.198 46.764 51.759 51.916
Normality Test 70.952 71.226 70.604 69.262 0.562 2.198 0.533 0.566
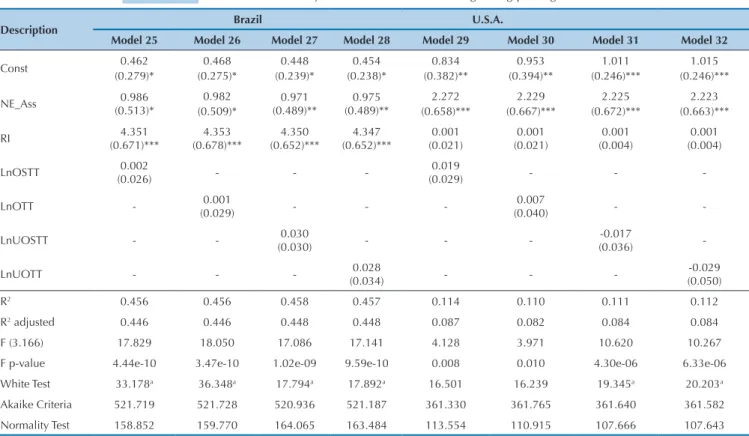
Table 9 Results from analysis of “Twitter” variable regarding pricing of shares
Note: * 10% Signiicant; ** 5% Signiicant; ***1% Signiicant. Standard errors in brackets.
a Regressions estimated with standard errors robust in heterocedasticity. The normality assumption was relaxed by the Central Limit Theorem (Brooks, 2008).
The greatest VIF obtained in the regressions contained in this table was 1.099. Source: Developed by the authors.
Description Brazil U.S.A.
Model 25 Model 26 Model 27 Model 28 Model 29 Model 30 Model 31 Model 32
Const 0.462
(0.279)*
0.468 (0.275)*
0.448 (0.239)*
0.454 (0.238)*
0.834 (0.382)**
0.953 (0.394)**
1.011 (0.246)***
1.015 (0.246)***
NE_Ass 0.986
(0.513)*
0.982 (0.509)*
0.971 (0.489)**
0.975 (0.489)**
2.272 (0.658)***
2.229 (0.667)***
2.225 (0.672)***
2.223 (0.663)***
RI 4.351
(0.671)***
4.353 (0.678)***
4.350 (0.652)***
4.347 (0.652)***
0.001 (0.021)
0.001 (0.021)
0.001 (0.004)
0.001 (0.004)
LnOSTT 0.002
(0.026) - -
-0.019
(0.029) - -
-LnOTT - 0.001
(0.029) - -
-0.007
(0.040) -
-LnUOSTT - - 0.030
(0.030) - -
--0.017
(0.036)
-LnUOTT - - - (0.034)0.028 - - - (0.050)-0.029
R2 0.456 0.456 0.458 0.457 0.114 0.110 0.111 0.112
R2 adjusted 0.446 0.446 0.448 0.448 0.087 0.082 0.084 0.084
F (3.166) 17.829 18.050 17.086 17.141 4.128 3.971 10.620 10.267
F p-value 4.44e-10 3.47e-10 1.02e-09 9.59e-10 0.008 0.010 4.30e-06 6.33e-06
White Test 33.178a 36.348a 17.794a 17.892a 16.501 16.239 19.345a 20.203a
Akaike Criteria 521.719 521.728 520.936 521.187 361.330 361.765 361.640 361.582
Normality Test 158.852 159.770 164.065 163.484 113.554 110.915 107.666 107.643
As seen in Table 8, just like the results for the inluence of social networks on levels of information asymmetry for publicly traded Brazilian companies, unoicial Facebook afected the pricing of shares, reaching a 10% degree of sig-niicance, as can be veriied in Model 22 contained in Table 8.
his same model showed the best result for the adjustment of the regression variables, with an adjusted determination co-eicient of 0.457, compared to 0.449 in the Brazilian model without social networks, and indicating that the LnUOFB helped to improve the explanation for share price by 0.8%.
Table 10 Results from analysis of “Youtube” variable regarding pricing of shares
Description Brazil U.S.A.
Model 33 Model 34 Model 35 Model 36 Model 37 Model 38 Model 39 Model 40
Const 0.448
(0.251)*
0.461 (0.251)*
0.456 (0.244)*
0.465 (0.247)*
1.030 (0.356)***
1.091 (0.366)***
0.993 (0.264)***
0.995 (0.263)***
NE Ass 0.986
(0.490)**
0.981 (0.488)**
0.991 (0.492)**
0.985 (0.493)**
2.189 (0.660)***
2.149 (0.664)***
2.272 (0.732)***
2.285 (0.735)*** Table 8 Continuation
R2 0.456 0.467 0.110 0.113
R2 adjusted 0.446 0.457 0.083 0.085
F (3.166) 18.509 16.496 8.838 10.103
F p-value 2.09e-10 1.99e-09 0.000 7.59e-06
White Test 36.368a 42.257a 17.914a 21.165a
Akaike Criteria 521.728 518.291 361.764 361.510
Normality Test 159.923 166.923 108.595 100.53
Note: * 10% Signiicant; ** 5% Signiicant; ***1% Signiicant. Standard errors in brackets.
a Regressions estimated with standard errors robust in heterocedasticity. The normality assumption was relaxed by the Central Limit Theorem (Brooks, 2008).
The greatest VIF obtained in the regressions contained in this table was 1.143. Source: Developed by the authors.
Regarding the Twitter social network, no statistical in-luence of its use over the pricing of shares is veriied, both
An analysis of the inluence of the Youtube social twork presented similar results to the Twitter social ne-twork, since both the networks had no inluence over the pricing of the analyzed companies’ shares.
Although some of the social network variables linked to the U.S. companies statistically afect information asymmetry, via the results shown in Tables 8, 9, and 10, it is veriied that the social networks in the United States do not afect the pricing of shares for the companies listed on this country’s stock exchange, and that they only play a role in reducing the volatility of share prices, thus not supporting the results found by Hu et al. (2011), when analyzing U.S. companies’ blogs.
heoretically, through the relationship between risk and return, if social networks afect information asymme-try (informational risk), they should afect share prices at the moment in which information is released, which was found – without considering the efect of the moment of release – in Brazil. Yet, for the U.S. sample, the same result cannot be found, a fact that may be linked to the liquidi-ty and informational environment of this market, which is bigger than the Brazilian one, resulting in information being discounted from share prices faster than in Brazil; also similar to what was mentioned in section 2.1 in this study (Lee et al., 1993; Kim & Verrecchia, 1994; Blankes-poor et al., 2014).
Also worth highlighting, along with the results pre-viously mentioned, is that the efect of the social network interaction variables over asymmetry and pricing of sha-res was observed, however, it is concluded that there is no efect of this interaction on the dependent variables (data
not tabulated).
4.3 Result of Sensibility Analysis
For the sensibility analysis only the unoicial Face-book social network (LnUOFB) in Brazil was used. his fact is justiied by it being the only variable that exhibited statistical signiicance in the regressions previously pre-sented, separating into groups that use and those that do not use this social network.
he Kolmogorov-Smirnov test presented a statis-tic of 0.089* for the group that does not use unoicial Fa-cebook and a statistic of 0.103* for the group that uses it, thus displaying evidence of normal distribution. Carrying out the Levene test, a statistical result of 1.908 was rea-ched, by which the existence of homogeneous variances in the analyzed groups can be veriied.
As the two assumptions for the t test were met, the means parametric test can be used for the two inde-pendent samples. he t test was equal to -1.012, not exhi-biting statistical signiicance – thus making it possible to state that the groups do not have diferent average returns – similar, for example, to what was found by Blanco et al. (2015) in relation to the release of additional information and to competition between companies.
hrough these analyses, it can be emphasized that, despite Facebook apparently reducing information asymmetry, investors should not use this information to devise strategies for generating better returns, which is in line with the Eicient Market Hypothesis (EMH), as long as information is public and free, and not able to be used to generate abnormal returns.
Note: * 10% Signiicant; ** 5% Signiicant; ***1% Signiicant. Standard errors in brackets.
a Regressions estimated with standard errors robust in heterocedasticity. The normality assumption was relaxed by the Central Limit Theorem (Brooks, 2008).
The greatest VIF obtained in the regressions contained in this table was 1.102. Source: Developed by the authors.
RI 4.342
(0.665)***
4.348 (0.673)***
4.354 (0.651)***
4.356 (0.650)***
0.002 (0.021)
0.002 (0.021)
0.002 (0.005)
0.002 (0.005)
LnOYT 0.009
(0.029) - -
--0.005
(0.034) - -
-LnOVYT - 0.002
(0.014) - -
--0.009
(0.020) -
-LnUOYT - - 0.018
(0.043) - -
--0.027
(0.048)
-LnUOVYT - - - 0.003
(0.020) - -
--0.022 (0.033)
R2 0.456 0.456 0.456 0.456 0.110 0.112 0.112 0.113
R2 adjusted 0.446 0.446 0.446 0.446 0.082 0.084 0.084 0.086
F (3.166) 18.901 19.201 16.517 16.390 3.969 4.026 11.274 10.752
F p-value 1.35e-10 9.75e-11 1.94e-09 2.24e-09 0.010 0.010 2.11e-06 3.72e-06
White Test 30.267a 32.424a 18.179a 18.323a 15.881 15.609 18.668a 18.970a
Akaike Criteria 521.613 521.704 521.611 521.714 361.771 361.612 361.583 361.440
Normality Test 157.484 159.186 160.913 160.317 107.688 105.83 106.969 107.128
5. CONCLUDING REMARKS
he internet has become an important tool for com-munication, whether it is in the personal or professional ield. With its advance, social networks have emerged – used for divulging information, sharing opinions and debates worldwide. he results of this study have provi-ded evidence that various companies have used social ne-tworks as channels for communicating with their inves-tors and clients, among other users.
Announcing by means of social networks has coun-tless advantages for entities, such as: (i) reducing the costs of releasing information related to an entity; (ii) instanta-neous information; (iii) information captured by a greater number of users in a shorter period of time etc.
he results showed that Hypotheses 1 and 2 in this study were generally rejected by the Brazilian companies, with the exception of the unoicial Facebook social ne-twork, which exhibited statistical signiicance when its inluence over levels of information asymmetry and the pricing of shares was analyzed. Regarding the companies listed in the U.S. stock market, Hypothesis 1 was not re-jected for companies’ Facebook social networks, number of tweets, and number of views on Youtube, these
varia-bles being related to oicial proiles on social networks; however, for the U.S. market, Hypothesis 2 was rejected for all of the variables analyzed.
It is worth highlighting that this study only analyzed 2012 due to limitations regarding the gathering of data related to the social networks from previous years, due to the reasons already explained in the section on metho-dology. he quality of information posted on the social networks was another limitation of the study, since the content of information released on social networks was not analyzed, only the quantity. Another limitation that implied an unexpected result – though speciic to the U.S. sample – is the fact that the inclusion of only the 100 bi-ggest companies in this country, in terms of market ca-pitalization, may have afected the relationship between information asymmetry and company size, due to some speciic characteristic of these companies.
Akerlof, G. A. (1970). The market for ‘lemons’: quality uncertainty and the market mechanism. Quarterly Journal of economics, 84(3), 488-500.
Ball, R., & Brown, P. (1968). An empirical evaluation of accounting income numbers. Journal of Accounting Research, 6, 159-178. Beaver, W. H. (1968). The information content of earning
announcements: empirical research in accounting. Journal of Accounting Research, 6, 67-92.
Blanco, B., Garcia-Lara, J. M., & Tribo, J. A. (2015). Segment disclosure and cost of capital. Journal of Business Finance & Accounting, 42(3-4), 367-411.
Blankespoor, E., Miller, G. S., & White, H. D. (2014). The Role of Dissemination in Market Liquidity: Evidence from Firms’ Use of Twitter. The Accounting Review, 89(1), 79-112.
Bonsón, E., & Flores, F. (2011). Social media and corporate dialogue: the response of global financial institutions. Online Information Review, 35(1), 34-49.
Botosan, C. A. (1997). Disclosure level and the cost of equity capital.
The Accounting Review, 72(3), 323-349.
Brooks, C. (2008). Introductory econometrics for finance. 2 ed. Cambrigde: Cambrigde University Press.
Cao, Y., Myers, L. A., Tsang, A., & Yang, Y. G. (2014, November). Management Forecasts and the Cost of Equity Capital: International Evidence. Asian Finance Association (AsianFA) 2014 Conference Paper.
Cormier, D., Aerts, W., Ledoux, M. J., & Magnan, M. (2009). Attributes of Social and Human Capital Disclosure and Information Asymmetry between Managers and Investors.
Canadian Journal of Administrative Sciences, 26(1), 71-88. Drake, M. S., Roulstone, D. T., & Thornock, J. R. (2012, September).
Investor Information Demand: Evidence from Google Searches Around Earnings Announcements. Journal of Accounting Research, 50(4), 1001-1040.
Easley, D., Hvidkjaer, S., & O’Hara, M. (2010). Factoring information into returns. Journal of Financial and Quantitative Analysis, 45(2), 293-309.
Fama, E. F. (1970). Efficient capital markets: a review of theory and empirical work. The Journal of Finance, 25(2), 383-417.
Fu, R., Kraft, A., & Zhang, H. (2012). Financial reporting, frequency, information asymmetry, and the cost of equity. Journal of Accounting and Economics, 54(2), 132-149.
Hanna, R., Rohm, A., & Crittenden, V. L. (2011). We’re all connected: The power of the social media ecosystem. Business Horizons, 54(3), 265-273.
Hu, N., Liu, L., Tripathy, A., & Yao, L. (2011). Value relevance of blog visibility. Journal of Business Research, 64(12), 1361-1368. Hutter, K., Hautz, J., Dennhardt, S., & Füller, J. (2013). The impact
of user interactions in social media on brand awareness and purchase intention: the case of MINI on Facebook. Journal of
Product & Brand Management, 22(5-6), 342-351.
Jensen, M., & Meckling, W. (1976). Theory of the firm: managerial behavior, agency costs and ownership structure. Journal of Financial Economics, 3(4), 305-360.
Kim, O., & Verrecchia, R. E. (1994). Market liquidity and volume around earnings announcements. Journal of Accounting and Economics, 17(1), 41-67.
Lee, C. M. C., Mucklow, B., & Ready, M. J. (1993). Spreads, depths, and the impact of earnings information: An intraday analysis.
The Review of Financial Studies, 6(2), 345-374.
Leland, H. E., & Pyle, D. H. (1977). Information asymmetries, financial structure, and financial intermediation. The Journal of Finance, 32(2), 371-387.
Lopes, A. B., & Alencar, R. C. (2010). Disclosure and cost of equity capital in emerging markets: the Brazilian case. The International Journal of Accounting, 45(4), p.443-464. Martins, O. S. (2012). Relações entre assimetria de informação e as
características das empresas no mercado acionário brasileiro. Tese de Doutorado, Programa Multiinstitucional e Inter-regional de Pós-Graduação em Ciências Contábeis, UnB/UFPB/UFRN, João Pessoa, PB, Brasil.
Moreiras, L. M. F. (2010). Os efeitos da governança corporativa sobre a informação assimétrica. Tese de Doutorado, Escola de Administração de Empresas de São Paulo, Fundação Getúlio Vargas, São Paulo, SP, Brasil.
Ohlson, J. A. (1995). Earnings, Book Values, and Dividends in Equity Valuation Contemporary. Accounting Research, 11(2), 661-687.
Paulo, E. (2007). Manipulação das informações contábeis: uma análise teórica e empírica sobre os modelos operacionais de detecção de gerenciamento de resultados. Tese de Doutorado, Faculdade de Economia, Administração e Contabilidade, Universidade de São Paulo, São Paulo, SP, Brasil.
Recuero, R. (2009). Redes sociais na internet. Porto Alegre: Editora Sulina, 2009.
Rubin, A., & Rubin, E. (2010). Informed investors and the internet.
Journal of Business Finance & Accounting, 37(7-8), 841-865. Saito, R., & Silveira, A. M. (2008). Governança Corporativa: Custos
de Agência e Estrutura de Propriedade. RAE – Revista de Administração de Empresas, 48(2).
Shifman, L. (2011). An anatomy of YouTube meme. New Media & Society, 14(2), 187-203. doi: 10.1177/1461444811412160
Twitter. About Twitter. (n.d.). Retrieved on November 23, 2013, from https://about.twitter.com/
Yoon, H., Zo, H., & Ciganek, A. P. (2011). Does XBRL adoption reduce information asymmetry? Journal of Business Research, 6(2), 157-163.
Youtube. Sobre o Youtube. (n.d.). Retrieved on November 22, 2013, from http://www.youtube.com/t/about_youtube
References
Address for correspondence:
Marcelo Paulo de Arruda
Universidade Federal da Paraíba, Departamento de Finanças e Contabilidade Campus I – CEP: 58059-900